The Volume Weighted Average Price (VWAP) is an important trading benchmark used by many traders to analyze stock prices. VWAP reflects the average price at which a stock traded today. It takes trading volume and price to calculate the average.
The logic is that not all trades impact a stock’s price equally. Larger trade sizes (volumes) will influence the price more than smaller ones. So VWAP gives more weight to periods when heavy volumes were traded. This helps identify meaningful price levels.
To calculate VWAP, you first need price and volume data for all the stock transactions during the day. Then, for each transaction, you multiply the price with the traded volume. Add up these values for the entire day. Finally, divide the total traded value by the total volumes traded. This volume weighted average price reflects the consensus value of the stock, factoring in the key levels most volumes were exchanged.
Traders use VWAP to identify potential support and resistance levels for a stock. It shows the price zones with maximum activity through the day. Institutional investors utilize VWAP to understand how the stock price reacts to trades at different levels. This provides insights on opportune times to trade large volumes with minimal impact. Algorithmic traders aim to execute buy/sell programs close to VWAP through the day. The goal is to transact seamlessly without moving the price.
What is VWAP Indicator?
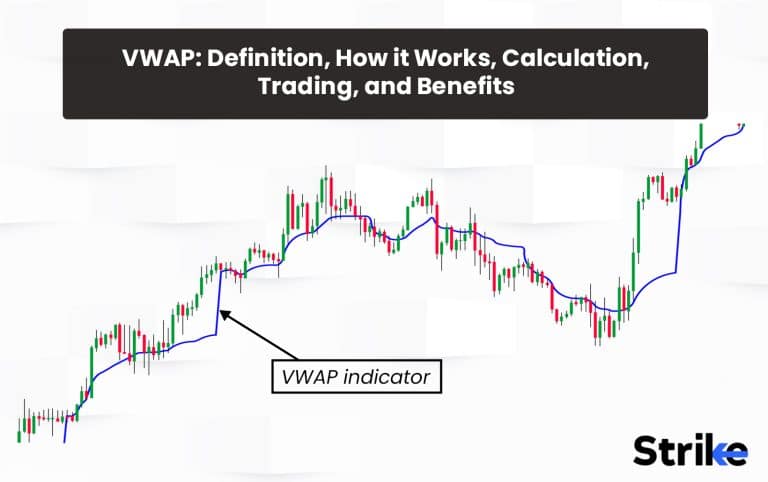
The volume weighted average price or VWAP is a technical analysis indicator used by traders to determine the average price of a stock over a certain period of time. VWAP weights the average price by the volume traded at each price point. So prices at which more volume is traded have a greater influence on the overall average compared to prices at which little volume is traded. It is represented as a black line in the trading chart. See the picture below.


VWAP helps traders. It confirms whether the stock is trading above or below the average price, which helps in determining good entry or exit points. For large institutional orders, VWAP is also used to benchmark execution quality. Traders want to ensure the price they get fills their order due to liquidity present around the VWAP resulting in least slippage.
The VWAP is calculated by taking the currency (₹) value of all trading periods within the specified time window and dividing by the total shares traded. The resulting price is the volume weighted average price. Mathematically, it is represented as:
VWAP = (Total ₹ Value of Shares Traded) / (Total Shares Traded)
or example, if a stock trades 700 shares at ₹10, then 300 shares at ₹15, and finally 100 shares at ₹20 over a given time period, the VWAP would be:
(700 x ₹10) + (300 x ₹15) + (100 x ₹20) / (700 + 300 + 100) = ₹12
So the VWAP gives the average transaction price of stock as ₹12 for that time period, even though the stock traded at different price points. The heavier volume at ₹10 impacts the average price more than the lighter volumes at ₹15 and ₹20.
The time period for calculating the VWAP is an intraday window like 1 minute, 5 minutes or 15 minutes. It is also daily, weekly or monthly. Traders often look for the stock price to rise above or drop below the VWAP lines to confirm entry or exit signals. A price rise above VWAP indicates buying pressure, while a drop below VWAP indicates selling pressure.
What is the importance of VWAP in Technical Analysis?
The Volume Weighted Average Price, or VWAP gives a snapshot of the average stock trading price based on both price and volume – serving as an indication of where stocks are trading over a specific time frame based on these two variables. The Value Weighted Average Price, or VWAP, is determined by summing all rupees traded during a trading day and dividing by total shares traded – this provides a true average price that takes into account both price and volume. It acts as both support or resistance level since prices tend to converge towards this average over time; when moving higher it indicates increased trading activity while when declining it indicates selling pressure.
Traders use the VWAP for various purposes.
First, it helps traders determine the general direction of stocks over time: If their price is above or below the VWAP respectively, that indicates strength or weakness respectively. Furthermore, traders use VWAP for scalping to intraday purposes due to evident reactions around the VWAP. Traders look for either the tradesetups during retracement or breakouts.
The VWAP provides a much more accurate estimation of stock average prices than simple averages do. By taking volume into account with each trade price, this indicator removes any distortion caused by extremely high or low volume trading; creating a truer midpoint of where most trading is occurring in any particular stock. Active traders using price action in conjunction with VWAP find this indicator particularly valuable in understanding intraday price movements and trends, making for an invaluable addition to their trading strategy.
How does VWAP Indicator work?
The VWAP indicator works by showing the average price weighted by volume. This means that periods of the day with heavier volume and bigger trades have a greater influence on the VWAP. VWAP is used to determine the intraday trend and see if prices are moving up or down. Prices above VWAP indicate an uptrend and if below it shows a downtrend. VWAP also acts as a support or resistance level. Prices decline to VWAP act as a support. And if prices rally up to VWAP, it could act as resistance. VWAP above the closing price indicates buying pressure and bullish sentiment.
A VWAP below the closing price shows selling pressure and bearish sentiment., It could signal a reversal from a downtrend to uptrend If the price crosses above VWAP. And Price crossing below VWAP indicates a reversal from an uptrend to downtrend. VWAP is also used to set stop-loss or take-profit levels. Traders choose to exit long positions below VWAP or exit short positions above VWAP. In the chart uploaded below, the time frame of the chart is 5min and the script is nifty 50. Look how the black line (VWAP) is producing significant high probability trading opportunities highlighted by the purple box.

How to read VWAP in Stock Chart?
Looking at a stock chart, the VWAP line will appear as a smooth curving line
The VWAP line shows the flow of the stock price based on the volume of shares traded at each price. They will look at how the current stock price relates to the VWAP. A stock trading below its VWAP indicates it is undervalued, while trading above the VWAP could mean it is overvalued. The VWAP line also highlights important price levels that could provide support or resistance to future stock price moves.
The chart below shows NiftyBank’s 5 min chart and black line is the VWAP.

For example, looking at the chart uploaded above, these are the readings the traders are supposed to observe:
- When Banknifty broke above or below the VWAP, the price showed some significant moves. Either the price reacted properly or sometimes the price failed to continue the upside in case the price broke above the VWAP.
- When Banknifty breaks above or below the VWAP, it provides some long or short trade setups.
- After breakout, Banknifty managed to react after arriving at the VWAP giving potential trade opportunities on even lower time frames like 1 min – 3 minutes. The reaction is highlighted in the purple box.
- VWAP continues to act as a support or resistance for banknifty until and unless the VWAP is broken on either side. This information is critical during a trading plan to validate a trade setup before executing as the traders get a better sense of momentum and directional bias.
- VWAP gives critical levels for stop loss placement, a high risk:reward ratio can be achieved if trades are taken at the VWAP. This gives space for high profitability.
- The VWAP is a simple but effective tool for analyzing a stock. When used in conjunction with other indicators like volume, momentum oscillators and chart patterns, it provides traders with insight into the overall trend and strength of a stock.
What is the VWAP Formula?
The VWAP formula can be calculated using the formula VWAP = (Total Rs Traded)/ (Total Shares Traded). Below are the steps for calculating this formula.
- Decide the specific timeframe for VWAP calculation. This could be any period – full trading day, partial day or multiple days; here we’ll focus on daily VWAP calculations.
- Add up each transaction that took place during the day in rupee values; for example, if 100 shares traded at Rs. 10, add Rs. 1,000; if 200 traded for Rs. 15, add Rs. 3,00; continue in this fashion for all trades that took place that day.
- Add up all the shares traded during the day; for example, 100 + 200 = 300 shares so far in our example trades. Calculate this total across all trades.
- Divide the total Rs from step 2 by the total shares from step 3. For instance, the daily total was Rs 100,000 and 10,000 shares had been issued during a given day, then VWAP would equal VWAP = Rs. 100.00 per dollar of VWAP value.
VWAP value of Rs. 10 would then appear as a line on the stock chart to indicate an average daily trading price based on both transactions and shares traded at each price level.
Traders are then able to observe where the current share price stands relative to the VWAP and make decisions based on that relationship. If price pulls back toward or breaks above VWAP, it could provide a potential entry point; otherwise it shows strengthening momentum. The VWAP formula serves as an important guideline for intraday trading and analysis.
How to Calculate VWAP Indicator?
The calculation of VWAP is not necessary because VWAP is a popular trading indicator that is available for free on all the charting trading platforms. Type VWAP to select from the list of indicators and apply it on the chart. VWAP is useful only on lower time frames; from 1 min – 15 min.
How is volume factored into the VWAP calculation?
VWAP is calculated by multiplying the typical price by volume and dividing by the total volume.. Below is how to factor volume into the VWAP calculation, using the Indian Rupee (Rs.) as the currency. First, calculate the Typical Price for each period (e.g., minute, hour). The Typical Price is the average of the high, low, and closing prices of a security for a specific period.
Typical Price = (High + Low + Close) / 3
Next, multiply the Typical Price by the volume (number of shares traded) for that period.
Price x Volume = Typical Price * Volume
Calculate the cumulative sum of the Price x Volume values for all periods.
Cumulative (Price x Volume) = Σ(Price x Volume)
Calculate the cumulative sum of volumes for all periods.
Cumulative Volume = Σ(Volume)
Finally, divide the cumulative sum of the Price x Volume values by the cumulative sum of volumes to get the VWAP.
VWAP = Cumulative (Price x Volume) / Cumulative Volume
Let us look at an example.
| Period | High (Rs.) | Low (Rs.) | Close (Rs.) | Volume | Typical Price (Rs.) | Price x Volume (Rs.) |
| 1 | 100 | 95 | 98 | 1000 | 97.67 (approx.) | 97667 |
| 2 | 105 | 98 | 102 | 2500 | 101.67 (approx.) | 254167 |
| 3 | 110 | 100 | 105 | 1500 | 105 | 157500 |
Cumulative (Price x Volume) = 97667 + 254167 + 157500 = 509334
Cumulative Volume = 1000 + 2500 + 1500 = 5000
VWAP = 509334 / 5000 = 101.87 Rs. (approx.)
How does the time period used for the calculation of VWAP affect its accuracy?
The time period used to calculate the VWAP indicator affects its accuracy. Shorter time periods, like intraday VWAP calculations, provide a more granular view of the average price weighted by volume. Since it captures price and volume over a shorter window, it shows more short-term trends and reversals. However, intraday VWAP is more volatile and prone to temporary price swings. It requires frequent data updates and calculations which is time-consuming.
Longer time periods, like daily, weekly or monthly VWAP, smoothen out short-term fluctuations and capture longer-term trends. The VWAP values do not change as drastically since the calculation period is longer. However, longer time periods mask some short-term trends and reversals. The VWAP is less responsive to recent changes in sentiment or events.
For proper effectiveness of the VWAP, intraday time frames should be used. From 1 min chart settings to 15 minutes, VWAP will provide a lot of benefit for these lower time frame settings. The effectiveness will vanish if VWAP is used on longer time frames like Daily or weekly because the price simply won’t provide enough insights. Thus VWAP is an extremely valuable tool for measuring sentiment and momentum.
How to use VWAP as a benchmark for evaluating the performance of their trades?
VWAP has extreme usefulness when used as a benchmark for evaluating trades. Due to the sensitivity and reactivity of the price level it reflects. These are the six ways:
Below are six ways to use VWAP as a benchmark for evaluating your trades.
1. Compare your entry price to the VWAP.
If you entered the trade at a price below the VWAP, that’s good – you got in at a better price than the average. Trade above the VWAP means your entry was at a worse price than average.
Timely entry during retracements at the VWAP provides a good entry point and stop loss placement.
2. Compare your exit price to the VWAP
Exiting at a price above the VWAP means you sold at a better price than average. Selling below the VWAP means your exit was at a worse price.
3. Calculate your profit/loss relative to the VWAP.
You entered below VWAP and exited above VWAP means your trade likely captured a higher profit than the average move. Entering above and exiting below VWAP probably resulted in underperforming compared to the average.
4. Holding time
Calculate how long you held the position relative to the average holding period implied by the VWAP. Holding longer than average means you have missed some of the average price move. Holding for less time means you have captured more or less than the average profit.
5. Range
Use the day’s range and VWAP levels to evaluate your entry and exit relative to the “value zone.” The value zone is the price range where the bulk of the day’s volume was done. If your trade was within this zone, it was positioned to capture the maximum potential. Outside this zone means your timing have been too early or too late.
6. Track
Track these VWAP comparisons over many trades to determine if you have a tendency to enter too early or too late, hold too long or not long enough, take profits too quickly or leave money on the table, relative to the average implied by the VWAP. Adjust your trading accordingly.
VWAP is a very useful benchmark to determine if your trading performance is above, below or in-line with the average, and reveal habits and tendencies to improve on.
How do traders utilize VWAP to find trade entry and exit points?

In the chart uploaded above, the black line simply represents the VWAP of the stock named HDFCBANK. The time frame of the chart is 5 minutes.
The numbers from 1 – 7 are the list of readings, these are the list of readings.
- If the price of the stock breaks below the VWAP, it indicates potential trend towards downside. Scalpers and daytraders could have utilized this knowledge for scalps and entries on 1 – 3 minute time frames.
- If the price breaks and sustains below the VWAP, the line will act as a resistance. This value or price of VWAP could have been used by shorters to short the stock whenever the stock retraced back to VWAP.
- The third scenario shows how the fake out occurs. The price kept sustaining below the VWAP until it suddenly broke above it. This was a classic fakeout trapping breakout buyers. The shorters could have placed an exit Stop loss just above the VWAP.
- In the fourth scenario, if the price breaks strongly above the VWAP, the price of the stock manages to climb, benefiting scalpers and intraday trend traders to place entries just above the VWAP.
- If the VWAP fails to act as a support highlighted by the 5th point on the chart, it will shift the momentum from upside to downside, suddency acting as a resistance. High Risk:Reward trade setup is right at the black line, represented by the purple boxes.
- Price managed to break above the VWAP with strong candles and sustained above the line.
- Scalpers and day traders could have positioned long side on the final retracement and place a safe stop just below the VWAP.
This is how VWAP can be extremely useful for intraday traders or short term traders to time entries for breakout trades and entries for retracement trades. VWAP also helps placing protective stop losses with high Risk:Reward. VWAP works well when combined with other indicators like price action patterns, moving averages, fibonacci retracements etc. VWAP is for mini trends within the overall trend.
How can VWAP be used to identify market trends and momentum?
VWAP is crucial. It is used to identify market trends and momentum in the following ways :-

In the chart uploaded above, we will examine how the black line (VWAP) helps a trader understand the trend and momentum of the stock. The respective stock is Banknifty and the time frame of the chart is 5 minutes.
- Market opened with a huge momentum and price of the script closed above the VWAP.
If prices close above the VWAP, it is generally considered as an indication of an uptrend. Several day traders might have taken a long trade based on this one simple indication. - The uptrend is thus identified and retracement and bounce from the VWAP is expected. If the price retraces towards the VWAP and closes above it, it is considered as a bullish signal and a trade is taken. The red horizontal line represents the protective Stop loss of the long players.
- The upward momentum is identified and the third scenario is observed. Prices retraced back to VWAP and even closed below the VWAP signaling fake downside. As the original upward momentum was identified, after a while, a strong candlestick pattern appeared. Scalpers and day traders could have identified this long setup. And placed the stop loss as shown by the red line.
- In the 4th scenario, if the price breaks strongly below the VWAP, it is considered as a downward shift and look how the price sharply traveled below.
This is how observing price action around VWAP on different time frames provides a complete picture about the trend and momentum of the markets. And this is how scalpers and day traders use VWAP extensively to time entries and exits after the identification of the initial trend and momentum.
Is Stock Market best suited for using VWAP?
Yes, the VWAP calculation is best suited for use in the stock market. It is because VWAP relies on continuous trading and high volume to be meaningful. The stock market has a large volume of trades executing throughout the day, so the VWAP calculation will incorporate a robust set of data points. Other markets with lower trading volume or more sporadic trading produce a less useful VWAP.
VWAP works best when there is a lot of intraday price fluctuation. The more the price moves around during the day, the more a VWAP can reveal about the average price and value zone. The stock market tends to be one of the most volatile intraday markets, so VWAP applies well.
How can VWAP be used in conjunction with other Indicators to improve trading?

The chart uploaded above is the Banknifty’s 5 min chart. The black line is the VWAP, the blue line is a 50 period Simple Moving Average. The MACD indicator is also applied on the chart.
This image is to illustrate how a trading plan is constructed by adding confirmations and confluences from other indicators.
The purple box reflects the potential trade opportunity that got constructed due to these reasons:
- Price of the Banknifty managed to sustain above the black line for few hours. The price finally broke below the VWAP and sustained for a long time below it.
- Few hours later, price managed to resist around the intersection of two lines as shown in the image above, black line and blue line, as the blue line reflects 50 – SMA. The price kept resisting around the SMA.
- The MACD lines also crosses below the zero line.
- Candlestick patterns like doji and evening stars are identified to further solidify a trading plan for the short side.
This way, 46825 was identified as an action point for a trade towards downside due to multiple confluences gathered from VWAP, SMA, MACD and the candlestick patterns. Traders thus can construct trading plans according to how strong the price action and indicators are indicating.
Risk management is crucial and thus it should be taken into account. VWAP helps achieve higher probability, high risk:reward setups and protective placement of stop losses.
How does VWAP differ from other trading indicators, such as Moving Averages?
| VWAP | Moving Averages |
| VWAP offers a volume-weighted price average focused on current and recent data | MAs provide a longer historical price average better suited for tracking long-term trends. |
| VWAP incorporates volume in its calculation | Simple moving averages only consider price. |
| It shows at what price the majority of trading activity is happening | SMAs just give a basic average of price over a period of time without consideration of volume. |
| VWAP reacts faster to changes in trend direction. | SMA reacts slower to changes in trend direction. |
| VWAP only incorporates data from the trading period specified, like intraday or daily. | SMAs include some past data, like the daily close price over 50 days or 200 days or any period unlike VWAP. |
| VWAP act more as an intraday tool | SMAs act as intraday – short term – long term tool. |
| VWAP values change with each trading period since volume is continually updated. | SMA values only change when a new data point enters the average and an old data point drops out. |
| VWAP changes incrementally | SMAs often change more abruptly. |
| VWAP helps capture momentum reversals and day or swing trading opportunities. | SMAs track the primary trend for position trading and investing purposes over weeks or months. |
Can VWAP be used together with other Charting Patterns to improve trading?
Yes, VWAP is used together with other charting patterns and technical analysis tools to improve your trading. Below are six ways to combine VWAP with other indicators include.
Use VWAP along with support and resistance levels
Look for trades where the price is pulling back to test a support level that is at or near the VWAP. An already present support or resistant zones act as an added confirmation or confluence for validating a trade setup.
Combine VWAP with chart patterns like triangles, flags or wedges
Look to enter a trade on a breakout from one of these patterns, especially if the breakout occurs at or near the VWAP. The VWAP confirms the significance of the technical level.
Use VWAP with moving averages.
Look for instances where price, moving averages and VWAP are intersecting. When this happens, it usually results in a stronger validation of a setup. Breakout trades or trades during retracement around the VWAP and moving averages can be identified.
Combine VWAP with oscillators like RSI or MACD
Look for overbought or oversold signals from an oscillator that correspond with tests of the VWAP. This indicates the potential for a reversal to quickly come, with value emerging at that VWAP level.
Use trend lines along with VWAP
Draw upward trend lines that connect previous low pivot points. Look for the price to come back and test the trend line, especially if the test occurs at or near the VWAP. This indicates the trend is likely to continue higher from a value zone.
Using VWAP together with other technical tools magnifies the significance of that calculation and makes it much more powerful as an actionable trading concept. The key is finding confluences – where multiple indicators point to the same signals or levels, especially as they relate to the VWAP. Combining technicals with VWAP in this way can greatly improve your trading entries, exits and decisions.
What are some common applications of VWAP in algorithmic trading?
Brokers and funds use algorithms to execute large orders while maximizing price efficiency based on VWAP. The algorithms break up the order into smaller chunks and execute them incrementally to achieve an average execution price close to the VWAP, reducing market impact.
Algorithms look for price discrepancies between VWAP and the prices on different exchanges or dark pools.
Spreads widen sufficiently indicates the algorithms execute trades to capture the arbitrage profit. VWAP allows measuring fair value to identify when prices deviate and arbitrage is possible.
Algorithms detect when price crosses above or below VWAP, signaling a change in intraday momentum. The algorithms place buy or sell orders in anticipation of further price movement in the breakout direction while managing stops at VWAP. They aim to capture momentum swings. Algorithms monitor price in relation to VWAP to detect reversals early and place trades accordingly with tight stops, attempting to capture swift price moves in the new trending direction.
Heavy volume pushing price away from VWAP alerts algorithms to the balance of power between buyers and sellers. Algorithms assume the trend will continue in the direction of whomever is most aggressive and places trades to follow the dominant market players, bulls or bears. Stops are placed around VWAP in case of a sudden reversal. VWAP often acts as an intraday support or resistance level.
Algorithms detect price stalling or reversing around the VWAP and place buy or sell orders anticipating a pivot off this key level. They aim to profit from the resumption of the prevailing trend after pausing at the volume-weighted average price. Price moving back to VWAP after breaking out indicates algorithms monitor how price action unfolds around VWAP. Strong buying or selling pressure pushing price away from VWAP again confirms the trend. Lack of follow through volume results in exiting positions for minimal loss.
How accurate is VWAP?
No indicator or tool is accurate. Yes, VWAP is definitely precise with its effectiveness. The accuracy of VWAP is not constant and it depends on key factors. Below are seven factors that affect the accuracy of VWAP. For its optimal usage, it should be combined with other indicators for a stronger trading plan to avoid false signals generated during intraday volatility and fluctuations.
Multiple scalping and day trades can be generated with the help of VWAP, if it is used wisely.
Should you buy above VWAP?
No, but buying above VWAP is justifiable in some situations; however, you need a strong justification and must do it with the knowledge of potential risks. In many instances it would be prudent to wait until a stock returns back towards VWAP or another support level before making your decision. Below are a few situations when buying above VWAP could be justifiable.
Short term stock buying could have reached overbought levels and is due for a pullback, meaning buying above VWAP reduces your buffer room in case the stock dips back below your purchase price. VWAP often acts as support or resistance so by betting above it you are betting that the stock will continue rising without returning back down towards VWAP in the short term – you have less margin of safety with such investments; so to generate profit when trading above a key reference point like VWAP you need it to rise steadily enough for it not return back into it’s orbit.
Is VWAP bullish?
No, VWAP itself is a neutral indicator – it simply represents the average price of a stock over a period of time based on both price and volume. There are some situations where VWAP can indicate a bullish or bearish bias. A stock closes above VWAP shows that the bulls were in control for most of the day and able to drive the price higher. This is a mildly bullish sign.
Can VWAP be used to identify potential entry and exit points in a trade?
Yes, VWAP is useful for identifying potential entry and exit points in a trade. A stock pulling back to VWAP during an uptrend presents a buying opportunity. VWAP often acts as support, so there is a good chance the stock will bounce from VWAP and the trend will continue higher. This is a good entry point. A stock rally up to VWAP during a downtrend presents an opportunity to exit a short position or sell long shares. VWAP often acts as resistance, so there is a good chance the stock will stall at VWAP and the downtrend will continue lower. This is a good exit point.
Monitoring a stock’s price action around key VWAP levels is a useful way to identify momentum and spot potential inflection points. Buying as a stock moves above VWAP or selling as it falls below VWAP on a swing can yield high-probability entry and exit points for trades.
What are the Benefits of VWAP Indicator?
The biggest benefit of VWAP is the fact that it is volume-weighted. Below are eight main benefits when you use VWAP for your trading.
1. Volume weighted
VWAP incorporates volume into its calculation, weighting price levels where more volume is traded more heavily. This provides an accurate measure of the average price of a stock based on the volume of shares actually traded. VWAP reflects where real buying and selling activity is happening.
2. Removes price distortions
VWAP smooths out temporary price fluctuations and distortions, giving a more stable average price over the specified time period. The high volume areas have the greatest impact on VWAP while noisy price action carries little weight. VWAP filters out market noise.
3. Tracks intraday sentiment
VWAP is used to gauge the intraday trend and changes in buying or selling pressure. A rising VWAP shows buying demand while a falling VWAP indicates selling. Crossing above/below VWAP signals a potential reversal in sentiment. Intraday traders use VWAP to follow sentiment shifts.
4. Benchmarks execution quality
Traders and brokers refer to VWAP to determine if they are obtaining the best possible price when executing orders. An execution price close to VWAP is considered optimal since it reflects the average transaction price for the volume of shares traded. VWAP acts as a benchmark for performance analysis.
5. Detects momentum
Price moving away from VWAP shows increasing momentum in that direction as either buyers or sellers gain control. Widening spreads between price and VWAP highlight accelerating momentum. When the spread narrows, it signals weakening momentum that could foreshadow a reversal. VWAP captures momentum magnitude.
6. Acts as support/resistance
VWAP often acts as an area of support or resistance for intraday price action. Price stalling, pausing or reversing at VWAP highlights these levels and provides potential trading signals. Breaking support/resistance at VWAP confirms a continuation of the trend. Traders focus on VWAP interaction.
7. Volume confirmation
Monitoring volume when price approaches VWAP helps determine if support/resistance will hold. Heavy volume pushing price away from VWAP after interacting with it confirms the prevailing sentiment and trend. Light volume at VWAP suggests a lack of commitment and leads to a reversal. Volume confirms VWAP signals.
8. Optimizes algorithms
VWAP is used as a performance metric for algorithms to maximize efficiency. Algorithms are optimized based on parameters like speed of VWAP mean reversion, volume thresholds and trending power. Continual tuning using VWAP helps algorithms achieve the best possible outcomes from detecting sentiment and momentum shifts. VWAP acts as a feedback loop for machine learning algorithms.
VWAP provides benefits to active traders and algorithms through its stable volume-weighted price average, ability to track intraday sentiment changes, highlight momentum, act as support/resistance, show volume confirmation and optimize algorithmic performance. VWAP’s volume weighting provides an advantage over other indicators, giving it a central role in analysis and strategies for short term and automated trading.
What are the Limitations of VWAP Indicator?
Below are seven main limitations of the VWAP indicator. Understanding the limitaions will help you use the indicator better.
1. Time period dependent
VWAP is calculated based on a specific time period, like 1-minute, 5-minute, daily or weekly charts. The VWAP values and signals differ substantially between time periods. Traders need to determine the appropriate period for their objectives, which is complex. Time period selection is a limitation.
2. Volume weighted only
VWAP considers volume in its calculation,but it does not account for other factors like volatility, sentiment or momentum. It provides a volume-weighted price average but lacks other data that influence trend development or reversals. VWAP need to be combined with other indicators to gain more context.
3. Data intensive
Calculating VWAP requires price and volume data for every transaction over the defined time period. This is resource intensive, especially on shorter time frames. Not all trading software or data services provide the data needed to calculate VWAP, especially for algorithmic purposes. Lack of data is a limitation.
4. Prone to lagging
VWAP is an averaged calculation over a time period, and it lags in signaling trend changes. Price moves above or below VWAP with some delay after a reversal, while traders aim to detect reversals early. VWAP works best when used in conjunction with other indicators not prone to lagging like pivot points or candlestick patterns.
5. Inaccurate for illiquid stocks
VWAP requires strong volume and price activity to calculate a meaningful volume-weighted average price. For stocks with low liquidity, wider spreads and more volatile price action, VWAP proves inaccurate or misleading due to lack of robust data. VWAP should not be used for the thinnest, most illiquid stocks.
6. Difficult to optimize
Optimizing algorithms based on VWAP is challenging since it depends on multiple inputs like time period, volume thresholds and reversion speed. VWAP statistics provide a lot of data that requires significant testing to determine the right optimization parameters. Continual tuning through machine learning is needed but complicates algorithm design.
7.Prone to false signals
VWAP sometimes generates false signals that lead to bad trading decisions if not confirmed. Volume pushing price away from VWAP is not always a continuation or reversal. Price stalling at VWAP does not always act as definite support or resistance. False signals are a risk and limitation.
VWAP provides significant benefits for analyzing intraday price action but also limitations that traders must be aware of. Understanding both the strengths and weaknesses of VWAP allows using it optimally and avoids common pitfalls like lagging signals, false triggers or inaccurate readings. Combining VWAP with other indicators and techniques helps overcome its limitations and improve overall accuracy. But no indicator is perfect or impervious to downsides.
What are the common mistakes Traders make when using VWAP?
VWAP is a useful trading indicator but is prone to mistakes without proper understanding and experience. Below are ten common mistakes traders make while using VWAP.
1. Using the wrong time period
Selecting a time period that does not match trading objectives. Intraday traders should use shorter periods like 1 or 5 minutes, while swing traders prefer daily or weekly VWAP. Choosing a mismatched period reduces effectiveness.
2. Not combining with other indicators
Relying on VWAP alone is a mistake. VWAP should be combined with indicators like moving averages, MACD, pivot points or candlestick patterns to confirm signals and overcome lagging. VWAP lacks some data that other indicators incorporate. Multiple indicators together provide a more robust analysis.
3. Initiating trades without confirmation
Placing trades based on a single VWAP signal without any confirming evidence from other indicators or patterns. A confirmation of the VWAP signal from an additional source provides more confidence and a higher chance of success. Lack of confirmation increases risk.
4. Not monitoring VWAP in multiple time frames
Viewing VWAP in only a single time period and missing the bigger trend picture. VWAP should be studied in both short and longer term periods. For example, a 15-minute VWAP signal an uptrend while 4-hour VWAP is signaling a reversal. Using multiple time frames gives more comprehensive analysis.
5. Not accounting for manipulated periods
Some periods experience price or volume manipulation that distorts VWAP values. Traders should be aware of the possibility of VWAP manipulation and review surrounding periods as well. Manual confirmation of automated signals is recommended. Manipulation can trigger false signals.
6. Not continually optimizing algorithms
Not optimizing algorithms through machine learning and backtesting to maintain peak performance. Markets change, so algorithms need to adapt. Set-it-and-forget-it algorithms will deteriorate over time without optimization. Performance monitoring and re-tuning is key.
7. Reacting too quickly to reversals
Readying a position reversal as soon as the price crosses VWAP. Some false breakouts occur. It is best to wait for a closing price above/below VWAP or additional confirmation. Reversals require conviction before reversing stance. Premature reactions lead to unnecessary losses and whipsaws.
8. Not practicing enough
Gaining experience with VWAP through regular use and application. Like any indicator, VWAP takes practice to use accurately. Reviewing historical examples and outcomes allows for determining optimal parameters and interpretation of signals for a given trading style or objective. Lack of practice with VWAP reduces proficiency.
Traders should avoid costly errors by being aware of the common pitfalls of VWAP usage and taking steps to overcome them through careful analysis, optimization, confirmation and continuous learning. Employing best practices with VWAP leads to the most efficient and effective usage.


 Previous Article


![15 Investing.com Alternatives [Free+Paid] You Should Use in 2026](https://www.strike.money/wp-content/uploads/2026/04/Investing.com-Alternatives.jpg "15 Investing.com Alternatives [Free+Paid] You Should Use in 2026 88")
![15 TradeStation Alternatives [Free+Paid] You Should Use in 2026](https://www.strike.money/wp-content/uploads/2026/04/TradeStation-Alternatives.jpg "15 TradeStation Alternatives [Free+Paid] You Should Use in 2026 89")
![15 Chartink Alternatives [Free+Paid] You Should Use in 2026](https://www.strike.money/wp-content/uploads/2026/04/Chartlink-Alternatives.jpg "15 Chartink Alternatives [Free+Paid] You Should Use in 2026 90")
: Overview, 10 Types of Indicators, Settings for Different Markets 91")


 : Definition, Formula, calculation, Uses, Advantages Vs limitations 94")


No Comments Yet.