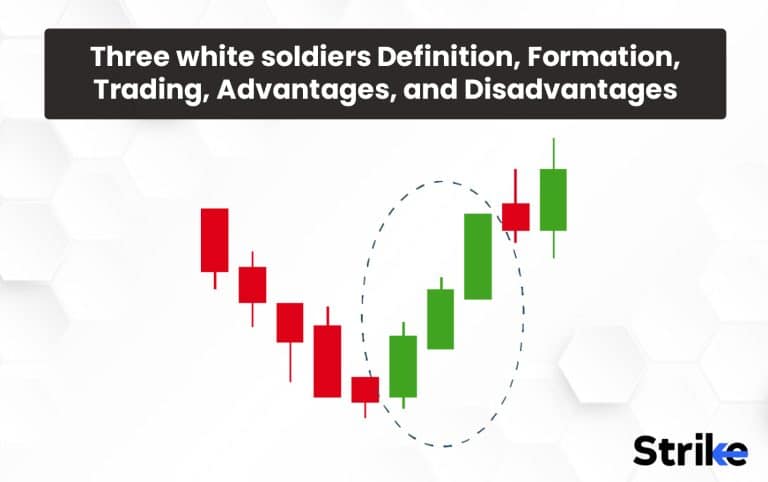
Three white soldiers is a candlestick pattern, often referred to as a “bullish” candlestick pattern. Three white soldiers are used in technical analysis to identify potential buying opportunities. This pattern develops when three continuous long bullish candles indicate a strong upward trend on a chart. The opening price of each candlestick should also be above the previous day’s high.
Market participants consider this pattern a reliable bullish reversal pattern because it indicates buyers are taking control of the market and pushing higher prices. This technical analysis pattern is not foolproof, and traders should always use it with other technical and fundamental analysis tools to confirm the trend.
What is the Three white soldiers candlestick pattern?
The “Three White Soldiers” is a bullish candlestick pattern that appears on a chart, and traders use it to identify potential trend reversals or the continuation of an existing uptrend. Three long-bodied candlesticks with little to no shadow at the top or bottom close successively higher than the preceding candlesticks to form the pattern.
The three white soldiers is formed when the price action consists of three consecutive long-bodied candles that close near their highs with little or no wick. This suggests buyers were in control during each session, continuously bidding the price higher. The pattern shows strong and persistent buying pressure that overwhelms selling pressure. Prior reversal signals like doji candles may precede the emergence of this pattern. The three white soldiers pattern implies existing downtrends may reverse as buyers gain control and start pushing the asset higher. However, as with any technical analysis indicator, it should be combined with other signals to confirm the emergence of a new uptrend. This bullish multi-candlestick formation is the opposite of the bearish three black crows pattern. This type of triple candlestick pattern indicates that the downtrend is possibly over and that a new uptrend has started.
How are Three white soldiers Candlestick Formed?
Three consecutive long-bodied candlesticks form the “Three White Soldiers” candlestick pattern, each closing higher than the previous candlestick.

Here are three steps about the formation of three white soldiers candlesticks.
- The first candlestick is a long bullish candlestick representing a strong buying sentiment. This candlestick should have little to no shadow on the top or bottom.
- The second candlestick is also a long bullish candlestick that opens higher than the previous candlestick and continues to trade higher throughout the session. This candlestick should also have little to no shadow on the top or bottom and close above the previous candlestick’s closing price.
- The third candlestick is a long bullish candlestick that opens higher than the previous candlestick and continues to trade higher throughout the session. Like the previous two candlesticks, it should have little to no shadow on the top or bottom and be close above the previous candlestick’s closing price.
The Three White Soldiers pattern indicates a strong bullish sentiment and potential reversal of a previous downtrend. Traders look for other confirmation signals, such as higher trading volume or support levels, before entering a trade based on this pattern.
What does Green Three white soldiers Candlestick tell?
The Green Three White Soldiers is a bullish candlestick pattern in technical analysis, typically seen on stock charts. It consists of three consecutive long green (or white) candlesticks, each with a higher close than the previous day and each opening above the last day’s opening. The pattern indicates a strong bullish sentiment in the market, with buyers taking control and driving prices higher.
Traders often interpret this pattern as a signal to buy the stock or asset, suggesting that the trend will likely continue upward. It is important to note that no single indicator or pattern can guarantee future price movements, and traders should always use other forms of analysis and risk management strategies in their trading decisions.
How Important is the Color of the Three White Soldiers Candlestick?
The color of the Three White Soldiers candlestick pattern is important as it indicates the strength of the bullish momentum in the market. Each candlestick represents a bullish candle, meaning the closing price is higher than the opening price. The color of each candlestick are either white or green, depending on the charting software used.
The color of the Three White Soldiers pattern does not significantly impact the interpretation of the pattern itself. Some traders, however, prefer to use a green color to represent the bullish candles as it is a more intuitive color to indicate bullishness.
When does Three white soldiers Candlestick happen?
The Three White Soldiers candlestick pattern is a bullish reversal pattern that occurs during a downtrend. It consists of three consecutive long bullish candles, each with a higher close than the previous one and with small or no upper wicks.
This pattern indicates a strong shift in market sentiment from bearish to bullish, and it acts as a reliable signal that the trend has reversed and the price continues to rise. Traders should, however, look for confirmation from other technical indicators and price action before making any trading decisions.
How often does Three white soldiers Candlestick occur?
The frequency of the Three White Soldiers candlestick pattern depends on the analyzed time frame and market conditions. This pattern is generally less common than other candlestick patterns because it requires three consecutive long bullish candles with higher closes, which may indicate a significant shift in market sentiment. It can still occur frequently in some markets or during periods of strong bullish momentum. Although the candle is rare, it has an average 80% win rate.
How to read Three white soldiers Candlestick in Technical Analysis?
Traders typically look for the following characteristics while reading the Three White Soldiers candlestick pattern in technical analysis:
- Downtrend: The pattern occurs during a downtrend, indicating that the bears are losing control and the bulls are taking over.
- Three consecutive bullish candles: The pattern consists of three consecutive long bullish candles with higher closes, indicating that the buying pressure is increasing and the bears are out of the market.
- Small or no upper wicks: The candles should have small or no upper wicks, indicating that the bulls have maintained control throughout the entire trading period.
- Volume: Each bullish candle in the pattern should have higher than average trading volume, indicating that the bulls are gaining strength.
The Three White Soldiers pattern can signal a bullish reversal when these characteristics are present during technical analysis.
How accurate are the Three white soldiers Candlestick in Technical Analysis?
The pattern is generally considered a reliable signal of a bullish reversal, but it should not be relied on solely to make trading decisions. Traders should always consider other technical indicators and price action to confirm the trend’s strength and potential entry and exit points.
It is also important to note that no technical analysis tool or pattern is 100% accurate. The market can be unpredictable and subject to sudden changes in direction or unexpected news events. Traders should always use risk management strategies to minimize potential losses, such as stop-loss order and position sizing.
When is the best time to Trade using Three white soldiers Candlestick?
The pattern is generally used as a bullish reversal signal and is most effective when it appears at the end of a downtrend or a period of consolidation.
Traders should look for the pattern to occur on a longer time frame chart, such as a daily or weekly chart, to confirm the strength of the bullish trend. The pattern is typically more reliable after a significant price decline, indicating that the bears are losing control and the bulls are taking over.
How to Trade with Three white soldiers Candlestick in Stock Market?
Traders can trade through the Three White Soldiers candlestick pattern in the stock market by following these 5 general steps.

- Identify the pattern: Look for the Three White Soldiers pattern during a downtrend on a longer time frame chart, such as a daily or weekly chart. The pattern should consist of three consecutive long bullish candles with higher closes and small or no upper wicks.
- Confirm the pattern: Use other technical analysis tools, such as support and resistance levels, trend lines, and volume indicators, to confirm the strength of the bullish trend and potential entry and exit points.
- Enter the trade: Traders can enter a long position at the current market price or wait for a pullback to a key support level or a moving average.
- Set stop-loss and take-profit orders: Use risk management strategies, such as stop-loss orders and position sizing, to manage potential losses and maximize potential profits. Set a stop-loss order below the recent swing low or a key support level and a take-profit order at a resistance or target profit level.
- Monitor the trade: Monitor the trade and adjust the stop-loss and take-profit orders as the price moves in the desired direction.
Where are the Three white soldiers commonly used?
The Three White Soldiers candlestick pattern is commonly used in technical analysis by traders and analysts in the stock market, forex market, and other financial markets.
The pattern identifies potential bullish reversals in a downtrend or a period of consolidation. Traders often use the pattern and other technical analysis tools, such as support and resistance levels, trend lines, and volume indicators, to confirm the trend’s strength and potential entry and exit points.
The Three White Soldiers pattern can be used on various time frames, from short-term intraday charts to longer-term weekly or monthly charts, depending on the trading strategy and goals of the trader.
Is the Three white soldiers in an Uptrend a Sell Signal?
No, the Three White Soldiers pattern is generally considered a bullish reversal signal and a buy signal. The pattern consists of three consecutive long bullish candles with higher closes and small or no upper wicks, indicating that the bulls are taking control and pushing prices higher.
It can signify continued strength and a potential opportunity to add to or hold on to an existing long position when the pattern appears in an uptrend.
What are the advantages of the Three white soldiers Candlestick Pattern?
The three white soldiers pattern is a widely recognized bullish reversal pattern that can give traders five main advantages in their trading strategies. These are 5 advantages of three white soldiers.
- Strong Upward Trend Signal: The pattern is a strong bullish signal, indicating a reversal of the downtrend and a potential upward move in the market.
- High Probability: The pattern has a high probability of success when it occurs at the end of a downtrend. Traders can use this pattern as a buy signal to enter the market at a favorable price.
- Easy to Analyze: The pattern is easy to understand and analyze as it consists of three consecutive long-bodied candles that open within the previous candle’s real body and close near the day’s high. This makes it easy for traders to identify the pattern and trade accordingly.
- Risk Management: The pattern provides traders with a precise stop-loss level. The bullish trend may not continue, and traders can exit their position with minimal losses if the price falls below the low of the third candle in the pattern.
- Confirmation: Other technical indicators such as moving averages, trendlines, or momentum indicators often confirm the accuracy of the pattern. This provides additional assurance for traders and increases the probability of success.
It is important to note that no trading strategy is foolproof. The Three White Soldiers pattern should be used with other technical indicators and analysis to make informed trading decisions.
What are the disadvantages of Three white soldiers Candlestick?
This pattern is generally considered a positive sign for traders but has some potential disadvantages. Here are 5 possible disadvantages of the three white soldiers pattern.
- Inaccurate results: The three white soldiers pattern is sometimes inaccurate. The price may appear to be reversing, but then the trend continues downward, leaving traders who entered positions based on the pattern in a losing position.
- Limited use: The three white soldiers pattern may not be helpful in all market conditions.
- Risk of overtrading: Traders who rely too heavily on the three white soldiers pattern may be at risk of overtrading, which can lead to losses. It’s essential to use this pattern with other analysis forms and not rely solely on it to make trading decisions.
- Lack of confirmation: There may be a delay in confirmation of a trend reversal because the three white soldiers pattern requires three consecutive bullish candles . This lag can make it challenging to enter a position at an optimal time and result in missed opportunities.
- Subjectivity: The interpretation of the three white soldiers pattern are somewhat subjective. Some traders may see the pattern more easily or place more weight on it than others, leading to different trading decisions and outcomes.
The three white soldiers pattern can be a valuable tool in a trader’s toolkit, but it’s essential to be aware of its limitations and potential drawbacks.
What is the Opposite of Three white soldiers Candlestick?
The opposite of the three white soldiers pattern is the “three black crows” pattern. This bearish reversal pattern is formed when three consecutive long bearish candles appear on a chart. The three black crows pattern indicates a shift in market sentiment, but in the opposite direction.

The three black crows pattern forms after an uptrend, signaling a potential reversal in market sentiment from bullish to bearish. The pattern is considered a strong bearish signal, and the traders use it to identify potential selling opportunities.
What are other types of Doji Candlestick Patterns besides Three white soldiers?
Doji candlestick patterns are formed when a stock’s opening and closing prices are nearly the same, resulting in a small or nonexistent real body. Here are 3 of the common types of Doji candlestick patterns besides three white soldiers:
- Gravestone Doji: This pattern is formed when the open, low, and close prices are all the same, and the high price is significantly higher. It can indicate a potential bearish reversal.
- Dragonfly Doji: The dragonfly doji has a long lower shadow, a small or nonexistent real body, and no upper shadow. This pattern can indicate a potential bullish reversal.
- Long-legged Doji: This pattern has long upper and lower shadows and a small or nonexistent real body. It can indicate indecision in the market and a potential reversal.
Doji candlestick patterns are used with other technical indicators to identify potential trend reversals or continuation.
What Candlestick Pattern is Similar to Three white soldiers Candlestick?
The “three black crows” candlestick pattern is the bearish equivalent of the “three white soldiers” pattern. It consists of three consecutive long bearish candles with small or no wicks, each closing lower than the previous candle. The three black crows pattern signals a strong shift in market sentiment from bullish to bearish. Traders can use this pattern to identify potential selling opportunities or add to existing short positions. The pattern is considered reliable, especially when confirmed by other technical indicators such as support and resistance levels, trend lines, and volume.
Is the pattern of the Three White Soldiers a bullish reversal?
Yes, the Three White Soldiers pattern is a bullish reversal pattern in technical analysis. This pattern appears after a downtrend, consisting of three consecutive long bullish candles with small or no wicks, each closing higher than the previous candle. The appearance of this pattern signals a strong shift in market sentiment from bearish to bullish, and it suggests that buyers have gained control of the market. Traders often interpret the Three White Soldiers pattern as a signal to enter long positions or add to existing ones, as it suggests that the price continues to rise.
What is the difference between Three white soldiers and Three Black Crows?
The table here summarizes the main differences between the Three White Soldiers and Three Black Crows patterns.
| The Three White Soldiers | The Three Black Crows |
| Bullish reversal | 1. Bearish reversal |
| Occurs after a downtrend | 2. Occurs after an upward trend |
| Three consecutive long bullish candles with small or no wicks, each closing higher than the previous candle. | 3. Three consecutive long bearish candles with small or no wicks, each closing lower than the previous candle. |
| It shows that buyers have gained control of the market. | 4. It shows that sellers have gained control of the market. |
| Traders may enter long positions or add to existing long positions. | 5. Traders may enter short positions or add to existing short positions. |
The Three White Soldiers and Three Black Crows patterns are similar in their appearance, with three consecutive candles and little to no wicks. The difference lies in their market sentiment, occurrence, and interpretation, which can lead to different trading strategies.


 Previous Article


![15 Investing.com Alternatives [Free+Paid] You Should Use in 2026](https://www.strike.money/wp-content/uploads/2026/04/Investing.com-Alternatives.jpg "15 Investing.com Alternatives [Free+Paid] You Should Use in 2026 34")
![15 TradeStation Alternatives [Free+Paid] You Should Use in 2026](https://www.strike.money/wp-content/uploads/2026/04/TradeStation-Alternatives.jpg "15 TradeStation Alternatives [Free+Paid] You Should Use in 2026 35")
![15 Chartink Alternatives [Free+Paid] You Should Use in 2026](https://www.strike.money/wp-content/uploads/2026/04/Chartlink-Alternatives.jpg "15 Chartink Alternatives [Free+Paid] You Should Use in 2026 36")
: Overview, 10 Types of Indicators, Settings for Different Markets 37")


 : Definition, Formula, calculation, Uses, Advantages Vs limitations 40")


No Comments Yet.