The bearish Kicker Pattern is a two-bar candlestick pattern that indicates a significant shift in the direction of an asset’s price trend, reflecting a group of market participants taking control. The bearish kicker is an arrangement in financial modeling that are recognised by a sharp decline in price over the course of its distinctive two-bar candlestick formation. Traders use it to ascertain which market segment is in charge of the direction.
The bearish kicker pattern has been around since the early days of Japanese candlestick charting, which was first brought to the Western world in the 1990s. The pattern was dubbed the “abandoned baby” pattern when it was first released, but it was rebranded as the “bearish kicker” pattern in later releases.
The primary benefit of the bearish kicker is that it offers a clear indication of a change in the direction in which the price trend is moving in. Traders who are interested in shorting the market or getting out of long positions before the price drops even further find this information helpful.
What is a Bearish Kicker Pattern?
A bearish kicker is a candlestick pattern that consists of two candles that occur during a price uptrend. A bearish kicker pattern is recognised by the sudden and dramatic reversal in price that occurs during the distinct two-bar candlestick formation that it possesses. Traders frequently rely on the bearish kicker pattern as an indicator of a bearish trend, which enables them to make educated decisions regarding the purchase or sale of assets.
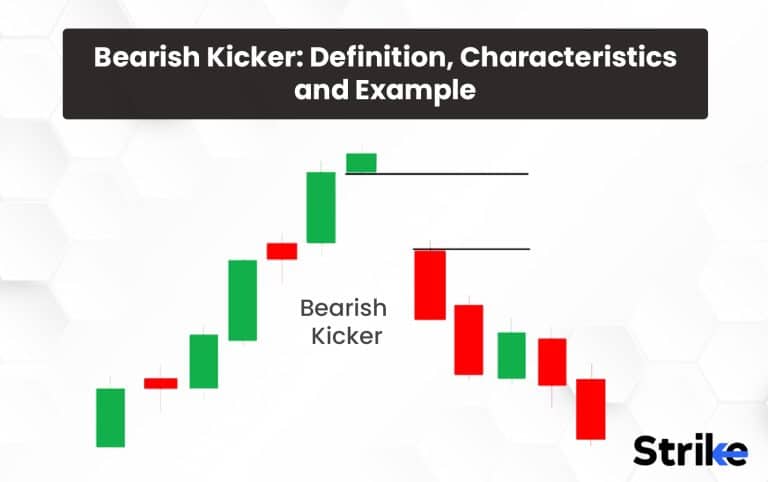
The pattern occurs when a long white or green candlestick is followed by a gap up and a second black or red candlestick that opens above the previous day’s high but then closes below the previous day’s low. The second candlestick completely engulfs the first one, forming a bearish engulfing pattern. See the image below.

The bearish kicker pattern’s significance is magnified when it occurs in overbought or oversold areas. It indicates that the market has reached an extreme and a reversal may be imminent. It suggests that the market participants have taken control, and a strong upward move is likely to follow when a bullish kicker pattern appears in such market conditions, Traders often use this pattern as a confirmation signal to enter long positions, anticipating a further bullish move in the asset’s price.
The bearish kicker candlestick pattern creates a better risk-to-reward ratio than when it shows a reversal on a chart near high prices. This is because the bearish kicker candlestick pattern does not have to form after a large downtrend or uptrend in price. No matter whether the current chart is moving upwards, downwards, or sideways, the presence of this signal should be interpreted as bearish.
Let us look at an example. Suppose the stock price of Tata Motors has been moving sideways or even slightly upwards for some time. A sudden bearish kicker candlestick pattern could emerge, indicating that the bears have taken control of the market and a sharp downtrend may follow. This pattern’s appearance could provide traders with an opportunity to enter short positions and potentially profit from a downside move in the stock price.
What are the Characteristics of a Bearish Kicker Pattern?
The bearish kicker pattern is a candlestick pattern that indicates a sharp reversal in an uptrend. It consists of two candles, with the first being a long white or green candle, and the second being a long black or red candle that opens above the previous day’s high and closes below the previous day’s low.

This pattern typically occurs after a strong uptrend, and there is a gap between the first and second candle, indicating a sudden shift in market sentiment. Both candles in the pattern are long, indicating strong selling pressure, and the second candle closes below the previous day’s low, indicating that the bears have taken control of the market. Additionally, the pattern is usually accompanied by high trading volume, indicating strong participation from traders. While traders interpret the bearish kicker pattern as a strong signal to sell or go short on the asset, it is important to confirm the pattern with other technical indicators and analysis before making any trading decisions.
What is an Example of Bearish Kicker Pattern?
Let us look at an example of Hindalco Industries Ltd. to understand the bearish kicker pattern. The price of the stock had been climbing steadily for the previous few weeks, reaching a new all-time high of 459.85 on August 31, 2022. The stock began trading at a price of 458.00 on September 1, 2022, which was a significant decrease from where it had been the previous day.

The share price continued to decline throughout the trading day, ultimately reaching a closing price of 439.85, which was lower than the previous day’s low of 448.10 A bearish kicker pattern was formed as a result of this as a bearish candlestick completely engulfed the preceding bullish candlestick. This bearish kicker pattern indicated a potential reversal in the uptrend of Hindalco Industries Ltd stock, indicating that traders and investors were shifting from bullish to bearish sentiment. The pattern pointed to a potential reversal in the price direction of the stock. It offered a possible entry point for traders who wanted to short the stock or get out of long positions.
What Does Bearish Mean?
A “bearish” sentiment or trend in the stock market refers to a downward trend in the prices of stocks or other securities. Berish sentiment applies to both individual stocks and the overall market. It indicates that investors have a negative outlook on the market as a whole or on a specific stock and anticipate that prices will continue to decline. A bearish investor might liquidate their holdings in preparation for additional price drops, or they might take “short” positions in the market in order to profit from declining prices. Shorting is when an investor banks on the price of a stock to go down.
A bearish market is the result of a number of different factors, such as an economic downturn, an event with geopolitical repercussions, or changes in the conditions specific to an industry or company. A “bearish” market is the opposite of a “bullish” market, which is characterised by falling prices and pessimistic investor sentiment. In general, a bearish market is considered to be the opposite of a “bullish” market.
What is the History of the Bearish Term in Stocks?
The term “bear” was introduced to refer to the financial market in the early 1700s when it was used to describe stock jobbers who sold shares they did not own in the hope of buying them back at a lower price.
One of the earliest mentions of the bear are found in a publication titled The Tatler from the date of April 26, 1709. The publication says the below.
“Forasmuch as it is very hard to keep land in repair without ready cash, I do, out of my personal estate, bestow the bear-skin, which I have frequently lent to several societies about this town, to supply their necessities; I say, I give also the said bear-skin as an immediate fund to the said citizens forever…”
These early stock traders were famous for their rough and aggressive trading strategies, which were compared to the manner in which a bear would attack its prey. The “bear” became a metaphor for a falling market over time because of the animal’s habit of dragging its hind legs along the ground when it walks, which led to the term “bear” becoming synonymous with falling prices. The terms “bearish” and “bullish” are frequently used in the business of finance to describe the state of the market and the sentiment of investors today. An investor who has a pessimistic outlook and anticipates falling prices is said to have a bearish outlook, while an investor who has a positive outlook and anticipates rising prices are said to have a bullish outlook.
What are Other Types of Bearish Patterns?
Bearish kick is just one of the bearish patterns. Below listed is information about five main bearish patterns other than bearish kicker.
- Hanging man: The hanging man pattern is a bearish candlestick pattern that appears at the top of an uptrend. The hanging man usually signals an impending reversal of the trend. The hanging man candlestick has a small real body at the top of the candle, with a long lower shadow and little to no upper shadow. It looks like a small body hanging from a long thin line. The pattern indicates that buyers were initially in control but then sellers took over, pushing the price down, and closing near or below the candle’s opening price. Traders use the hanging man pattern as a signal to sell or short sell, as it suggests a potential trend reversal.
- Dark Cloud Cover: The Dark Cloud Cover is a bearish reversal candlestick pattern that occurs at the end of an uptrend. Dark Cloud Cover is composed of two different candlesticks: the first is a long bullish candlestick, and the second is a long bearish candlestick that opens above the high of the first candlestick but closes below its midpoint. These two candlesticks form the pattern. The pattern says that the bullish momentum appears to have lost some of its strength, and the bears appear to be gaining control of the market. Traders can use the Dark Cloud Cover pattern in different ways depending on the manner in which they trade and the amount of risk they are willing to take. Some market participants may interpret it as a signal to sell any long positions they hold and open short positions instead. Some others may choose to wait for a confirmation before taking any position at all.
- Bearish Engulfing: The bearish engulfing pattern takes the form of a small bullish candlestick that is immediately followed by a much larger bearish candlestick that completely engulfs the earlier candlestick. The appearance of this pattern is taken as a reliable indication of a possible shift from a bullish to a bearish trend in the underlying market. A bearish engulfing pattern is formed when the market opens higher than the previous day’s close, but then experiences a significant sell-off during the day, pushing the price lower than the previous day’s low. It is formed when the bearish candlestick completely covers the preceding bullish candlestick in the chart. Traders and investors frequently make use of this pattern to locate possible opportunities for short selling, as it indicates that the trend is likely to change from bullish to bearish in the near future. Before making any decisions pertaining to trading,
- The Evening Star: The Evening Star pattern indicates that an uptrend has come to an end. The evening star is made up of three candlesticks, the first of which is a large bullish candlestick, the second of which is a small-bodied candlestick with a gap up, and the third of which is a large bearish candlestick with a gap down. The first candlestick in the pattern illustrates a significant amount of buying pressure, indicating that bulls are currently in control of the market. The second candlestick shows that the market is indecisive, with bulls and bears engaging in a tug-of-war with each other. The third candlestick provides conclusive evidence that the reversal has taken place, with bears successfully seizing control of the market and driving prices lower. Traders use this pattern to get out of long positions or even get into short positions. They use it to establish short positions.
- The Three Black Crows: The Three Black Crows is a bearish candlestick pattern that predicts the reversal of an uptrend. This pattern was named after the three black crows that appear in the pattern. It is made up of three consecutive black candles with a lengthy body, and each of these candles burns out close to the day’s lowest point. The pattern is formed when the opening price of each candle is higher than the closing price of the previous day, and when the closing price of the previous day is lower than the opening price of the previous day. The Three Black Crows pattern is a strong indication of a bearish reversal and should be treated as such. Traders frequently use the Three Black Crows pattern as a signal to sell or short a stock. This is because the pattern indicates that the stock is likely to continue moving downwards.
Traders use bearish patterns in combination with other technical analysis tools to make informed trading decisions. But is important to remember to always confirm the patterns with other indicators before making any trading decisions.
What Does Bearish Kicker Pattern Indicate?
Bearish kicker patterns indicate indicates a sudden shift in market sentiment, with the bears taking control and pushing the price down. The pattern occurs when a long bullish candle is followed by a long bearish candle that opens higher than the previous day’s high and closes lower than the previous day’s low. Traders often interpret this pattern as a strong bearish signal and may use it as a sell signal to exit long positions or enter short positions.
How Does the Bearish Kicker Pattern Work?
The bearish kicker pattern is a two-candlestick pattern that signals a bearish reversal in the market. The pattern consists of a long white candlestick chart pattern followed by a long black candlestick that opens higher than the previous day’s closing price. The black candlestick then continues to move lower, creating a gap between the two candlesticks. This gap represents a sudden shift in market sentiment, with bears taking control of the market.
How to Identify a Bearish Kicker Pattern?
Look for a two-candlestick pattern on a price chart to identify a bearish kicker pattern. The first candlestick should be a white (bullish) candlestick, indicating a strong buying momentum. The second candlestick should be a black (bearish) candlestick that opens below the previous day’s white candlestick, creating a large downward gap on the chart. See the picture below for an illustration.

The opening price of the black candlestick should be lower than the closing price of the previous day’s white candlestick. This indicates a strong selling pressure that overwhelms the buying momentum of the previous day, leading to a bearish reversal.
How to Use Bearish Kicker Pattern for Trading?
A bearish kicker pattern shows bearish sentiment in the market. There are two main strategies that help investors make smart decisions and increase their chances of success.
Short selling: Short selling is where investors sell borrowed shares in the hopes of buying them back at a lower price. The investor then waits for the stock to decrease in price before buying back the shares at a lower price and returning them to the broker. The difference between the price at which the stock was sold and the price at which it was bought back is the profit for the investor, minus any borrowing fees or interest charges.
Diversification: Diversification is also an effective way to minimize risk when trading in a bear market. Investors reduce their exposure to any one particular company or market By spreading investments across different asset classes and sectors.
Stop-loss: Setting stop-loss orders is done to limit losses. Investors protect themselves against unexpected drops in value by setting a predetermined price at which to sell a stock.
Experienced investors may find that trading in a bear market is challenging but ultimately profitable when these trading strategies are kept in mind.
How is Bearish Engulfing Accurate?
A bearish engulfing pattern is profitable if used in the right context and with proper risk management. It’s a candlestick pattern that indicates a potential trend reversal from bullish to bearish. Traders use bearish engulfing pattern along with other technical analysis tools to confirm their trading decisions.
Is Bearish Kicker Only for Candlestick Chart?
Yes, the bearish kicker pattern is a type of candlestick pattern that occurs in a price chart.
Can I Use the Term Bearish for Line Chart?
No, bearish kicker is a candlestick pattern.
Is Bearish Kicker Better than Bullish Kicker?
No, bearish kicker and bullish kicker are not comparable since they are used in different market situations. A bearish kicker indicates a bearish market and bullish kicker indicates bullish markets.


 Previous Article


![15 Investing.com Alternatives [Free+Paid] You Should Use in 2026](https://www.strike.money/wp-content/uploads/2026/04/Investing.com-Alternatives.jpg "15 Investing.com Alternatives [Free+Paid] You Should Use in 2026 40")
![15 TradeStation Alternatives [Free+Paid] You Should Use in 2026](https://www.strike.money/wp-content/uploads/2026/04/TradeStation-Alternatives.jpg "15 TradeStation Alternatives [Free+Paid] You Should Use in 2026 41")
![15 Chartink Alternatives [Free+Paid] You Should Use in 2026](https://www.strike.money/wp-content/uploads/2026/04/Chartlink-Alternatives.jpg "15 Chartink Alternatives [Free+Paid] You Should Use in 2026 42")
: Overview, 10 Types of Indicators, Settings for Different Markets 43")


 : Definition, Formula, calculation, Uses, Advantages Vs limitations 46")


No Comments Yet.