The three inside up candlestick pattern is an indication of trend reversal in the market. The three inside up patterns consist of three candlesticks that are formed in a specific way. The first candlestick will be a bearish candlestick that shows the prices have been dragged down. The two candlesticks that follow this bearish candlestick are bullish candlesticks that complete the formation of the three inside up candlestick pattern.
The three inside up candlestick pattern starts to form at the end of a downtrend. The three inside up candlestick pattern requires the individual candlestick to form a particular type of sequence. The sequence is an indicator to show that the current trend is weakening and a trend reversal is upcoming. The three candlestick pattern as the name suggests is made up of three candlesticks, one bearish candlestick and two bullish candlesticks. The first bearish candlestick is one with a large body with upper and lower wicks. The second candlestick is a bullish candlestick which is engulfed by the first bearish candlestick. The second candlestick denotes the change of the market movement from bearish to bullish. The third candlestick is a bullish candlestick that starts from or above the closing price of the second candlestick and moves upward. The third candlestick closes above the second and the first candlestick and indicates the completion of the trend reversal in the market from bearish to bullish. The pattern is considered as the three inside up only when the third candlestick opens halfway above the first bearish candlestick.
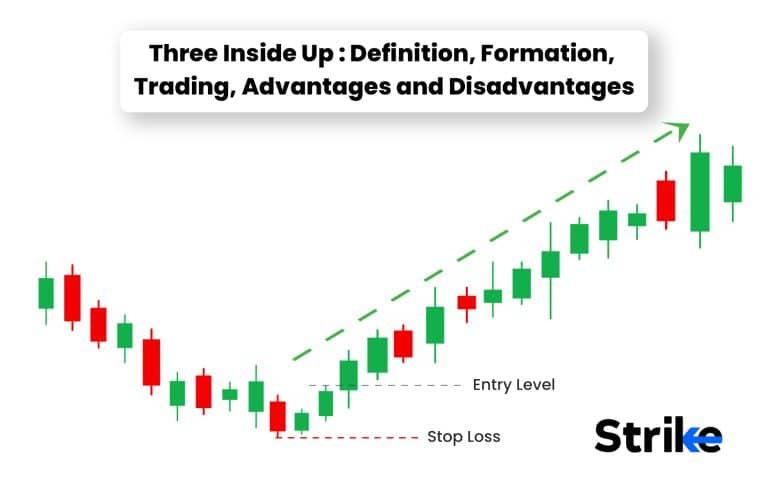
The trading strategy involved in the three inside up candlestick pattern is mainly based on right entry and exit in the market prices. The first step that should be taken by the traders is to wait and ensure that the pattern is completely formed and follows the trend reversal pattern. Once the three inside up pattern is formed the trader can buy security in a bulk and can sell them once it reaches new highs. The formation of the third candlestick in the three inside up pattern denies the exit of short sellers and allows new traders who wish to enter a long position to buy the security.
What is three inside up candlestick pattern ?
The three inside up pattern candlestick pattern is an indicator pattern. The formation of the three inside up pattern denotes a trend reversal in the market. The three inside up denotes a bearish to bullish trend that will happen in the market. The three inside up pattern signifies the downtrend in the market has lost its momentum and the bulls will soon take dominance in the market. The three inside up pattern consist of three candlesticks and only when the candlestick appear in a specific pattern the three inside up is considered to be completed.

The three inside up pattern is formed when the sellers have started exhausting their selling power giving the rein back to the bulls. The three inside up pattern is a triple candlestick pattern and appears at the end of a downtrend and the pattern starts with a bearish candlestick with a large body. This candlestick denotes that the downtrend is still on going with the bears in control followed by two bullish candlesticks that have a closing price one above the other. The higher highs and the higher lows that follow the bearish candlestick indicates the sellers have booked their profit and got out while the buyers have started to place a long position in the market.
How is three inside up candlestick formed ?
The initial bearish candlestick in the three inside up pattern denotes the sellers making an exit point in the security. The sellers have started losing dominance and the buyers will take control.

The second candlestick of the pattern indicates the slow emergence of the bulls. The second candlestick is a bullish candlestick. The candlestick is still engulfed by the initial candlestick and its high and low is engulfed by the bearish candlestick. The second candlestick denotes that the buyers have taken up a resistance against the weak selling of the bears and started to gain control over the market. It is to note that the second candlestick only denotes the bulls have started the resistance and have not taken over the bears completely.
The third candlestick form is a bullish candlestick in the three inside up pattern. It is to note that the third candlestick must have its opening halfway above the body of the first bearish candlestick and the third candlestick must close above the upper wick of the initial bearish candlestick. When the third bullish candlestick satisfies this condition the pattern is considered as the three inside up pattern.
With the beginning of the third candlestick the bulls completely take over the market. With the end of the second candlestick the sellers have exited their short positions allowing the bulls to get long positions in the market . When the bulls sense that most of the sellers have exited the market more bulls gain confidence and start pushing the price up. The increased number of bulls makes the third candlestick open with a huge gap up. This is how the three inside up pattern emerges in the market.
How important is the color of the three inside up candlestick ?
The color of the three inside up candlestick is used to measure the magnitude of the trend reversal. The three inside up pattern consist of three candlesticks and one of the candlestick is red while the other two are green. The red coloured candlestick provides an idea on the strength of the downtrend. The two green coloured candlestick that is formed later on indicates the strength of uptrend that is upcoming. The colors that follow the initial candlestick indicate the trend, and the body of the candlestick gives the traders how strongly the trend reversal will take place.
The color of the three inside up pattern thus provides a minor indication of the trend’s strength. The pattern itself is of greater importance than the colors of the pattern but helps to increase the accuracy of the trader’s prediction. The colors along with other technical tools will help chart out price movement more effectively.
When does three inside up candlestick happen ?
The three inside up candlestick pattern appears at the end of a downtrend. The three inside up candlestick pattern is an indicator of a trend reversal from bearish to bullish. The pattern starts with a bearish candlestick with a long body that marks the end of the heavy downtrend that was taking place till then. The pattern is complete only when two bullish candlesticks emerge after the initial bearish candlestick. The first bullish candlestick has a short body indicating the effects of the downtrend have not been completely changed. The formation of the second bullish candlestick who’s opening is above the half of the bearish candlestick marks the formation of the pattern and indicates the beginning of the uptrend.
The three inside up candlestick is, therefore, a signal for the sellers to exit the market as they are losing dominance, this inturn is taken by the buyers as a sign to enter the market for long positions.
How often does three inside up candlestick occur ?
The three inside up candlestick pattern occurs very frequently in the stock market. The three inside up frequent occurrence is one of its disadvantages as well. The three inside up pattern occurs 60 percent of the time during day trade and traders are often confused about it. The three inside up pattern usually occurs at the end of downtrends, but oftentimes, the pattern forms without showing much strength in the trend reversal. The weak downtrend that can be seen in the market ends with the three inside up candlestick pattern but does not always result in a strong trend reversal.
The frequent formation of the three inside up candlesticks makes it difficult for traders to decide which candlestick to act upon and which one to wait out. The market always keeps moving from bearish to bullish and vice versa. Both these trend reversals are signaled by the three inside up pattern and the three inside down pattern respectively thus the occurrence of the three inside up candlestick pattern is prevalent. It is the strength of the trend reversal that the trader should be more concerned about.
How to read three inside up candlestick in technical analysis ?
The three inside up candlestick pattern is the basic pattern that signals for trend reversal in the market. The three inside up candlestick pattern is used in technical analysis to confirm an end to the bearish downtrend and to signal an upcoming bullish uptrend.

The two major ways in which the three inside up candlestick pattern is read in technical analysis are below.
- Magnitude of reversal: The three inside up candlestick pattern is regarded as a sign of trend reversal from bearish to bullish. The three inside up pattern can also help provide the magnitude of the trend reversal in the market. The three inside up pattern consist of three candlesticks; the first candlestick is a bearish candlestick which indicates the market coming to the end of the downtrend followed by the two bullish candlesticks. The first bullish candlestick is engulfed by the bearish candlestick pattern and the second bullish candlestick lays halfway above the initial bearish candlestick pattern. The gap up opening of the third bullish candlestick compared to the other bullish candlestick gives the trader an idea on the magnitude of the trend reversal. The greater the gap up between the closing of the second candlestick and the opening of the first candlestick the greater will be the trend reversal. The trend reversals strength can also be gauged by the length of the body of the third candlestick. A large bullish body shows a greater buy in the market. This will lead to greater bullish movements.
- Signal for sellers exit and buyers entry: The second major way in which the three inside up candlestick pattern is read in technical analysis is to consider it as an exit point for sellers and an entry point for buyers. The starting of the three inside up pattern begins with a bearish candlestick indicating the end of the downtrend run. The end of the bearish candlestick are taken as a signal by the sellers who short their position to make an exit in the market. Most traders can recognize the beginning of the three inside up by observing the body of the bearish candlestick. The long bearish candlestick body indicates that the sellers have lost confidence, are booking profits and making an exit from the market. The formation of the second candlestick in the three inside up candlestick pattern indicates the bulls are slowly overpowering the bears in the market. The overpowering of the bears is confirmed by the formation of the third candlestick which is bullish. The traders can read this situation as the buyers taking an entry into the market and holding a long position in the market.
While doing technical analysis, by observing the strength of the trend reversal and by indulging more technical indicators, the traders can predict how far along the price movement will be and use the pattern accordingly.
How accurate are the three inside up candlestick in technical analysis ?
The three inside up candlestick pattern is a commonly appearing pattern in the market. The three inside up candlestick patterns have an average of 65 percent accuracy, but every pattern’s accuracy is varied. The accuracy of the three inside up candlestick patterns ( as well as every pattern) depends on different factors like time frame, market context and other technical factors as well. The three major factors that affect the accuracy of the three inside up candlestick pattern are:
- Duration of the trend: The duration of the trend in the stock market refers to the period for which a trend lasts and how long it can be utilized by the traders. The duration of the trend after the three inside up patterns can be measured by observing the strength of the trend. The trend’s strength is indicated by the gap up opening of the third candlestick in the three inside up candlestick pattern. The greater the time frame the more accurate the pattern will be.
- Time frame of candlestick: The time frame of the candlestick refers to how each candle represents the price movement of the security throughout a particular period. For patterns like the three inside up candlestick the time frame of the candlestick is usually set to 5 minutes, i.e, the candles represent the movement of the price of the security every 5 minutes. The time frame of the candlestick selected also plays an important role in determining the accuracy of the pattern. The three inside up candlestick pattern is a frequently recurring pattern and must be observed with little intervals in order to spot the trend reversal. The three inside up pattern also has the tendency to break its formation mid way thus the time frame of the candlestick must be carefully selected to increase its accuracy.
- Market context: The market context refers to the overall market conditions and the traders sentiment towards the security. The market context depends on factors like the economic state of the country, the exchange rates, even social and political factors. The pattern will not be of use if the market context is anomalous.
The accuracy of any stock market pattern cannot be determined by the pattern alone. The market consists of a wide variety of variable factors that creates deviation from the normal pattern. The best strategy to adopt is to incorporate more technical tools into the analysis to make the pattern as accurate as possible and have a stop loss ready to bear minimum losses that occurs in the process.
When is the best time to trade using three inside up candlestick ?
The three inside up candlestick pattern is a signal for trend reversal from bearish to bullish.The best time to trade or use the three inside up candlestick pattern also depends on if the trader using it is a buyer or seller. Before getting to that there is a general rule of thumb for every pattern. The first thing a trader should ensure before using the three insides (or any pattern ) is to make sure that the pattern is completely formed. The three inside up patterns tends to break their formation mid-way, and the bulls do not take over.
The completion of the pattern, along with the strength of the bullish movement, must be kept track of before the trader makes a move.
When it comes to the three inside up pattern there will be both buyers and sellers involved and both have a different time to use the three inside up candlestick. In the case of buyers the best time to use the three insides comes after the formation of the third candle ( the bullish candle) . The buyers can take a long position by observing the candlestick’s body. The buyers can opt to wait out the trend reversal if the third candlestick in the pattern is not long enough. The buyer can judge how long the trend will last approximately by the gap up that takes place between the opening of the third candlestick and the closing of the second candlestick.
The sellers, on the other hand, can use the formation of the three inside up patterns as a sign of exit from the market. The sellers who have been holding short positions can take the formation of the bearish candlestick with a long body as a sign of sellers losing control and booking profits. The sellers can book their profit and exit the position. In case the sellers are not able to exit the position the sellers can wait out the situation after the formation of the third candlestick the three inside up candlestick pattern will be completed and will mark the beginning of an uptrend. The sellers can wait for the buyers to exhaust their dominance and the prices to go down.
How to trade with three inside up candlestick in the stock market ?
The three inside up candlestick pattern is an indication of the sellers exiting the market and the buyers asserting their dominance. The appearance of the three inside up pattern is an indication of a trend reversal from bearish to bullish in the market. The traders can follow a 5 step process to trade using the three inside up candlestick patterns in the market. The five steps are :
- Identification: The first step involved in using the three inside up pattern ( or any pattern) is properly identifying the pattern. The patterns in the stock market have the tendency to break their formation mid-way. The traders must be weary of this and should act accordingly. If the pattern seems to go off course, the trader should wait till the market forms a recognizable pattern. In the case of the three inside up candlestick patterns the trader should expect the pattern at the end of a downtrend. The pattern starts with a long bearish candlestick. The trader can watch for the long bearish candlestick at the end of a downtrend. It is to note that all bearish candlesticks at the end of a downtrend do not indicate the beginning of the three inside up pattern. In order to make the identification easier, the traders can look out for the second candlestick ( which is bullish) that is engulfed by the first bearish candlestick. The pattern is confirmed by the traders when the third candlestick, which is also bullish , opens halfway above the body of the beamish candlestick and closes above the high of the second candlestick.
- Confirmation: After the three inside up candlestick pattern has been formed the traders must confirm its strength and make sure that the market sentiments are as per the pattern. There are certain conditions where even though the pattern is formed the market does not undergo the trend reversal. The traders must confirm the pattern is formed and the trend reversal is taking place as per the pattern.
- Set a stop loss: The third step involved in using the three inside up pattern is setting up the stop loss. The setting of the stop loss is critical for any trader and depends on the risk that the trader is willing to take for more rewards. The stop loss is set after the buyers enter into a long position in the trade. For example : if the three inside up pattern is completed when the security price is RS 20 by gauging the last bullish candlestick the trader can predict a movement and can set stop loss near Rs 20 so the trader can break even if the prices do not move up as per the traders plan. A trailing stop loss is also an option that the trader can consider if he wants to take more risk.
- Profit booking: The fourth step in using the three inside up candlestick is to book profits. The major lesson traders should learn while trading is not to get greedy. The three inside up pattern predicts an uptrend and the traders will place a long position but when the price level reaches the profit level the buyer must exit the market even if the prices continue to rise. The best way to ensure proper exit in the market is to place an automated selling once the appropriate price reaches. In case a situation arises where the prices keep rising after the trader exited the long position, he/she can wait for till another pattern is formed.
- Monitoring: The monitoring of the market after the formation of the three inside up patterns following the uptrend is the fifth and final step in using the pattern. The traders must keep an eye out for how the market behaves after the pattern formation and if the trader has a greater risk appetite, he/she can enter into a new long position (only after exiting from the previous position and booking its profit).
The 5 step action for using the three inside up patterns in the stock market is made more efficient if more variables are brought into consideration by using different technical tools. The above mentioned 5 step process is not always fool proof and the trader should be flexible with their trading strategy.
Where is the Three Inside Up commonly used ?
The three inside up pattern is a candlestick pattern used widely in the stock market. The three inside up is commonly used at the end of downtrends. The three inside up pattern starts to form as the sellers start to exit from the market after they have finished booking their profits. The exit of the sellers marks the beginning of the uptrend in the market. The three inside up candlestick is formed as an indicator of trend reversal from this bearish phase to the bullish phase.
The three inside up pattern holds significance in foreign exchanges markets and commodities markets also. The Three Inside Up follows the same pattern in every market and can be easily identified by its three candlestick pattern. The three inside up pattern is thus a significant technical analysis tool that is used to predict trend reversal in different markets.
Is the three inside up in an uptrend a signal to sell ?
No. The three inside up candlestick pattern is taken as a sign to wait. The three inside up candlestick pattern only appears during the end of a down trend. The three inside up is considered as a sign of trend reversal and the traders can act upon the pattern only when its completed. The most common strategy undertaken by the traders is to take a long position in the market after the pattern has been formed. The pattern does not signal to sell, if the pattern is already formed it means the sellers have exited the market and if there are any existing traders who have shorted the position they can wait for the next downtrend.
What are the advantages of three inside up candlestick pattern ?
The three inside up candlestick pattern appears commonly in different types of market and is used by both novice and experienced traders alike. The three inside up pattern has two major advantages that makes it famous in other types of market as well. The two major advantages of the three inside up candlestick pattern are :
● Frequency: The three inside up pattern appears frequently in the stock market. The traders who are familiar with the candlestick pattern can easily identify and take advantage of the three inside up patterns. The frequency of the pattern allows traders to form different strategies and take long positions in the market.
● Measure the strength of trend reversal: The three inside up patterns are included in the harami patterns. A harami pattern usually consists of two candlesticks and predicts the magnitude of the trend reversal. The three inside up patterns can be used to predict the strength of the trend reversal. The formation of the third candlestick in the three inside up pattern denotes the strength. The bullish trend is considered more if the third candlestick opens with a large gap up as compared to the closing of the previous bullish candlestick.
The three inside up candlestick pattern is widely popular among the traders for the two advantages mentioned above. The traders with the use of proper technical tools can make more accurate predictions and book profits in the market.
What are the disadvantages of three inside up candlestick ?
The three inside up candlestick pattern is not a hundred percent accurate pattern ( like every other pattern in the market) and has its disadvantages as well. The major two disadvantages of the three inside up candlestick lies close to its advantages. The three major two disadvantages are below.
- Incomplete formation: The three inside up candlestick is a pattern that signals trend reversal from bearish to bullish. The pattern has a tendency to break its formation mid-way. This breaking of pattern causes uncertain situations to form. The traders often overlook the pattern breaking and fail to act on it accordingly. The breaking of the pattern can cause the trend reversal not to form thus making the trader’s strategy inefficient.
- Difficult to spot: The three inside up candlestick pattern is one of the most commonly formed patterns at the same time it’s difficult to spot. The three inside up pattern occurs during the end of down trends but traders cannot easily spot the pattern till its too late. The traders often become late to act upon the pattern and miss the opportunity to form a strategy.
The three inside up pattern has its advantages and disadvantages very close to each other. Only through experience can the traders overcome the disadvantages posed by the three inside up patterns. The technical tools available also allow the traders to curb the disadvantage to an extent.
What is the opposite of three inside up candlestick ?
The three inside down is the opposite of the three inside up candlestick pattern. The three inside down has all the properties of three inside up but is opposite in nature. The three inside down pattern appears at the end of uptrends and indicates a trend reversal from bullish to bearish. The three inside down candlestick patterns consist of three candlesticks. The first candlestick is a bullish candle with a large body. The large bullish candlestick is formed as a part of the uptrend, the bullish candle marks the end of the uptrend in the market. The second candlestick formed is a bearish candlestick. The bearish candlestick will be engulfed by the first bullish candlestick. The formation of the second candlestick indicates that the bulls have started losing dominance and the bears are slowly taking over the market. The third candlestick formed will be a bearish candlestick. The third bearish candlestick will have its opening half way down the body of the first bullish candle and will have a lower close than the other two candlesticks. The formation of the third candlestick completes the formation of the three inside down candlestick pattern and marks the beginning of the downtrend.
The trading strategy of the three inside involves timing the exit in the market. The three inside down pattern is used mostly by the bears to short their position and earn a profit. The three inside down pattern marks the beginning of the downtrend. After the pattern has been formed the trader can gauge the magnitude of the downtrend by observing the gap down opening of the third bearish candlestick. After the trader gets an idea on how strong the downtrend is the trader can place short positions on the security and book profits.
What are other types of Doji candlestick patterns besides three inside up ?
The Doji candlestick pattern appears at times of uncertainty in the market. The Doji candlestick pattern is of Bullish or Bearish nature. The Doji candlestick is considered as a signal for traders to wait until the market follows a bullish or bearish trend. The appearance of a Doji pattern can indicate a chance of trend reversal in the market. Depending upon the dominance established by the buyer or the seller the Doji pattern is divided into 5 types .
- Doji star: A Doji Star can appear at the beginning of a bullish or bearish trend. A bullish Doji Star which resembles the addition sign (+) appears after downtrend.
- Long legged Doji: The long legged doji appears at both bullish and bearish trends. The long legged Doji is formed when the opening price and the closing price of a security are almost the same.
- Gravestone Doji: The gravestone doji pattern is considered as a bearish candlestick pattern that indicates a trend reversal in the market. The gravestone doji is seen at the end of uptrends. The pattern is formed when the candlestick has a long upper wick and the opening and closing are close to each other.
- Dragonfly doji: The dragonfly doji is considered to be a signal for trend reversal in the market. The candlestick pattern is formed when three out of the four components of a candlestick are in the same place : the candlestick consists of the opening, closing and high close to each other or in the same place.
- Four Price Doji: Four Price Doji as the name suggests has four components of a candlestick in the same point or near to each other; the opening price closing price the high and the low all lie in the same point.
These are major types of Doji candlestick patterns similar to the three inside up candlestick patterns. The Doji candlestick mainly predicts unambiguity in the market while the three inside up predicts a trend reversal.
What candlestick pattern is similar to three inside up candlestick ?
The morning star candlestick pattern is similar to the three inside up candlestick pattern. The morning star candlestick pattern is a three candlestick pattern that appears at the end of a downtrend. The formation of a morning star pattern is considered as a trend reversal signal from bearish to bullish. The morning star just like the three inside up candlestick pattern appears after a large bearish candlestick which marks the end of the downtrend. The second candlestick that follows the bearish candlestick is a small bearish candlestick that is engulfed by the initial bearish candlestick. The second candlestick indicates a trend reversal that is coming up. The second bearish candlestick has large upper and lower wicks and a small body. The pattern is completed by the third candlestick. The third candlestick is a bullish candlestick that marks the beginning of the uptrend. The candlestick formed will have a gap up opening and will have higher highs and higher lows than the previous two candlesticks.The morning star and the three inside up candlestick patterns are thus similar in terms of number of candlesticks involved in the pattern and in predicting the uptrend.
Is the pattern of three inside up a bullish reversal ?
Yes, the pattern of three inside up is a bullish reversal. The three inside up pattern begins at the end of a downtrend and the complete formation of the pattern predicts an uptrend. The bullish reversal begins after the three inside up pattern is completely formed. The trader can get an idea of the strength of the bullish reversal by observing the gap up opening of the third candlestick and its body.
What is the difference between three inside up and three inside down ?
The three inside up and the three inside down are both signals for trend reversals in the stock market. The patterns are both three candlestick patterns that appear at the end of trends to indicate the change in trend of the market. The signs are of the same characteristics but of opposite nature. The major difference between the three inside up and the three inside down are listed below.
| Three inside up | Three inside down |
| Appears at the end of downtrends | Appears at the end of uptrends |
| Begins with a long bearish candlestick | Begins with a long bullish candlestick |
| Pattern ends with a bullish candlestick | Pattern ends with a bearish candlestick |
| Pattern signals a bullish reversal | Pattern signals a bearish reversal |
| Pattern denotes buyers entry and sellers exit | Pattern denotes buyers exit and sellers entry |
| Buyers take long position to book profits | Buyers take short position to book profits |
The three inside up and three inside down patterns are similar in pattern and different in nature. Both patterns indicate trend reversal and are used by traders extensively. The adoption of more and more technical tools will make the use of the pattern more efficient.


 Previous Article


![15 Investing.com Alternatives [Free+Paid] You Should Use in 2026](https://www.strike.money/wp-content/uploads/2026/04/Investing.com-Alternatives.jpg "15 Investing.com Alternatives [Free+Paid] You Should Use in 2026 40")
![15 TradeStation Alternatives [Free+Paid] You Should Use in 2026](https://www.strike.money/wp-content/uploads/2026/04/TradeStation-Alternatives.jpg "15 TradeStation Alternatives [Free+Paid] You Should Use in 2026 41")
![15 Chartink Alternatives [Free+Paid] You Should Use in 2026](https://www.strike.money/wp-content/uploads/2026/04/Chartlink-Alternatives.jpg "15 Chartink Alternatives [Free+Paid] You Should Use in 2026 42")
: Overview, 10 Types of Indicators, Settings for Different Markets 43")


 : Definition, Formula, calculation, Uses, Advantages Vs limitations 46")


No Comments Yet.