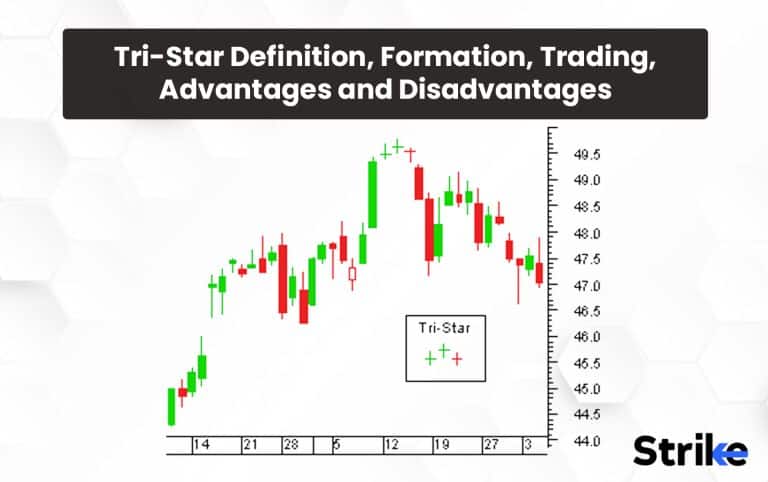
The tri-star doji pattern consists of three consecutive doji patterns and indicates either bullish or bearish trend reversal in the market. The market trend will be bullish or bearish before the tri-star doji is formed. The first doji indicates the slowing down of the previous trend in the market. The first doji signals that the market is indecisive. The second doji that is formed bridges the gap for the trend reversal. The second doji indicates that the previous trend has come to an end and shows possible chances of a trend reversal. The third doji candlestick indicates that the market trend has reversed. The larger the gap between the third candlestick and the candlestick following it, the larger the trend reversal.
The trading of the tri-star doji depends on the type of tri-star doji formed. The traders are able to formulate strategies to keep a long position in the market during these reversals. The trader is able to form a strategy to place short positions in the market.
The advantages of the tri-star doji include, being easily identifiable in the market as the pattern appears at the end of a trend, flexibility as previous tri-star patterns will be compared across different points of time, and traders entering into long or short positions depending upon the type of tri-star.
The major disadvantage of the tri-star doji pattern is that it is not considered a strong trend reversal pattern as compared to the other trend reversal patterns. The tri-star doji pattern also cannot be acted upon until the first candlestick after the pattern has been fully formed.
What is the Tri-Star Doji pattern ?
A tri-star doji pattern, as the name suggests, consists of three doji candlesticks. The doji candlesticks represent a symbol of uncertainty in the market. The tri-star doji thus holds significance as it indicates the market is undergoing indecisiveness. The three consecutively formed doji candlesticks are considered a pattern of a trend reversal, either bullish or bearish. The tri-star doji pattern forms at the end of a trend and has unique characters of its own.

The first doji candlestick represents the indecisiveness of the buyers and sellers in the market. The second doji candlestick represents the gap between the trend that was continuing and the trend reversal that is going to take place. The third doji indicates a change in market sentiments.The middle doji candlestick will appear above the first and the third doji candlestick if the tri-star pattern formed is bearish and the middle doji candlestick will appear below the first and the third doji if the pattern formed is bullish
The tri-star doji pattern is considered a weak signal for trend reversal as compared to the other trend reversal signs. The three-star doji is still widely used by traders to enter and exit positions. The accuracy of the tri-star doji will be increased with more market signals and tools.
How is Tri-Star Doji Formed ?
The tri-star doji pattern is formed at the end of a trend. The formation of a tri-star doji pattern indicates that the current trend will be reversed. The tri-star doji consists of three doji candlesticks each having its own characteristics.

The first doji pattern formed indicates the buying and selling of the security cancelling out each other. It also indicates that the trend that was ongoing has stopped, and now the market is indecisive.
The second doji pattern formed indicates the market was trying to reverse the trend that was going on. The second doji in a bearish tri-star doji pattern appears above the other two dojis to indicate the slowdown in buying. The second doji pattern formed in a bullish tri-star doji pattern appears below the other two dojis to indicate the change in trend from bearish to bullish.
The third doji pattern confirms the trend reversal that takes place. It will be similar to the first doji, and the gap up or gap down between the third doji and the following candlestick pattern will help measure the magnitude of the trend reversal.
The tri-star doji thus indicates a step-by-step trend reversal signal that the traders will utilise more properly using other tools and observing the market conditions.
The tri-star doji is a candlestick pattern where three consecutive doji candlesticks appear in a row, with the middle doji being smaller in size than the other two each doji would have a small or non existing body which indicates a lack of significant price movement between the open and close prices.
What does Green Tri-Star Doji tell?
The tri-star doji are of two types: the bullish tri-star doji and the bearish tri-star doji. The bullish tri-star doji is also referred to as the green tri-star doji. The green tri-star doji appears at the end of a downtrend and indicates the trend reversal from bearish to bullish. The green tri-star doji is rare but easy to identify. It appears at the end of the downtrend. The middle doji star is below the other two doji star patterns.

The green doji star tells the traders to enter into a long position as the market sentiment is reversing. The magnitude at which the trend reverses will be measured by the gap up in the candlestick that forms after the third doji candlestick. The green doji candlestick pattern is not entirely accurate but it will be made more precise by using more technical tools and by studying market conditions thoroughly.The traders are advised to act on the pattern when the resistance that has been formed is broken.
How Important is the Colour of the Tri-Star Doji?
The colour of the tri-star doji depends on where the pattern has been formed. The tri-star doji are of two types: bearish or red tri-star doji and the bullish or green tri-star doji. The bearish/red tri-star doji appears at the end of an uptrend and indicates that the market sentiment for selling is greater.
The colour of the tri-star doji that appears will vary, but the third doji candlestick is bearish and is followed by a downtrend. The middle doji of the bearish candlestick pattern is also above the other two doji candlesticks. The bullish tri-star doji, also referred to as the green tri-star doji, appears at the end of a downtrend and indicates that market sentiment for buying is greater. The third doji star of the tri-star doji bullish pattern indicates the trend reversal from a downtrend to an uptrend. The middle doji of the bullish pattern is below the other two dojis.
The colours of the tri-star doji indicate the trend that will follow. The colours of the dojis formed in the pattern vary.
When Is Tri-star Doji Formed?
The tri-star doji is a pattern that signals trend reversal and is formed at the end of trends. The tri-star doji pattern is easily identifiable and occurs at the time when the market starts to become indecisive. The buyers and sellers will have equal dominance in the market at the time when the tri-star doji is formed. The trend that was ongoing will be reversed after the tri-star doji is completed. The tri-star doji is only completed when the three dojis with no bodies appear consecutively.
The tri-star doji is formed in almost any frame and in any type of market. The tri-star doji pattern requires particular market conditions in which there is almost the same amount of buying and selling, and a minimum amount of volatility is necessary.
How Often Does The Tri-star Doji Occur?
The tri-star doji pattern is an indicator of a trend reversal pattern and occurs in almost any market and in any time frame, but it forms rarely. The tri-star doji does not often appear on the market but it is easy to identify. The ending of market trends is usually indicated by a tri-star doji pattern where there is high volatility in the market. The tri-star doji does not always indicate a trend reversal. The pattern also appears in times of uncertain situations in the market. Other indicators and market conditions must be understood to decide whether the trends will be reversed.
Traders and analysts observe that the tri-star doji pattern appears less in the market when compared to other trend reversal indicators, and only when the market has experienced high volatility for a considerable amount of time and the prolonged market trend comes to an end.
How to read the Tri-star Doji in Technical Analysis?
The tri-star doji pattern is one of the candlestick patterns that indicates an upcoming trend reversal in the market. The pattern appears at the end of prolonged trends and will be used in technical analysis 3 ways.
Identify the pattern: The tri-star doji pattern consists of three doji candlesticks consecutively, with the middle doji being a star. The doji candlestick patterns are formed with little or no body, with their opening and closing prices lying very close to each other. The second doji that appears in the middle has a gap up or gap down (depending on the type of tri-star doji).
Recognise the market sentiments: The tri-star doji usually appears at times of high market volatility and when indecisiveness prevails in the market. The buyers nor the sellers could assert dominance in the market.
Confirmation: The tri-star doji emoji is a trend reversal indicator pattern. Traders need to confirm the completion of the pattern before taking any action based on it. The candlestick pattern has a tendency to break in between or show weak signs of a trend reversal. The traders rely on other factors like observing volume patterns, trendlines, support and resistance levels, or other technical indicators before acting on the pattern.
The tri-star doji candlestick pattern in technical analysis chart is like any other candlestick pattern, should be taken up with proper risk-reward management. Setting up stop losses, considering other factors for confirmation, using other analytical tools, etc. are some of the methods for managing risk while using the pattern.
How Accurate Is The Tri-star Doji In Technical Analysis ?
The tri-star doji pattern is an indicator of a possible trend reversal in the market. The accuracy of the tri-star doji, similar to any other pattern, depends on factors like overall market conditions, timeframe, and confirmation from other technical indicators or patterns that cannot be completely accurate.
The tri-star doji pattern is considered a rare candlestick pattern that indicates a trend reversal in the market as compared to other candlestick patterns. This does not mean that the tri-star candlestick pattern lacks accuracy as compared to the rest of the patterns. The need for market conditions to be in a volatile state after a particular trend makes the pattern rare.
It is crucial to remember that every candlestick pattern should be used in conjunction with other technical tools and other market factors. Backtesting the Tri-Star Doji pattern and analysing its historical performance in specific markets and timeframes provide a better understanding of its effectiveness and its accuracy in the markets.
When Is The Best Time To Trade Using The Tri-star Doji?
The tri-star doji candlestick pattern is a trend reversal signal and is used by both buyers and sellers to time the entry or exit of their trade. The Four factors that are required to be assessed in order to use the tri-star doji candlestick are listed below.
Market condition: The tri-star doji patterns are considered signals of trend reversal by traders. These patterns appear at the end of prolonged uptrends or downtrends. The traders look for points of entry in the market when the buying or selling demands have been exhausted.
Confirmation: The tri-star doji candlestick pattern, like any other trend reversal pattern, has the tendency to break in between, so the traders should wait for the confirmation and make sure that the pattern is completed before acting on it. Factors like trendlines, support and resistance levels, volume patterns, or other candlestick patterns are used in order to confirm the completion of the pattern.
Period of time: The effectiveness of the tri-star doji will vary across different time periods or frames. The greater the time period (weeks/months) across which the tri-star doji is used, the greater the accuracy the pattern will show.
Volatility: The tri-star doji pattern is considered to be an indicator of volatility. The traders who are looking to enter or exit the market consider the volatility of the market, and those with a greater risk appetite willtrade in the market.
Implementing proper risk management techniques, such as setting stop-loss orders to limit potential losses and considering other market factors, is also required while timing the trade with the tri-star doji candlestick pattern.
How to Trade with Tri-Star Doji in the Stock Market?
The tri-star doji, though rare, is used widely among the traders in the market. The tri-star doji candlestick pattern signals a trend reversal, and traders time their entry or exit accordingly. The 5 factors that should be considered while trading with tri-star doji are listed below.

Firstly, identify the tri-star doji pattern. The tri-star doji pattern, as the name suggests, consists of three dojis placed consecutively next to each other. These dojis are found at the end of a downtrend or an uptrend and indicate the trend reversal of the market. The middle doji of this pattern is called the star doji and has a gap on both sides, separating it from the preceding and succeeding candles.
Secondly, determine the location of the pattern in the chat. Traders should identify whether the tri-star doji pattern formed is bullish or bearish, depending on the market conditions and other technical indicators. A tri-star doji appearing after a downtrend is bullish and signals an uptrend, a tri-star doji that appears at the end of an uptrend is bearish. It indicates a trend reversal in the market. Traders take a short or long position by determining the type of tri-star doji.
Thirdly, confirm the pattern with other technical indicators. The Tri-Star Doji pattern is a potential reversal signal. It is important to confirm additional technical indicators or patterns for confirmation . The trader should look for supporting evidence such as trendlines, support and resistance levels, volume patterns, or other candlestick patterns that align with the potential reversal indicated by the tri-star doji.
Fourthly, make a trading decision. The decision of whether to enter or exit a trade while using the tri-star doji pattern depends on the trader’s risk-reward appetite. A trader who is willing to take risks enters the volatile market after the pattern has been completed. Traders who wish to trade at times of reduced volatility wait until the next trend sets in.
Lastly, implement proper risk management techniques. Implementing appropriate risk management techniques is necessary during trading. The trader should set a stop-loss order below the recent swing low (for bullish reversals) or above the recent swing high (for bearish reversals). This helps limit potential losses if the market does not behave as expected.
The tri-star doji pattern, like any other pattern, has its limitations when trading. The pattern cannot guarantee a hundred percent accurate prediction of the market movement, thus other factors and risk management techniques must be adopted by the traders to deal with unforeseen circumstances.
Where Is The Tri-Star Doji Commonly Used?
The tri-star candlestick pattern is a candlestick pattern that appears at the end of prolonged trends. It is used in different financial markets, like the stock market, foreign markets, and other indices. Tri-star is used in these three markets as mentioned below:-
In the Stock market, traders and investors in the stock market analyse individual stocks or indices using the Tri-Star Doji pattern to identify potential reversals. The traders must use other indicators to confirm the reversal.
In the Forex market, Traders in the foreign exchange market willutilise the Tri-Star Doji pattern to identify potential reversals in currency pairs.
In the Commodity market, traders in the commodity market, such as those trading gold, oil, or agricultural commodities, use the Tri-Star Doji pattern to identify potential turning points in price trends.
The traders, whether in the stock market or the foreign exchange market, need to take into account other technical factors and market sentiment. The greater the factors included, the greater the accuracy of the tri-star doji pattern.
Is the Tri-Star in an Uptrend a Sell Signal?
Yes. The tri-star doji that appears at the end of an uptrend is a sell signal. The tri-star doji is a signal for a trend reversal in the market. The tri-star doji are of two types: the bearish tri-star doji and the bullish tri-star doji pattern. The tri-star doji that appears at the end of an uptrend is referred to as the bearish tri-star doji and indicates a potential downtrend. The tri-star doji that appears at the end of an uptrend is considered a sell signal, as the pattern suggests the market will have a downtrend. The traders who have entered the market willbook quick profits by exiting the security. The traders also short the security as the prices will go down. The method that the trader undertakes will depend on his risk-reward appetite.
What are the advantages of the Tri-Star Doji Pattern?
The tri-star doji pattern offers several potential advantages in the field of technical analysis, which traders and analysts consider when evaluating market conditions. Understanding these advantages help traders make more informed trading decisions.The tri-star doji pattern is a potential trend reversal pattern and has mainly 3 advantages listed below.
Indication of a trend reversal. The tri-star doji pattern is an indicator of a trend reversal in the market. The traders act upon the trend by entering or exiting the market according to the tri-star doji pattern. Timely entering and exiting in the early stages of a trend will be profitable for the trader.
Easy to identify. The tri-star doji pattern is one of the easiest patterns to identify in the market. It will consist of three consecutive dojis in the market and is spotted at the end of a prolonged trend. The tri-star doji is easy to act upon and is considered one of the most widely used patterns in the market. Traders look for the specific arrangement of three consecutive doji candles, with the middle one being a star. This clarity in identification helps reduce the subjectivity of the candlestick pattern.
Versatility. The tri-star doji candlestick pattern is very versatile and is used across different markets. The tri-star candlestick pattern has similar properties across the different markets, thus following a general principle and making it easier for traders to act upon.
The tri-star doji pattern like any other pattern is not infallible. The candlestick should be used with other technical analysis and tools to make the pattern more accurate.
What are the disadvantages of Tri-Star Doji?
The tri-star doji pattern is a pattern that is followed by a reversal in trends in the market. The tri-star doji pattern, despite its potential significance as a reversal pattern, has certain disadvantages that should be considered. It is crucial for traders to be aware of these limitations and consider using the tri-star doji pattern as part of a comprehensive trading strategy rather than relying on it as the sole basis for their trading decisions.The major 3 disadvantages of the tri-star doji are listed below.
Rarity. The tri-star doji is a rare pattern that appears in the market. The tri-star doji occurs only when there is high volatility in the market.Traders find the practical applicability of the tri-star doji pattern limited, as it does not occur frequently enough for them to rely on it as a primary trading signal.
Lack of confirmation. The tri- star doji has the tendency to break the formation in between. There are instances where the pattern appears, suggesting a trend reversal, but the price continues to move in the same direction. Traders use additional confirmation indicators or patterns to validate the potential reversal signalled by the Tri-Star Doji.
Magnitude of gap up or down. The magnitude with which the trend reversal happens cannot be measured using the tri-star doji. The tri-Star doji pattern does not provide specific guidance regarding the magnitude or duration of the anticipated price movement. It only indicates a potential reversal without specifying the extent of the reversal or the subsequent trend.
Any candlestick pattern cannot be used alone. The candlestick patterns needed to be used with other technical indicators and market trends in order to reduce the inaccuracy of the candlestick pattern.
What is the opposite of Tri-Star Doji?
The tri-star doji pattern occurs at times of high volatility and indicates a trend reversal that will follow the pattern. There are two candlestick patterns that are considered opposite to the tri-star doji, they are as follows:
Tri-Star Bullish Pattern. The Tri-Star Bullish pattern is a three-candlestick pattern that indicates a potential bullish reversal in the market and appears at the end of a downtrend. It consists of three consecutive doji candlesticks, with the middle doji having a higher low and a lower high compared to the other two candlesticks in the pattern. The pattern indicates that the downtrend has ended and the possibility of a trend reversal exist
Tri-Star Bearish pattern. The Tri-Star Bearish pattern is a three-candlestick pattern indicating a potential bearish reversal. It consists of three consecutive doji candles, with the middle doji having a lower low and a higher high compared to the other two candlesticks in the pattern. This pattern indicates the end of an uptrend and the beginning of a bearish reversal in the market.
Both the bearish tri-star and the bullish tri-star patterns are considered the opposite of the tri-star doji pattern as they indicate a clear change in movement in the market. The three candlestick patterns are a rare sight in the market, and their accuracy increases by using them with other technical indicators and tools.
What are other types of Doji Patterns besides Tri-Star?
The Doji candlestick pattern is of bullish or bearish nature. The Doji candlestick appears in times of heavy trade volume The Doji pattern is formed when the demand and supply of the stock and market are equal and cancel each other. The Doji candlestick is divided into five categories depending on which party takes control first (the buyers or the sellers).
Long legged doji. The Long Legged Doji appears as both a bullish and bearish trend. The Long Legged Doji sign signifies that the opening and closing prices of a stock are almost the same. The high and low of the candlestick vary greatly. The Long Legged Doji suggests ambiguity in the market. The Long Legged Doji is taken as a signal to wait for the traders.
Dragonfly doji. The Dragonfly Doji is considered a signal for trend reversal in the market. The candlestick consists of an opening, a closing and a high close to each other, and a long lower shadow. The Dragonfly Doji is the counterpart of the Gravestone Doji. The candle is formed when the stock or market faces a high sell-off initially, but later the buyers tend to bring the price back up near its opening price.
Gravestone doji. The Gravestone Doji pattern is considered a bearish candlestick pattern that indicates a trend reversal in the market. The pattern is formed when a candlestick has opening, closing, and low prices near each other and a long upper shadow. The upper shadow indicates how the buyers initially dominated but later lost control to the sellers.
Four price doji. Four Price Doji, has the four elements of a candle, i.e. the opening price, closing price, the high ,and the low all lie at the same point. The Four Price Doji is an indication of high trade volumes taking place in the market. The sellers and buyers cancel each other out and high ambiguity remains in the market.
Ladder bottom doji. The ladder bottom doji pattern is a bullish pattern reversal. It is considered to be part of a five candlestick pattern; the ladder bottom doji appears at the end of the downtrend and signals an upcoming trend reversal. The pattern shows a progressive weakness, and the end of the pattern is signalled by the ladder bottom doji.
The doji candlesticks are valuable tools in technical analysis that provide insights into market sentiment and potential reversals. By understanding the different types of doji patterns, traders can enhance their ability to interpret price action and make informed trading decisions.
What Doji Pattern is Similar to Tri-Star Doji?
The doji candlestick pattern that is most similar to the tri-star doji pattern is the morning doji star. There are key similarities between the tri-star doji and morning doji star patterns. Both are bullish reversal patterns that signal a potential end to a downtrend. Both are made up of three consecutive candlesticks – a long red candle, a doji, and a green candle. The middle doji candle shows indecision after a decline, indicating the downtrend may be exhausting itself. The green confirmation candle after the doji reflects the resurgence of buying pressure. In both patterns, the doji represents a transition point where bearish momentum falters and bulls start asserting control. The main difference is that tri-star doji consists of three doji candles whereas the morning doji star has a normal green candle as the third confirmation candle. Otherwise, the sequence of a long red candle followed by a doji and a bullish candle making higher highs and lows is common to both patterns. These three-candle formations have similar implications of a potential trend reversal. Traders can look for either pattern to signal downtrend exhaustion and anticipate a move higher.
Is the pattern of the Tri-Star a bullish reversal?
No. The tri-star pattern is not necessarily a bullish reversal pattern. The tri-star pattern is either a bullish or bearish reversal. The tri-star prominently signifies a trend reversal and appears at the time of volatility in the market. The tri-star pattern is characterised by three doji candlesticks that appear consecutively, with the middle doji being a star doji. The interpretation of the tri-star depends on where the pattern appeared in the market. The pattern is considered a bullish reversal if it appears at the end of a downtrend, and it is considered a bearish reversal if it appears at the end of an uptrend.


 Previous Article


![15 Investing.com Alternatives [Free+Paid] You Should Use in 2026](https://www.strike.money/wp-content/uploads/2026/04/Investing.com-Alternatives.jpg "15 Investing.com Alternatives [Free+Paid] You Should Use in 2026 52")
![15 TradeStation Alternatives [Free+Paid] You Should Use in 2026](https://www.strike.money/wp-content/uploads/2026/04/TradeStation-Alternatives.jpg "15 TradeStation Alternatives [Free+Paid] You Should Use in 2026 53")
![15 Chartink Alternatives [Free+Paid] You Should Use in 2026](https://www.strike.money/wp-content/uploads/2026/04/Chartlink-Alternatives.jpg "15 Chartink Alternatives [Free+Paid] You Should Use in 2026 54")
: Overview, 10 Types of Indicators, Settings for Different Markets 56")

 : Definition, Formula, calculation, Uses, Advantages Vs limitations 58")


No Comments Yet.