Trendlines are custom lines drawn on price charts to connect a sequence of prices to get a likelihood of future trajectory of price. Trend lines are most commonly used in price charts to make it easier for traders to analyze a trend. A trendline is drawn above pivot highs (Sequence of proper higher lows) or below pivot lows (sequence of proper lower highs) to indicate the predominant price direction.
Trend lines are an essential tool used in charting and technical analysis. The least-squares method of fitting a line to the data points yields the trendline equation. The slope of the trendline indicates the strength of the trend, while the y-intercept is the starting point of the trend. The trend line graph is used to project future price movements based on historical trends. Linear trend lines are the most commonly used trend lines in technical analysis.
What is a Trend Line?
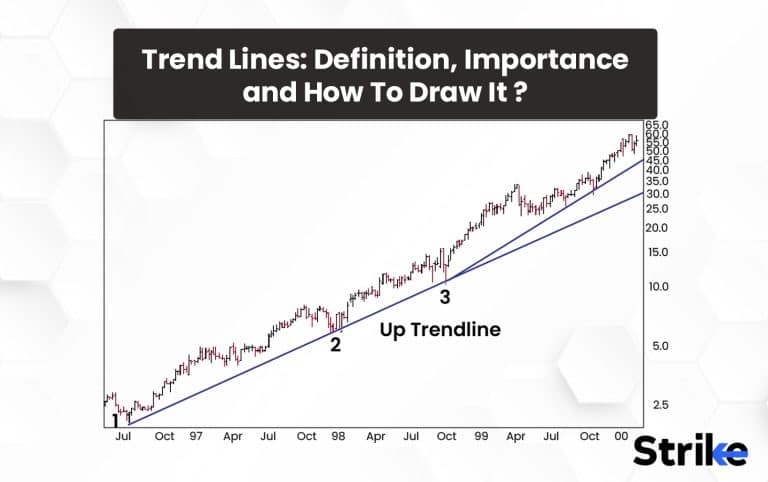
A trend line is a slanting straight line connecting two or more price points (importantly higher lows or lower highs) and extending into the future to act as a support or resistance line. The trend line is employed to offer the trader an indication of the direction in which the price is more likely to flow. They illustrate the direction and velocity of prices, when two trendlines are created during price consolidation, it leads to creation or observance of patterns. These patterns further amplify trading signals. Trend lines are lines drawn above or below the price at an angle. Below is a pictorial representation of the same.

In the image uploaded above, look how the extended trendline highlighted in the black color acted as the slanting resistance levels where traders could have taken this opportunity to take short trades with other confirmations.
Trend lines are used to estimate support and resistance levels in a price chart. Take a look at the picture below.

The graph uploaded above illustrates support and resistance levels. The support level is the price level at which a falling stock or other financial instrument tends to find support. It is the point at which demand is sufficient to prevent further price declines. In the case of trendlines, the support is taken at this slanting price points represented by drawn trendlines.
The resistance level is the reverse of the support level and represents the price level at which the financial instrument tends to encounter resistance as it increases. It’s the point at which selling pressure becomes sufficiently intense to prevent the price from rising further. In the case of trendlines, the resistance is taken at the slanting price points represented by drawn trendlines.
Trend lines are used to identify trends in different time frames, such as short-term, intermediate-term, or long-term trends. Traders often use trend lines in conjunction with other technical indicators to help identify potential buy or sell signals. But trend lines are not always precise, and traders should consider using a “best fit” approach when drawing them.
What is the Importance of a Trend Line?
Trend lines are important in the stock market because they help traders & short term investors identify the direction of a script’s price movement. Trend lines show whether a script/stock is in an uptrend, a downtrend, or trading sideways by connecting the highs or lows of a stock’s price over a period of time.
Let’s look at an example to understand this better. Let’s assume we are looking at the stock price movement of Reliance Industries Limited (RIL) over the past six months. We will use a daily chart to analyze the stock’s price movement.
We will connect the highs or lows of the stock’s price movement to create a trend line. We will connect the lows if the stock is in an uptrend. Take a look at the picture below.

From the example posted above, one can understand how critical and important trend lines are. They work as a classic subjective tool to interpret market data and after plotting a logical trendline, it gives a visual future predictability of how the trend is supposed to look like. After combining different factors, trend lines stands out as a strong factor to validate a trading setup to initiate a trade by taking into consideration appropriate risk management.
How to Draw a Trend Line?
The first step in drawing the trend line is determining the trend. Evaluate whether the trend is an uptrend or in a downtrend by examining the chart. A rising trend is marked by higher highs and higher lows, whereas a falling trend is marked by lower highs and lower lows. Let us take an example of a downward trend to understand this better.
The steps that are supposed to be followed to draw a trend line are:
- Identify the trend of a stock. If it’s in an uptrend, it will have a series of Higher Highs and Higher Lows, this gives an interpretation that the price of the stock is in a phase of constant rise. If its in a downtrend as taken in the example below, Lower Lows and prominent Lower high’s are identified.
- After identifying relevant lower highs, atleast 2 – 3 lower high’s are connected by drawing a slanting line. This slanting line is projected on to the chart to form a defined trendline as shown in the image below.

3. The trendline drawn and extended from the relevant lower highs, the price of the trendline is presumed to work as a resistance and react when the price reaches.
4. The black boxes in the image above represent the reaction of cmp to the trendline resistance and how it further managed to create Lower lows internally.
5. The trendline has continued to act as a resistance and provided multiple trading opportunities.
Traders use this trend line as a guide when making trading decisions. Although trendlines can be drawn on all the time frames, the accuracy of the working of trendlines largely depends on how a trader is identifying relevant pivot lows or pivot highs. They also work much better on higher time frames. In today’s era, market participants are heavily dependent on trendlines, thus, they should be drawn properly to avoid traps and must incorporate other tools and indicators to solidify a trading setup. Multiple trend lines during the same time period gives rise to formation of chart patterns.
What does the Trend Line Indicate?
Trend lines indicate and predict the future direction of a security’s price. A rising trend line indicates an uptrend, while a falling trend line indicates a downtrend.
Trend lines are used to identify potential entry and exit points for trades. A trader for example, may look to buy a security when the price touches a rising trend line, or sell when the price touches a falling trend line.
What are the Advantages of Trend Line?
Trend lines have advantages including helping predict exit and entry points, finding support and resistance levels etc. Below are 4 main advantages of using a trend line.
- Trend identification
Trend lines assist traders in identifying trends in the price movement of a stock. Traders can easily determine if the stock is in an uptrend or a downtrend by linking the higher lows and lower highs of a company’s price with a line. This assists traders to make more educated judgments on the purchase or sale of the asset.
- Identifying support and resistance levels
Traders use trend lines to establish a stock’s support and resistance levels. Support levels are the price levels at which it is anticipated that buyers will enter the market, whereas resistance levels are the price levels at which it is anticipated that sellers will enter the market. Traders detect key levels and make trading decisions based on them by connecting the pivot lows or pivot highs of a stock’s price movement with trend lines.
- Timing entry and exit
Trend lines are used to determine entry and exit points for trading. With the help of a trendline, a trader can ride the enter trend and place trailing stop losses a few points above (if a short position is taken) or below a trendline (if a long position is taken). A trader after validating a trading setup can place long positions on a relevant rising trendline or vice versa.
- Trend confirmation
Trend lines provide support for other technical indicators for trend confirmation. A trader, for instance, waits for the price to come back to the trend line before starting a long position if a company is in an uptrend and the relative strength index (RSI) indicates that circumstances are overbought.
Utilizing trend lines in combination with other technical analysis tools help traders make informed decisions when buying or selling assets.
What are the Disadvantages of Trend Line?
Trend lines come with disadvantages as well even when they are commonly used. Below are the 5 main drawbacks of using trend lines for technical analysis.
- Subjectivity
The location of trend lines might differ from analyst to analyst due to their subjectivity. This might lead to plotting of incorrect or irrelevant trend lines that may lead to incorrect introspection of the respective trend which results in trade signals that contradict one another.
- False signals
Trend lines are often plot indirectly and the over dependence on trend lines by retail traders give rise to increasing manipulation and traps generating false signals. A break in a trend line is not always indicative of a trend reversal, so it is essential to corroborate the signal using additional technical indicators.
- Time limitations
Trend line plotted on a specific time frame setting should not be considered as a support or resistance on another time frame, meaning, a trendline plotted on 5 minutes will not be affective on 15 min or any other time frames. Though, the accuracy of the trendline is directly proportional to higher time frames.
- Backwards-looking
Trend lines are backwards-looking as they are derived from past price information. They do not consider the influence of fresh information, news events, or market sentiment shifts that affect the price of a stock.
Trend lines remain a popular tool among technical analysts despite these disadvantages. Multiple trendlines within the same time period leads to creation of chart patterns. Traders and investors should use trend lines in conjunction with other technical indicators and fundamental analysis to make informed trading decisions.
Trend lines are also considered as the basis of technical analysis or modern price action. They are the skeleton of price patterns that are used by traders trading in all the segments of capital markets. From forex markets, Cryptocurrencies, Commodity trading, stocks and derivatives. Trend lines do work efficiently if they are drawn correctly. From day traders to short term traders, each of the trading styles has incorporated trend lines in their systems in some or the other way to discover potential trading opportunities.
Who Should Use Trend Lines?
Trend lines are also considered as the basis of technical analysis or modern price action. They are the skeleton of price patterns that are used by traders trading in all the segments of capital markets. From forex markets, Cryptocurrencies, Commodity trading, stocks and derivatives.
Trend lines do work efficiently if they are drawn correctly. From day traders to short term traders, each of the trading styles has incorporated trend lines in their systems in some or the other way to discover potential trading opportunities and detect market trends.
Where Does the Stock Trend Lines Be Used?
Trend lines are used to identify the direction of the price movement of a stock. They are created by connecting two or more relevant price points on a stock chart and are used to identify levels of support and resistance. Support levels represent areas where the price of a stock has historically found support, whereas resistance levels represent areas where the price of a stock has historically encountered resistance. Investors make more informed decisions regarding when to purchase or sell a stock by understanding these levels. Trend lines are used to identify potential trend reversals and confirm existing trends.
What are the Different Types of Trend Lines?
Trend lines are employed to determine the direction of a scrip’s price and the trend of it over time.
- Primary trend line
This primary trend line is a trend line usually drawn on the Higher Time Frame to interpret the trend of the stock on the higher time frame. This is usually the impulsive main trend of a stock and there are multiple smaller trends within this main, primary trend. These lines are plotted on Daily, Weekly and Monthly Time Frames.
- Secondary trend lines
These secondary trend lines are usually plotted on smaller time frames and they represent the trend of a stock within the primary trend. Multiple secondary trendlines can be plotted within the primary trend, these secondary lines give trading signals on multiple occasions but the accuracy is comparatively much lesser than the signals generated by primary trendlines. These lines are plotted on 1h, 15 min, 30 min Time Frames.
Day traders and scalpers plot trend lines on much lower time frames like 1 min, 3 min, 5 min. These trendlines generate a higher number of signals but the potential of false signals is large. They are still plotted to get scalping opportunities on these smaller time frames and the secondary trend lines are used in conjecture to these internal trend lines for a better setup.

- Linear trend line
A linear trend line is a straight line used to illustrate the general direction of a trend in data over time. It is the most common form of trend line. Most stock charts use linear trend lines. Below is how a linear trend line looks.

- Exponential Trend Line
An exponential trend line is a curved line that is used when the rate of change in the data remains constant as a percentage. It is frequently used to illustrate data that is accelerating in either direction.

- Logarithmic Trend Line
A logarithmic trend line is a curved line used when the rate of change in the data is decreasing over time. It is frequently used to depict data that initially increases quickly but then slows over time.

- Polynomial trend line
A polynomial trend line is a curved line used when data is best represented by a polynomial equation. It is frequently used to illustrate data with multiple turning points.

- Moving Average Trend Line
A moving average trend line is a line calculated by averaging a constant number of data points over time. It is frequently employed to smooth out data fluctuations and determine the general direction of the trend.

Each type of trend line has its own advantages and disadvantages and is ideally suited for a distinct set of data. It is essential to select the appropriate type of trend line according to the characteristics of the data being analyzed.
What are the Different Scale Settings for Trend Lines?
Different scale settings for trend lines are used to adjust the accuracy of the trend line to fit the data. There are three main scale settings for trend lines and they are linear, logarithmic and polynomial scale.
The linear scale is the default setting for trend lines and is used when the data is evenly distributed. It is appropriate for data that increases or decreases at a constant rate.
A logarithmic scale is used when the data has a large variation in values, such as in financial data, where the values may range from small to large. A logarithmic scale helps to better visualize the data and identify trends that may not be apparent on a linear scale.
The polynomial scale is used when the data has a nonlinear relationship and a straight line cannot accurately represent the data. A polynomial trend line is used to fit a curve to the data, such as a quadratic or cubic equation.
What Does Validating Mean for Trend Line Analysis?
Validating refers to the process of confirming the accuracy and reliability of a trend line drawn on a chart. Traders and analysts look for several key factors to validate a trend line. First, they ensure that the trend line was drawn using multiple significant and relevant price points to the asset under consideration. This helps to ensure that the trend line accurately reflects the asset’s overall trend.
They then look for additional technical indicators or chart patterns to confirm the trend line. Traders may seek confirmation from bullish candlestick patterns or rising moving averages if a trend line indicates an uptrend in an asset for example. Traders may use any appropriate technical indicator here.
Traders and analysts then watch how the asset reacts when it reaches near the trend line. The trend line is considered validated if the asset bounces off the trend line and continues in the same direction as the trend. The asset breaking through the trend line and moving in the opposite direction may indicate that the trend has changed or that the trend line was inaccurate.
Is there an Equation for the Trend Line?
Yes, there is an equation for the trend line, which is also known as the line of best fit. The equation is Y = mX + b, where Y is the dependent variable, X is the independent variable, m is the slope of the line, and b is the y-intercept. The slope of the line is calculated using the formula m = (n∑XY – ∑X∑Y) / (n∑X^2 – (∑X)^2), where n is the number of data points, X and Y are the variables, and ∑ represents the sum of the values. The y-intercept is calculated using the formula b = (∑Y – m∑X) / n.
Tools and charts have trend lines built to ensure using them is a breeze and you don’t need to worry about calculations. Knowing the calculation would, however, help us understand how they work better.
Let us look at an example.
Let’s assume we have collected data on the sales of a company over a period of 5 years. We can then create a trend line to predict future sales based on this data.
| Year | Sales (in millions of dollars) |
| 2019 | 20 |
| 2020 | 22 |
| 2021 | 25 |
| 2022 | 28 |
| 2023 | 32 |
We need to calculate the slope (m) and y-intercept (b) using the formulas mentioned above first.
∑X = 101 (sum of years)
∑Y = 127 (sum of sales)
∑XY = 3138 (sum of the product of year and sales)
∑X^2 = 5105 (sum of the squares of the years)
We use these values to calculate the slope (m) next
m = (n∑XY – ∑X∑Y) / (n∑X^2 – (∑X)^2)
= (5(3138) – (101)(127)) / (5(5105) – (101)^2)
= 2.85
So the slope of the trend line is 2.85. This means that for every one-year increase in time, we expect sales to increase by 2.85 million dollars.
Then calculate the y-intercept (b):
b = (∑Y – m∑X) / n
= (127 – (2.85)(101)) / 5
= 7.64
So the y-intercept of the trend line is 7.64 million dollars.
Putting it all together, the equation of the trend line is
Y = mX + b
= 2.85X + 7.64
This equation can now be used to predict future sales based on the trend line.
Does Trend Lines Only Applicable for Candlesticks?
No, trend lines are applied to any type of chart, including line charts, bar charts, and candlestick charts. Candlestick patterns with trend lines offer an elegant trading approach that is flexible and effective. They are drawn on any chart to help identify key levels of support and resistance, as well as potential breakouts and trend reversals.
Do Trendlines have the same purpose as Channels?
No. Trend Lines and channels serve slightly different purposes. Both help traders identify trends in the market but trendlines are used to identify the direction of the trend, while channels are used to identify the range in which the price is likely to move. Trendlines are drawn by connecting the lows or highs of an asset’s price action, while channels are drawn by connecting both the highs and lows of price action. Channels help traders identify potential support and resistance levels and are used to set entry and exit points.
What is the Difference between Trend Lines and Channels in Stock Market Charts?
A trend line is a straight line that connects two or more price points, indicating the direction of the overall trend. It is used to identify support and resistance levels and to help traders make buy or sell decisions. It helps visualize the data better.
Channels are two parallel trend lines that form a trading range, indicating a range-bound market with clear support and resistance levels. A channel is used to identify potential entry and exit points for trades. Channels provide more specific information about potential trading opportunities within a range-bound market. Trend lines are more popular and widely used, however.


 Previous Article


![15 Investing.com Alternatives [Free+Paid] You Should Use in 2026](https://www.strike.money/wp-content/uploads/2026/04/Investing.com-Alternatives.jpg "15 Investing.com Alternatives [Free+Paid] You Should Use in 2026 124")
![15 TradeStation Alternatives [Free+Paid] You Should Use in 2026](https://www.strike.money/wp-content/uploads/2026/04/TradeStation-Alternatives.jpg "15 TradeStation Alternatives [Free+Paid] You Should Use in 2026 125")
![15 Chartink Alternatives [Free+Paid] You Should Use in 2026](https://www.strike.money/wp-content/uploads/2026/04/Chartlink-Alternatives.jpg "15 Chartink Alternatives [Free+Paid] You Should Use in 2026 126")
: Overview, 10 Types of Indicators, Settings for Different Markets 128")

 : Definition, Formula, calculation, Uses, Advantages Vs limitations 130")


: How We Used This 70/30 Indicator in 6 High Win-rate Strategies 134")


No Comments Yet.