Supply and demand zones are specific price levels in financial markets where there are lots of pending orders. The demand and supply zone is a place where the trader sells the shares and a place where the trader buys the shares, respectively. The analysis technique of supply and demand zones helps identify potential buying and selling areas for shares. The traders locate these zones on a chart by looking for instances where the price makes a significant move after a period of consolidation. The price should be above the current level in supply trading. The price should be below the current level of in-demand trading.
There are two types of demand and supply patterns. The patterns are reversal and continuous patterns. Reversal patterns occur when the prevailing price of shares reverses from an upward trend to a downward trend or vice versa. Continuous patterns involve constant price movements that fluctuate between ups and downs.
The supply and demand zone plays an important role in forex trading as it provides traders with information about market support and resistance levels. Traders can make decisions and develop winning strategies when they understand and identify these zones. Understanding these zones empowers traders to leverage their potential and maximize profits in the forex market. For example, trading strategies in demand and supply zones include breakout trading, price action trading, support and resistance trading, volume analysis trading, and Fibonacci retracement trading.
What Does Demand and Supply Zone Mean?
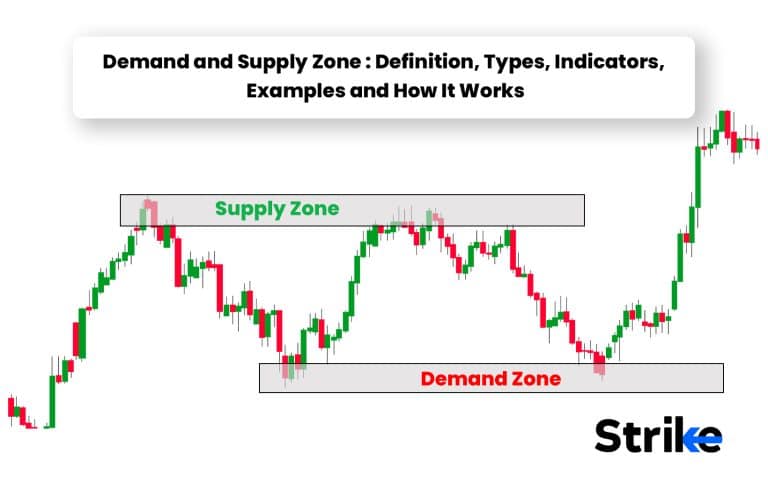
Demand and supply zones refer to areas on a price chart where significant buying or selling pressure has occurred in the past. Demand zones indicate levels where buyers were dominant and pushed the price higher. Supply zones show areas where sellers overwhelmed buyers and drove the price lower.
Demand and supply zones are identified through price action analysis. Traders look back at historical price movements to pinpoint: spikes in trading volume showing increased participation and interest; sizeable upward or downward price swings marking a potential trend shift; sharp reversals off a level as buyers or sellers enters and absorb orders quickly; gaps up or down in price driven by heavy volumes; and periods of price consolidation signaling indecision before a breakout. The more times a level acts as demand or supply, the stronger the zone.
As price revisits historical demand or supply zones, the volumes and orders accumulated previously come back into play. At demand, buy orders absorb selling pressure and provide support, creating a price floor. The opposite happens at supply zones. When entering a zone, traders place stop orders around the level to get into the expected move. This further strengthens the zone. The high volumes give traders confidence in a zone’s significance and that a reversal is likely at the price level again.
There are two primary approaches to trading demand and supply zones: Place stop buy/sell orders at or around the zone to enter on a reversal and exit on a break of the zone extreme; Look for confirming price rejection signals like bullish/bearish engulfing patterns to take entries at the zones using invalidation stops. In summary, demand and supply zones offer high probability reversal points to incorporate into technical analysis based on previous price action reactions.
How Does Demand and Supply Zone Work?
A demand zone occurs when there is a high demand for a particular asset. Also, there are more buyers than sellers. It leads to a price level where buyers are willing to enter or re-enter the market, and demand for assets increases. A demand zone is where prices have previously bounced off at a support level.

A supply zone occurs when a particular asset has a high supply, it also means that there are more sellers than buyers. This leads to a price level where sellers are willing to enter or re-enter the market and supply for assets increases. A supply zone is where prices have previously bounced off at a resistance level.
Traders can use the demand and supply zone for trading activity with the help of determining the price action signals, such as bullish or bearish reversal patterns, breakouts, or bounce-off. Traders can also use it to stop loss levels and gain profit targets. The demand and supply zone can’t determine the exact levels as the market changes; its reaction also changes.
What are the Types of Demand and Supply Patterns?
Knowing the demand and supply patterns helps traders identify the market and make buying and selling decisions. Traders recognized two types of supply and demand patterns, continuous and reversal patterns.
Continuous pattern: A continuous pattern is one in which the price moves continually toward the prevailing price trend, either up or down. This continuous pattern is weak since prices tend to break in these structures. There are two kinds of continuous patterns.

In Drop base drop, the price initially drops and pauses to create a base, and then continues moving down in a strong direction.Traders can trade in two ways: Firstly, selling a stock when the price returns to the touch in the supply zone after full swing. Secondly, selling a stock when the price returns to supply after building the support zone.
In Rally based Rally, this structure is characterized by a rise in price, followed by a period of consolidation, and then another price rise. Traders can use this structure by purchasing this stock when the price returns to the demand zone after full swing.

The above chart shows the demand zone on the left side. The demand zone on the left side of the chart shows the price rallies up to create a base. The price then continues moving upward in the rally-based rally structure. The long candles represent the price rise of security.
The price drops, creating a base in the supply zone. The price then moves downward, forming a drop-based-drop structure.
Reverse patterns: Reverse patterns refer to situations when prevailing price trends reverse from up to down or down to up. The pattern is proper when large price changes occur. The following are the two types of reverse patterns.

In Drop base drop, the drop base drop structure is a price pattern occurring when the market first decreases, then creates a base structure, and finally the price rises upwards. The drop base drop is a strategy where traders sell at higher prices and buy at low prices when trends reverse. This strategy is helpful in bear markets.
In Rally based Rally, the structure is a price pattern occurring when the market is first increasing, then creates a base price structure and then moves downward significantly.

The long candles show a drop in the rally-based rally structure at the supply zone where the price leaves the base structure. The drop represents a supply-demand imbalance at a price level. Prices drop first, create a base, and then finally rally up in the Drop base drop structure of the demand zone.
What are the Demand and Supply Zone Indicators?
The demand and supply zone is useful in technical analysis to determine the potential areas of selling and buying the shares. The indicators which determine demand and supply zone is as follows:
Pivot points: Traders use pivot points to determine the supply and demand zone, which refers to support and resistance levels. These pivot points indicate the traders’ average low, high, and closing prices from the last trading days.
Support and resistance levels: Traders can use this concept to understand how support levels indicate the price levels where downward movement stops due to increasing asset demand and how resistance levels cause the price moves upward and reverses with a sell-off.
Fibonacci levels: Fibonacci levels determine the turning point at demand and supply zones. These retracements are based on crucial buying or selling pressure levels, such as 50% and 61% retracements.
Moving Averages: A moving average is used to identify demand and supply zones. The price above a moving average indicates a demand zone, while the price below a moving average indicates a supply zone.
Price action analysis: Traders can identify where the price has bounced off previously with the help of a price chart. For instance, a price level where the price has bounced at a certain level in the past, is likely to be a strong demand and supply zone.
Traders use the combination of these indicators to determine the market’s demand and supply zones. It also helps traders to make informed decisions and improve their chances of gaining maximum profits in the markets.
How is Demand and Supply Zone Drawn?
Demand and supply zones are drawn when it is identified the areas on a chart where buyers and sellers have previously clashed. These zones are useful in predicting where future movements occur.
Buyers first predict a price level in the demand zone, where there is a significant increase in buying pressure. A horizontal line is drawn from the lowest point of the candle to the highest point of the candles once you identify the price level. traders use it to identify potential areas of support and resistance levels after the demand and supply zone is drawn. Support level is a price level where buyers are likely to step in and prevent prices from falling. Resistance level is a price level where sellers are likely to step in and prevent price from rising.
What is an example of a Demand and Supply zone?
You can understand supply and demand zones on the chart when you know what to look for in the chart. Let’s understand these from the chart example.

The chart above is drop-base-rally. The base builds first; after that, the price drops to that level, and the rally is created. The chart shows that the price level went down twice and got reversed both times. The green dotted line shows the second reverse. Traders identify common chart pattern types that have occurred in the past and occur in the future by analyzing the historical price movements of an asset.
What Are the Key Characteristics of A Demand and Supply Zone?
Demand and supply zone is an essential concept in technical analysis. It is the method of evaluating the securities in market activity, such as price and volume. Here are the five key characteristics of the demand and supply zone.
Price level: The specified price level on the chart, where the price reverses, represents buyers and sellers entering the market.
Support and Resistance: A supply zone indicates the resistance level, and a demand zone indicates the support level. A demand zone helps in creating a barrier against a further price decline, providing support to the price. A supply zone acts as resistance to the price movement by creating a barrier against further price increases.
Volume: A high volume in trading indicates that buyers and sellers are interested in the assets at the specified price level.
Buying and selling pressure: Sellers in the supply zone sell the assets, increasing the selling pressures. Buyers in the demand zone are ready to buy the assets, leading to an increase in buying pressures.
Probability of price reversal: The price is likely to reverse in the demand zone as buyers are ready to buy the security and increase the price. The price is likely to reverse in the supply zone as sellers are prepared to sell the security and lower the price.
Understanding the key characteristics of demand and supply zone will help traders use it to its best potential.
How Do Traders Identify Demand and Supply Zones in The Market?
Traders identify demand and supply zones in the market with price charts. Firstly, traders begin looking for the areas on the price chart where the price has reversed multiple times, indicating the presence of demand and supply.
Secondly, mark these areas on the chart as potential demand and support zones. Thirdly, draw a horizontal line at the level of the previous price reversal. Fourthly, determining technical indicators such as volume, candlesticks, or trendlines patterns. It is needed to confirm the demand and supply zone. The trader can make trading decisions after the confirmation of demand and supply zone.
How Does the Law of Supply and Demand Apply to Trading in Demand and Supply Zones?
The law of supply and demand refers that the price of a product or service depends on the relationship between quantity supplied and demanded. Low demand for assets results in the high supply, leading to the decreases in the assets price. Demand for the asset is high and the supply is limited, as a result there are increases in the asset price.
There are more buyers than sellers at a price level, in a demand zone, which leads to increases in the price of the assets. Traders trade within a demand zone to take advantage of this price increase. Conversely, there are more sellers than buyers at a price level, in the supply zone, which leads to a decrease in the asset price. Traders use demand and supply zones to make trading decisions.
How Do Support and Resistance Levels Relate to Demand and Supply Zones?
Support and resistance levels are related to the supply and demand zone in the financial market. The support level at which buyers enter the market aims to prevent the price from falling from previous price and it indicates a strong demand zone where buyer pressure is exceeding the sales. Buyers buy the security at this time with the expectation that the price will bounce back up.
Resistance levels are price points at which sellers enter the market to prevent the price from rising from its previous price. This represents a strong supply zone, where selling pressure exceeds the buying pressure. Traders sell their security at this time because they expect the price to reverse and move lower.
What are the Best Time Frames for Demand and Supply Zones?
The demand and supply zone is best used for day and swing trading. The best time frames for demand and supply zones however, are intraday or daily. The traders for diversification have to look for different time frames and asset classes. Traders should also look for different time frames to gain profit.
What are the trading strategies that traders can use in Demand and Supply Zones?
Traders can use demand and supply zones as an effective trading strategy as they can take advantage of market imbalances and price reversals. The traders is using 5 strategy in the demand and supply zone is as follow given:
In Support and Resistance Trading, traders buy the security at the demand zones as the support level, while selling at supply zones is known as the resistance level. However, the investors look for bullish indicators when the price reaches the demand zone to enter in the long position. The bullish indicator such as a bullish candlestick pattern or bullish divergence. Investors look for bearish indicators when the price reaches a supply zone such as a bearish candlestick pattern or bearish divergence, entering a short position.
In Breakout trading, traders enter a long position when the price breaks out in the demand zone, looking for a bullish indicator. Conversely, traders seek a bearish indicator to enter a short position when there is a breakout in the supply zone. However, traders can manage risks and set stop-loss orders while engaging in breakout trading.
In Pull back trading, the demand and supply zone depends on the assumption that prices will bounce off and continue towards the trend.
In Price action trading, traders can enter the market by determining the price of the security. They can determine the price with pin bars, inside bars, and engulfing patterns. The patterns indicate a continuous or reverse trend.
In Trend following trading strategy, traders buy in the demand zones to support the price in an uptrend and sell in the supply zones to resist the price in a downtrend.
The above 5 strategies are used by the traders while buying and selling the security in the demand and supply zone. The strategy also helps traders give direction about the trend in the market.
What is the importance of demand and supply zones to technical analysis?
Demand and supply zone is a critical concept in technical analysis because it helps traders determine the security price level in reverse or continue the trend, it also gives a better understanding to traders about the market conditions so they can make selling and buying decisions.
The strategies associated with demand and supply zones provide a wealth of information pertaining to potential reversals, effective risk management, identification of consolidation patterns, establishment of support and resistance levels, and gauging market sentiment. This comprehensive informational analysis equips traders with the tools they need to make astute trade decisions, ultimately enhancing their overall trading performance.
What are the things to consider for supply and demand trading?
Supply and demand trading is a popular approach used in financial markets to identify potential price levels where buying or selling pressure occurs. Here are six key things to consider when applying supply and demand trading strategies:
Identify significant supply and demand zones. Traders should identify a series of highs or lows on the price charts to identify zones of significant purchasing (demand) or selling (supply) activity.
Understand market context. Understanding market context considering the larger market environment, including trends, patterns, and essential support and resistance levels to assess the strength of supply and demand zones and future trading opportunities.
Use multiple timeframes. Investors have to analyze several periods to validate the presence of supply and demand zones. Lower periods give more accurate entry and exit opportunities, while higher time frames can offer a broader perspective on the overall market dynamics.
Consider risk management. Use appropriate strategies to safeguard your funds and reduce possible losses, including establishing stop-loss orders, controlling position sizes, and considering overall risk-to-reward ratios.
Combine with other technical tools. Combine supply and demand research with additional technical tools like trend lines, moving averages, and price patterns to boost your trading judgments even more.
Stay disciplined. Maintain your trading strategy, refrain from trading under the influence of emotion, and wait patiently for the perfect setups to emerge based on supply and demand zones.
Using supply and demand research in conjunction with other technical tools and to stick to a laid-out trading strategy are crucial to maximize successful trading.
Is the Time Period a Determinant of Supply?
No. The availability of resources, production technology, market demand, governmental laws, and competitive dynamics affecting supply. The time period have a short term impact on supply volume due to seasonal variations or brief interruptions, but it does not ultimately determine supply. Supply factors are intricate and diverse, and the time frame cannot be considered the deciding factor.
Is the Time Period a Determinant of Demand?
No. Demand does not vary by the time of day. Consumer preferences, income levels, pricing, advertising, and market circumstances affect the demand. However, time does not affect demand but indirectly impacts it through seasonal or cyclical trends. For instance, ice cream consumption increases throughout the summer months owing to the heat, but this is more a result of seasonal circumstances than the season itself. Demand can fluctuate over time due to factors such as customer preferences, income levels, pricing and market conditions. ,
Is Demand and Supply Zone Used for Trading Cryptocurrency?
Yes, demand and supply zones strategy is useful in trading cryptocurrencies as well. Cryptocurrencies have the similar pattern and price behaviors as traditional markets. The price charts are useful in demand and supply zone strategy to identify buying and selling pressure. These zones play an important role in support and resistance levels as price can reverse or big movements in price can take place.
You should consider unique factors of cryptocurrency when you are using demand and supply zone strategy. The factors such as high volatility, 24/7 trading availability, market sentiment, regulatory development and news events.
Is Demand and Supply Zone a Good Strategy for Trading?
Yes, using demand and supply zones as a trading method is successful. Zones of demand and supply are places on a price chart where there has historically been a lot of buying or selling activity. The demand and supply zones can give traders probable trade entry and exit opportunities when combined with other technical analysis tools and market indicators.
It should be carefully back tested and validated in the various market scenarios before you use demand and supply zones, as it is the primary basis for trading choices. It is also essential to appropriately manage risk and employ appropriate risk management approaches to guard against possible losses.


 Previous Article


![15 Investing.com Alternatives [Free+Paid] You Should Use in 2026](https://www.strike.money/wp-content/uploads/2026/04/Investing.com-Alternatives.jpg "15 Investing.com Alternatives [Free+Paid] You Should Use in 2026 76")
![15 TradeStation Alternatives [Free+Paid] You Should Use in 2026](https://www.strike.money/wp-content/uploads/2026/04/TradeStation-Alternatives.jpg "15 TradeStation Alternatives [Free+Paid] You Should Use in 2026 77")
![15 Chartink Alternatives [Free+Paid] You Should Use in 2026](https://www.strike.money/wp-content/uploads/2026/04/Chartlink-Alternatives.jpg "15 Chartink Alternatives [Free+Paid] You Should Use in 2026 78")
: Overview, 10 Types of Indicators, Settings for Different Markets 79")


 : Definition, Formula, calculation, Uses, Advantages Vs limitations 82")


No Comments Yet.