The Cup and Handle is a technical chart pattern, which acts as a bullish signal and it features a structure that is similar to a “u” form having a small downward drift. The Cup and Handle forms during a small time frame or take weeks.
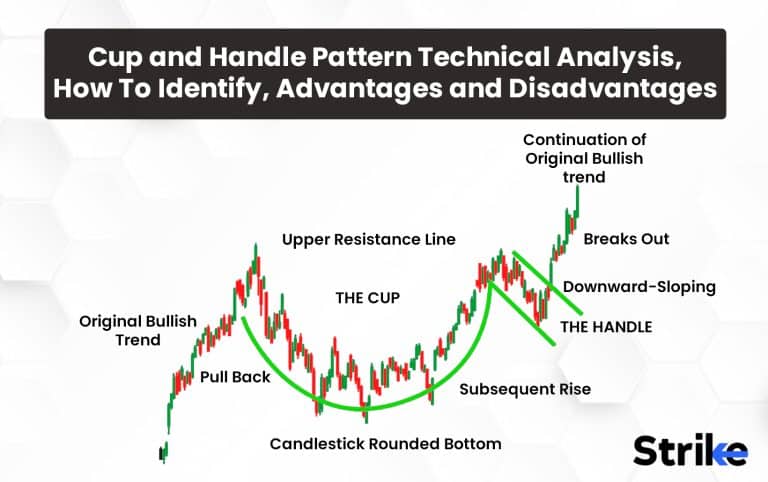
The Cup and Handle Pattern are identified with the help of its two fundamental components: the cup and the handle. The asset price declines gradually with a rounded bottom to form the cup component of the pattern, which is then followed by a fast rise that reaches a high close to the asset’s price before the drop starts. The asset price strengthens for a brief while before breaking out in an upward direction to form the handle portion of the pattern.
The pattern has been used in technical analysis for decades, with its origins dating back to the early 20th century. William J. O’Neil published the first description of The Cup and Handle pattern in his influential book on technical analysis “How to Make Money in Stocks” published in 1988. William J. O’Neil was a well-known trader and founder of Investor’s Business Daily. Niel believed that this pattern has a huge advantage in identifying breakout points in bullish financial markets, including stocks, currencies, and commodities.
The biggest advantage of this pattern is that it is a strong bullish Indicator, especially when it is formed in longer time frames. The Cup and Handle pattern has a few disadvantages like it may test the patience of the investor, as it takes a longer time for formation and also it cannot be used under all the market conditions.
What Does Cup and Handle in Technical Analysis Mean?
The Cup And Handle Pattern is a technical analysis charting pattern that appears in financial markets, particularly in stock trading. It is a bullish pattern that indicates a potential trend reversal or continuation of an upward trend.

The cup and handle pattern gets its name from the distinct shape – a rounded bottom cup followed by a smaller handle formation. The cup resembles a “U” shape as prices curve into the trough. The handle then forms a slight downward drift. When prices break out above the handle’s resistance, the pattern is considered complete, signaling a potential bull run. This breakout point acts as the buy trigger for technicians.
While William O’Neil popularized the cup and handle in his writings, its origins remain uncertain. Traders were observing and utilizing the pattern long before O’Neil advocated its use. His book showcased it as part of his investment strategies. O’Neil also founded Investor’s Business Daily, which adopted the formation in its technical analysis offerings. So he is widely credited with bringing the cup and handle into mainstream use. However, its conceptual roots predate O’Neil’s work. The pattern was already part of the trader’s toolkit well before it gained broader recognition.
How to Identify a Cup and Handle Pattern?
The Cup and Handle Pattern are identified with the help of two fundamental components: the cup and the handle. The cup is formed after the price of the security declines before a similar increase in price. The increase in the price should be rounded and gradual, forming a U-shaped curve, and should not have any sharp V-shaped corners. The ideal cup shape has a smooth and even curvature, with the price reaching a high near the level where the decline began. The depth of the cup should be between 10% to 30% of the total pattern height.

The handle is formed after the formation of both ends of the cup. The price of the security suddenly drops forming a flag-like structure after forming the right side high of the cup. The height of the handle for this pattern does not exceed 1/3 of the total height of the pattern. The handle formed is followed by a breakout above its resistance level on increased volume.
The traders identify the candlestick pattern as a valid Cup and Handle Pattern when both these structures are present one after the other. A triangle, a sideways zone, or a reverse C are all possible shapes for the handle. The handle shouldn’t be deeper than 50% of the cup’s size for the formation to be considered legitimate. It is essential to note that the pattern’s time frame is crucial as this pattern takes a longer duration of time for formation. The Cup and Handle Patterns are best identified on a weekly or monthly chart to give them enough time to form.
The volume of assets being traded at a particular time is an important indicator when identifying the cup and handle pattern. The volume of assets traded should be maximum during the cup formation and it should decrease during the handle formation. This signifies that the traders are losing interest in selling, and the Cup and Handle Pattern is going to continue its bullish trend.
The Resistance Level is also used to identify this pattern. The resistance level is the price level at which the stock price was not able to break during the previous high. It is a strong indication that the bullish trend will continue when the stock breaks through the resistance level.
What are the Types of Cup and Handle Patterns?
There are three types of Cup and Handle Patterns, which are formed differently depending upon the market conditions. Following is a detailed description of these three types of cup & handle patterns.
1. Cup and Odd Handle
A version of the conventional handle with a more angular shape as opposed to a smooth, flat pattern is referred to as the “odd handle” in the Cup and Odd Handle pattern. This kind of handle can nonetheless indicate a regularity of the positive trend, even while it does not be as trustworthy as a conventional handle. It is viewed by some traders as a weaker signal than a typical cup and handle pattern.
2. Multi-Year Cup and Handle
The Multi-Year Cup and Handle stretches the standard cup and handle formation over a longer timeframe, often playing out over several years.
In this extended version, the initial cup represents a drawn-out period of accumulation forming the rounded bottom. The handle then develops as a more recent consolidation phase, retracing a portion of the prior cup’s gains.
The multi-year variety maintains the bullish implications of the classic pattern. The extended cup hints at long-term sustained buying interest by the smart money. The handle sets up for a highly-anticipated breakout, suggesting the uptrend resumption awaits.
3. Intraday Cup and Handle
The Intraday Cup and Handle condenses the standard cup and handle pattern into a single trading session. In this accelerated formation, the cup and handle take shape entirely within one day’s timeframe.
The cup may dominate the first half of the day, with the handle forming late in the session. When prices break upward out of the handle resistance, it triggers a buy entry for short-term traders.
Like the normal variety, Intraday Cup and Handle remain a bullish continuation signal pointing to a potential upside. Aggressive traders use it to capitalize on emerging intraday trends. However, no single indicator guarantees future movements. Wider context and additional confirmation are prudent when factoring these brief formations into trading decisions.
The Intraday Cup and Handle allows traders to implement the popular pattern for intraday opportunities. While the condensed timeline provides less reliable signals, it offers another tool for technically oriented traders to identify and react to potential low-risk entries during a single day’s trading. Managing risk is key when basing decisions on these accelerated intraday setups.
What are the Advantages of the Cup and Handle Pattern?
The Cup and Handle Pattern is a widely used chart pattern used in technical analysis because of its advantages as compared to any other indicator. Following are the top four advantages of The Cup and Handle Pattern.
Easy to identify. The Cup and Handle Pattern is easily identified by the traders irrespective of their past trading experiences. Traders quickly identify this pattern on the weekly or monthly chart making it a popular choice for traders who want to quickly identify bullish trends.
Risk management. The Cup and Handle Pattern helps traders identify the entry point in the trade. This helps traders easily manage the risk of unnecessary losses. Traders validate the pattern and place the trade with a set stop-loss level by watching for the breakthrough over the resistance level.
Volume confirmation. The formation of a Cup in the pattern is accompanied by a huge change in the volume of assets being traded. This provides additional confirmation about the validity of the pattern and indicates that traders are interested in buying the stock.
Long-term trend. The Cup and Handle pattern usually takes a huge amount of (several weeks or months) time to form, which indicates a long-term trend. This helps traders easily discover long-term trading opportunities.
The Cup and Handle pattern is a highly valuable technical analysis for traders who are looking for potential buying opportunities in the market. Traders manage their risk and potentially capitalize on the bullish trend, by identifying this pattern and the entry point during the trade.
What are the Disadvantages of the Cup and Handle Pattern?
The Cup and Handle pattern even after being a popular chart Pattern for technical analysis does have limitations that should be considered before making trading decisions. Following are the five most common disadvantages of the Cup and Handle Pattern.
Subjective Interpretation. The interpretation of the cup and handle pattern is subjective, and different traders identify this pattern differently. This leads to inconsistent results and confusion.
False Signals. The Cup and Handle pattern gives false signals, leading to traders entering into trades that don’t follow through. This is because the pattern is subjective and is interpreted differently by different traders.
Requires Experience. Some types of cup and handle patterns are complex and require a good amount of experience and expertise to identify accurately. It is challenging for inexperienced traders to differentiate between a valid Cup and Handle pattern and other similar patterns.
Time-consuming. The Cup and Handle pattern is time-consuming, as it requires traders to look at historical price data and charts to identify the pattern in the charts. It is challenging to identify the pattern in real-time trading situations and also the cup and handle pattern takes weeks or even months to form.
Market Risk. No trading strategy is foolproof as there is always a risk of loss involved in trading using the Cup and Handle pattern. Traders should have a solid understanding of risk management and market analysis before using the cup and handle pattern.
The Cup and Handle chart pattern is just like all the other patterns and has a few limitations that are rectified by taking appropriate safety measures like stopping loss and using volume indicators to confirm the buying signals given by the pattern.
When Should You Use Cups and Handles for Trading?
The Cup and Handle Pattern are used by traders to spot long-term investment opportunities in the security market. Traders use the Cup and Handle pattern when they see a stock’s price has formed a “U” shape, followed by a slight pullback forming a “handle” shape.
The Cup and Handle Pattern is a widely used technical analysis tool that serves two main purposes: to confirm trend continuation and to identify potential trend reversal.
To confirm the trend. This cup-and-handle continuation pattern in Nifty was created over nearly two years. The index experienced a breakout from the pattern and a gap higher, both of which indicated additional strength.
The distance from the top of the cup to the bottom, which is the minimum goal shown by a vertical blue line, was reached in less than a year. This is an example of a scenario where the market sentiment continues to be the same (bullish).

To find out Trend Reversal. A reversal pattern that just recently developed in the Dhampur Sugar market is yet another illustration of the Cup and Handle pattern.
It appears to be more of an ascending triangle breakout, and the stock experienced a strong surge in the weeks and days following the breakout. The minimum aim for this stock has not yet been met, but that change in the upcoming weeks. This is an example of a scenario where the market sentiment changes from bearish to bullish.

The Cup and Handle pattern is best used in combination with other technical indicators, such as moving averages or momentum indicators, to confirm the trend.
Traders should also be aware of the overall market conditions, chart patterns and news affecting the stock they are trading, as these factors impact the success of the Cup and Handle pattern.
How to Trade Cup and Handle Pattern?
Trading the Cup and Handle pattern involves identifying the pattern and then entering a trade when the breakout occurs. Following are the three major steps to trade using the Cup and Handle pattern.

Confirm a Cup and Trade Pattern. The first step in trading the Cup and Handle pattern is to identify and confirm the pattern. The Cup and Handle pattern is a bullish continuation pattern that occurs during an uptrend. It consists of a “cup” formation, followed by a “handle” formation. The cup formation is a rounded bottom that resembles a “U” shape, and the handle formation is a smaller consolidation period that follows the cup formation. Traders look for the following four characteristics to confirm the pattern.
- A cup formation that is at least 1.5 times as long as it is wide.
- A handle formation that is relatively shallow, with a downward slope of no more than 10-15%.
- Volume should be highest during the formation of the cup and taper off during the handle formation.
- The breakout from the handle formation should occur on a higher-than-average volume.
Traders are then able to consider potential trading opportunities, once the Cup and Handle pattern is identified and confirmed
Set Your Stop Loss. It Is important to set a stop loss, once traders have identified the Cup and Handle pattern and decided to enter a trade. A stop loss is an order that automatically closes the position if the price moves against the trader. The stop loss should be placed below the low of the handle formation, as a break below this level would indicate that the pattern has failed.
Set a Profitable Price to Exit. Traders should set a target price to exit the trade. This can be done by measuring the height of the cup formation and adding it to the breakout point of the handle formation. This gives you a price target that indicates how far the price is likely to move after the breakout. However, it is important to monitor the price action and adjust your target price accordingly if the market conditions change.
Traders should also consider other factors influencing the price such as market conditions, news, geopolitical issues and overall trend before entering a trade. Traders should always practice proper risk management and not risk more than they are willing to lose.
What are the Thoughts of Some Traders About the “V” Bottom Cup and Handle Pattern?
The “V” bottom variation of the cup and handle pattern generates mixed opinions among traders. In this formation, the cup shape forms a sharp “V” trough rather than a rounded “U” bottom.
Some technicians believe the angular V-shaped cup strengthens the bullish reversal signal. They argue it represents a decisive and rapid trend change, fueling stronger upside momentum.
However, other traders are more skeptical of the “V” bottom’s efficacy. They point out it is a less common variation that may not be widely recognized. Lower participation could limit the breakout potential.
A third camp sees the “V” bottom cup and handle as situationally useful, but only in certain volatile market environments. They contend it is better suited for fast-moving price action where sharp reversals occur.
What Is the Reversal Downtrend for Cup and Handle Pattern?
A failed breakout in the cup and handle pattern can lead to a reversal downtrend. Typically, after forming the rounded cup bottom and handle consolidation, prices should push upward out of the handle resistance. This confirms the bullish continuation as expected.
However, sometimes the anticipated upside breakout does not materialize. Instead, prices break down decisively below the lower portion of the cup. This signals a failure of the expected bull move. With the cup’s support now violated, it invalidates the bullish assumption.
When the cup and handle pattern breaks down rather than breaking out, technicians view it as a reversal sign. The price action reflects bearish sentiment overtaking bullish momentum. It usually leads to a downtrend as sellers take control after the failed breakout.
Instead of the buy trigger, the failed cup and handle converts to a sell signal. The downward move from the lower cup level confirms the suspected trend change. Price breaching key support levels typically leads to further declines. Identifying failed cup and handle patterns can allow traders to capitalize on emerging downtrends in the market.
A reversal downtrend in the Cup and Handle pattern indicates a change in the market sentiment from a bullish trend to a bearish trend. It suggests that the buyers were no longer interested in pushing the price of the securities higher and the bears have taken control pushing the price of the particular security lower. Traders see this as a sign to sell or go short on the asset, or to wait for a more clear trend to emerge before making any trading decisions.
Is a Cup and Handle Pattern Bullish?
Yes, The cup and handle pattern is inherently bullish in nature, signaling potential for higher prices once the formation completes. It typically takes weeks or months for the pattern to take shape. Technicians watch for this popular indicator to identify buying opportunities in anticipation of an uptrend.
The structure begins with prices dropping to form the cup’s rounded bottom, giving the “U” shape. This demonstrates uncertainty in the market as bearish forces weaken. The handle then emerges as a smaller downtrend, representing consolidation.
Does the Cup and Handle Pattern Only Resembles the “U” Pattern?”
No, the cup and handle formation is more complex than a simple “U” shape. While the cup portion creates a rounded bottom, the defining feature is the handle that forms afterward.
The handle emerges as a consolidation period following the cup. It exhibits a slight downward drift or sideways price action. This pause forms the metaphorical handle shape after the cup is carved out.
The presence of the handle differentiation is vital. Without it, the pattern would resemble just a “U” bottom lacking the necessary consolidation. The handle represents a key test of the emerging support before a breakout can materialize.
For technicians, the cup and handle only provides a bullish continuation signal when the handle forms with lower volume and prices subsequently break out above the handle’s resistance.
Is Cup and Handle Pattern Considered a Bullish Signal?
Yes, in technical analysis, the cup and handle pattern is typically regarded as a bullish signal. A U-shaped “cup” and a smaller, downward-sloping “handle” that produces a consolidation period make up the design. The consolidation phase is sometimes viewed as a break in the rising trend, allowing the stock to gather momentum for its upcoming ascent.
Strong volume and price action necessary for the stock to break out of the handle formation is considered a sign that the bullish trend is being confirmed. The height of the cup formation is frequently used by traders and investors to estimate the possible price goal for the stock if it breaks out of the handle.
Should the Trader Place their Stop Buy Above the Trendline of the Handle Pattern?
An order to buy an asset at a set price above the going market price, often referred to as a stop-buy order or a trendline order, is given by a trader to their broker.
A stop-buy or trendline order is designed to be used when the price of a security breaches a resistance level or a trendline, signaling the beginning of a prospective upswing and indicating the entry into a long position.


 Previous Article


![15 Investing.com Alternatives [Free+Paid] You Should Use in 2026](https://www.strike.money/wp-content/uploads/2026/04/Investing.com-Alternatives.jpg "15 Investing.com Alternatives [Free+Paid] You Should Use in 2026 64")
![15 TradeStation Alternatives [Free+Paid] You Should Use in 2026](https://www.strike.money/wp-content/uploads/2026/04/TradeStation-Alternatives.jpg "15 TradeStation Alternatives [Free+Paid] You Should Use in 2026 65")
![15 Chartink Alternatives [Free+Paid] You Should Use in 2026](https://www.strike.money/wp-content/uploads/2026/04/Chartlink-Alternatives.jpg "15 Chartink Alternatives [Free+Paid] You Should Use in 2026 66")
: Overview, 10 Types of Indicators, Settings for Different Markets 68")

 : Definition, Formula, calculation, Uses, Advantages Vs limitations 70")


: How We Used This 70/30 Indicator in 6 High Win-rate Strategies 73")


No Comments Yet.