A volatility smile in options trading is a U-shaped curve showing higher implied volatility (IV) for deep in-the-money (ITM) and out-of-the-money (OTM) options compared to at-the-money (ATM) options. A volatility smile occurs due to market deviations from Black-Scholes assumptions, driven by demand for protection against rare events (e.g., OTM puts for crash hedging).
The smile impacts option pricing, with OTM options often trading at a premium due to higher perceived risk. Traders leverage it by identifying mispriced options, using strategies like strangles or butterflies. Tools like IV charts, volatility surfaces, and analytics platforms help analyze and capitalize on the smile effectively.
What Is a Volatility Smile in Options Trading?
A volatility smile in options trading is the tendency for both deep in-the-money and out-of-the-money options to have higher implied volatility than at-the-money options for the same expiry. A volatility smile pattern becomes clear when plotting implied volatility against strike prices, creating a distinct “smile” shape on the chart.

In practical terms, consider an underlying asset trading at Rs. 100. Options with strike prices much lower or higher than Rs. 100 (deep ITM or OTM) will usually show higher implied volatility than those close to Rs. 100 (ATM). This is not what traditional models like Black-Scholes predict, as those assume implied volatility is constant across all strikes for a given expiry.
The volatility smile reflects real-world market behavior and risk perception. Traders and investors recognize that markets are not perfectly efficient or normally distributed, and extreme price moves are more likely than a simple model suggests. In fact, after major market crashes, the smile often becomes more pronounced as demand for insurance through OTM puts spikes.
How Is a Volatility Smile Represented?
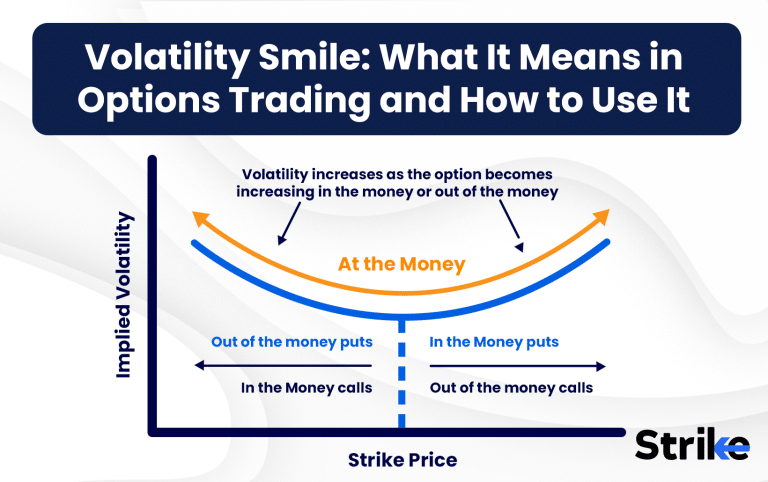
A volatility smile is represented as a U-shaped curve with implied volatility on the Y-axis and strike prices on the X-axis, typically for a single expiry. The lowest point of the curve corresponds to at-the-money (ATM) options, while both in-the-money (ITM) and out-of-the-money (OTM) options appear at the ‘wings’ with higher implied volatility.
For example, if the current price of a stock is Rs. 500, the X-axis will show strike prices ranging above and below Rs. 500, while the Y-axis plots the implied volatility for each strike. The curve dips at the ATM strike and rises on either side, indicating higher “insurance cost” for those farther-from-the-money contracts. This pattern is especially visible in charts provided by trading platforms or in custom plots using Excel or Python.

ATM options, being closest to the actual price, usually have the lowest implied volatility because uncertainty is lower. OTM options, both puts and calls, show higher IV as they reflect the market’s fear of large, unexpected movements in either direction. In some cases, the right side of the curve (OTM calls) can be higher, especially in bullish markets, but usually both ends rise.
Why Does a Volatility Smile Occur?
A volatility smile occurs because real-world markets deviate from Black-Scholes assumptions, with increased demand for options as protection against rare or extreme events. One major reason is that actual asset returns are not perfectly normally distributed; instead, they exhibit “fat tails,” meaning extreme moves happen more often than models predict.
For example, investors frequently buy deep OTM puts as insurance against market crashes, driving up their price and implied volatility. During periods of market stress, such as a sudden drop in the Nifty 50, OTM puts can see their IV spike by 30-50% compared to ATM options. This heightened demand reflects the market’s desire to hedge against catastrophic losses, a behavior not captured by standard models.
Another contributor is volatility clustering, where periods of high volatility tend to be followed by more high volatility. This makes the market price in the chance that another big move is coming, especially in the wings of the distribution. Skewed return distributions, where losses are more severe or frequent than gains, also push up the demand for puts.
What Is the Difference Between Volatility Smile and Volatility Skew?
The volatility smile is a symmetrical U-shaped implied volatility curve, while volatility skew is an asymmetrical curve with one side (usually OTM puts) showing higher implied volatility than the other.
| Aspect | Volatility Smile | Volatility Skew |
| Definition | U-shaped pattern in implied volatility vs. strike prices. Both OTM puts and calls have higher IV than ATM options. | Asymmetrical pattern where IV is higher for one side (usually OTM puts) compared to the other. The curve is slanted rather than U-shaped. |
| Typical Shape | Symmetrical U-shape. Lowest IV at ATM, rising at both ITM and OTM strikes. | Skewed or “smirk” shape. IV rises more on one side (typically the left, with OTM puts) than the other. |
| Common Markets | Frequently seen in currency and commodity options, where risk of major moves in both directions exists. | Common in equity and index options, especially stocks and indices like Nifty or S&P 500. |
| Market Sentiment Reflected | Indicates the market is pricing in risk for both extreme up and down moves. | Indicates more concern for one direction (usually downside risk, i.e., market crashes). |
| Cause | Demand for both crash protection (OTM puts) and upside speculation (OTM calls); real-world deviations from normal distribution. | Demand for downside protection (OTM puts) outweighs demand for upside; reflects crash risk, leverage, or hedging pressure. |
| IV for OTM Puts | High (similar to OTM calls) | Highest among all strikes |
| IV for ATM Options | Lowest point on curve | Moderate; not necessarily lowest |
| IV for OTM Calls | High (similar to OTM puts) | Lower than OTM puts, sometimes similar to ATM or slightly higher |
| When Observed | Often after significant market events or in markets with two-sided tail risks. | Normally in equity markets, especially during times of uncertainty or bearish sentiment. |
| Trading Strategies Affected | Straddles, strangles, butterflies, ratio spreads | Vertical spreads, risk reversals, protective puts, covered calls |
| Key Takeaway | Smile = symmetric tail risk pricing in both directions. | Skew = asymmetric risk pricing, usually more fear of downside. |
The choice between trading in a smile or skew environment depends on market outlook, strategy, and risk tolerance.
What Are the Trading Implications of a Volatility Smile?
The volatility smile affects how options are priced and can result in out-of-the-money options being relatively expensive or cheap compared to standard models. This means traders need to be careful when buying or selling OTM options, as their premiums reflect higher perceived risk.
A pronounced volatility smile often signals that the market is worried about extreme events, such as a sudden crash or rally. If you buy an OTM option when the smile is steep, you might pay a significant premium—sometimes Rs. 20-50 more per contract—relative to fair value. Conversely, if you sell these options, you collect that premium but take on more risk if a rare event occurs.
The smile also helps traders spot mispricings. If a particular strike trades at an unusually high IV compared to historical levels, there might be an opportunity to sell it and hedge elsewhere. Strategies like strangles or butterflies, which involve multiple strikes, are directly impacted by the smile, as profits depend on the relative pricing of each leg.
Market sentiment is often revealed by the shape of the smile. A rising left side (OTM puts) usually indicates fear, while a rising right side (OTM calls) can signal bullish speculation. By monitoring changes in the smile, traders gain insight into underlying market psychology and can tailor their strategies accordingly.
How to Use Volatility Smile in Options Trading Strategies
A volatility smile is observed when the implied volatility (IV) of out-of-the-money (OTM) and in-the-money (ITM) options is significantly higher than that of at-the-money (ATM) options. When plotted on a chart, this difference in IV levels creates a characteristic smile-like curve—hence the name volatility smile.

In the chart provided above for Asian Paints Ltd, the IV of all available strike prices is represented. The center of the graph corresponds to the IV of the ATM options. A dip in the middle, with higher IVs on either side (OTM and ITM), forms the visual smile pattern. This pattern indicates that both deep calls and deep puts are relatively expensive in terms of implied volatility.
To capitalize on this setup, traders can sell options with high IV (typically OTM or ITM options) and buy options with lower IV (typically ATM options). The goal is to collect premium from overpriced options and hedge the position with cheaper ATM options.
A suitable strategy for such a scenario is the Reverse Iron Fly, which can be implemented on Asian Paints. The strategy involves selling a deep OTM call and a deep OTM put—both of which are trading at higher implied volatility—and buying an ATM call and ATM put, which are relatively cheaper.
Strategy Setup for Asian Paints (Lot Size: 200)
- Sell 1 lot of 2380 CE at ₹21.85 (OTM Call with high IV)
- Sell 1 lot of 2180 PE at ₹21.55 (OTM Put with high IV)
- Buy 1 lot of 2280 CE at ₹57.70 (ATM Call with low IV)
- Buy 1 lot of 2280 PE at ₹56.20 (ATM Put with low IV)

Net Premium Paid
Net premium per share = (₹57.70 + ₹56.20) − (₹21.85 + ₹21.55) = ₹70.50
Total premium paid = ₹70.50 × 200 = ₹14,100
Maximum Profit Calculation
Maximum profit = (Spread Width × Lot Size) − Net Premium Paid
Spread width = 100 points
Max profit = (100 × 200) − ₹14,100 = ₹20,000 − ₹14,100 = ₹5,900
Maximum Loss
Maximum loss = Net Premium Paid = ₹14,100
Breakeven Points
Breakeven range = ATM Strike ± (Net Premium Paid / Lot Size)
= 2280 ± (₹14,100 / 200) = 2280 ± ₹70.50
Breakevens = 2210 and 2350
With 38 days remaining until expiry, this strategy profits if the stock closes outside the breakeven range. It benefits from increased volatility but requires the price to move significantly in either direction, away from the center strike of 2280.
How to Profit from Volatility Smile?
Profit from the volatility smile by identifying mispriced options and executing strategies that benefit as implied volatility normalizes or moves in your favor. For instance, selling expensive OTM options when the smile is steep can generate higher premiums, especially if actual market volatility remains moderate.
If you notice OTM puts on a stock trading at a 40% IV while ATM options are at 20%, selling those puts (perhaps as part of a spread) lets you collect the extra premium. If the market does not crash, you keep the difference, which could be Rs. 10-50 per contract depending on the underlying and lot size. Conversely, if the smile flattens due to changing sentiment, OTM IV drops, and your position gains value.
On the other side, buying undervalued ATM options during periods of low IV and selling OTM options with inflated IV can offer a good risk-reward profile. Straddles, strangles, or butterflies constructed with careful attention to the IV curve increase the odds of success.
Pro traders continuously monitor the smile, adjusting trades as IV changes. By profiting from temporary distortions in implied volatility, they enhance returns and manage risk. The key is disciplined analysis and execution, rather than relying on gut feel.
How Is Volatility Smile Related to Implied Volatility and Option Pricing?
The volatility smile shows how implied volatility varies across strike prices, directly influencing option pricing and risk exposure (Greeks). Implied volatility is the market’s consensus estimate of future volatility, but the smile reveals that this estimate is not uniform for all strikes.
As a result, the value of Vega (sensitivity to volatility changes) and Delta (sensitivity to price changes) also varies along the smile. For example, OTM options with higher IV command higher premiums, which affects the payoff and risk profile of various strategies. A trader selling OTM options when IV is elevated could see gains if volatility doesn’t materialize as expected.
Advanced option pricing models, such as local volatility or stochastic volatility models, have been developed to better fit real-world smiles. These models adjust for the changing IV across strikes and provide more accurate pricing than Black-Scholes, especially for risk management purposes.
For traders, recognizing the smile’s impact on both price and Greeks is vital for effective hedging and portfolio construction. It ensures that risk is measured and managed realistically, not just theoretically.
What Are the Limitations of Black-Scholes Related to Volatility Smile?
The Black-Scholes model assumes constant volatility, which fails to reflect the volatility smile and leads to inaccurate pricing, especially for OTM options. In practice, this limitation causes OTM options to be underpriced by the model, as it does not account for increased demand for crash protection.
For example, during market turmoil, actual implied volatility for OTM puts can reach 40-60%, while Black-Scholes might suggest only 25%. This creates pricing errors of Rs. 10-40 per contract, depending on the underlying. The model also underestimates tail risk, ignoring the real-world frequency of extreme events.
To address these issues, more dynamic models like Heston or SABR have been adopted. These incorporate changing volatility and better fit observed market prices and implied volatility surfaces. Even so, no model is perfect, but understanding these limitations ensures traders do not blindly trust theoretical prices.
Recognizing that Black-Scholes is a starting point, not an end point, is crucial for modern options trading. This awareness helps avoid costly mistakes and encourages the use of real market data for decision-making.
What Tools Can You Use to Analyze Volatility Smile?
Traders analyze the volatility smile using implied volatility curves, volatility surface charts, and specialized options analytics software. Most trading platforms now provide IV charts for each expiry, making it easy to spot the smile in real time.
For a deeper dive, volatility surfaces display IV across strikes and expiries in a 3D format. This gives a comprehensive view of how IV changes not just across strikes but also over time. Tools like Excel or Python can be used to download option chain data and build custom IV charts, enabling traders to analyze patterns and spot mispricing.
Professional traders often use advanced analytics platforms like Strike Money that provide real-time IV data, historical analysis, and scenario testing. These tools allow for more precise risk management and strategy construction, especially in volatile markets. By regularly monitoring the volatility smile, traders can stay ahead of market moves and improve their chances of success.


 Previous Article


![15 Investing.com Alternatives [Free+Paid] You Should Use in 2026](https://www.strike.money/wp-content/uploads/2026/04/Investing.com-Alternatives.jpg "15 Investing.com Alternatives [Free+Paid] You Should Use in 2026 20")
![15 TradeStation Alternatives [Free+Paid] You Should Use in 2026](https://www.strike.money/wp-content/uploads/2026/04/TradeStation-Alternatives.jpg "15 TradeStation Alternatives [Free+Paid] You Should Use in 2026 21")
![15 Chartink Alternatives [Free+Paid] You Should Use in 2026](https://www.strike.money/wp-content/uploads/2026/04/Chartlink-Alternatives.jpg "15 Chartink Alternatives [Free+Paid] You Should Use in 2026 22")
: Overview, 10 Types of Indicators, Settings for Different Markets 24")

 : Definition, Formula, calculation, Uses, Advantages Vs limitations 26")


No Comments Yet.