The rising three candlestick pattern is a price chart formation that signifies a continuation of the bullish trend. The rising three candlestick pattern occurs in the middle of an ongoing bullish trend, which resumes at the end of the pattern. The rising three candlestick pattern comprises five candlesticks, including a bullish candlestick with a large body, three consecutive bearish candlesticks and a final bullish candlestick that breaks the high of the first candlestick and closes above it. The fifth and final candlestick of the rising three candlestick pattern is considered the decisive candlestick of the pattern as it indicates that the bulls are back in control of the market.
Traders usually enter trading positions at the close of the fifth bar of the pattern. Some traders also prefer to make a trade entry when the fifth candlestick crosses the high of the first candlestick. Traders who prefer more aggressive trading strategies utilize stop-loss orders to minimize their risk of losses.
The two main advantages of the rising three candlestick pattern include its reliability in predicting short-term price movements and ease of identification. The two main disadvantages of the pattern are the existence of different variations to the pattern and the difficulty of managing risk while using it.
What is a Rising Three Candlestick?
A rising three candlestick is a bullish trend continuation pattern. A rising three candlestick pattern forms on a price chart when there is a pause in an ongoing bullish trend. The bullish trend resumes at the end of the rising three candlestick pattern formation. The most common characteristic of the rising three candlestick pattern is the formation of three bearish candlesticks within an ongoing bullish trend.
The bearish candlesticks reflect the struggle between the bulls and the bears, wherein the bears try hard to drag the prices lower. The fifth and final bullish candlestick indicates that the bears were unsuccessful in reversing the trend and that the bulls have regained control over the market again. The rising three candlestick signals the resumption of the bullish trend, which is helpful to assess the strength of the bearish trend.
How useful is Rising Three Candlestick?
The rising three candlestick pattern is very useful in helping investors and traders determine whether the ongoing bullish trend will be reversed or resumed. The rising three candlesticks aid investors and traders in assessing the strength of the bullish trend. The bullish trend is considered strong when the bears are unable to reverse the trend and the bulls gain control of the market after the short-lived pause.
How Does the Rising Three Candlestick Pattern Structure?

The structure of the rising three candlestick pattern comprises five candlesticks. The image below shows the structure of the rising three candlestick pattern.
The first candlestick of the rising three candlestick pattern is a large bullish candlestick, and it is a part of the ongoing uptrend. The next three candlesticks tend to be bearish candlesticks, with their bodies contained within the body of the first candlestick. The three bearish candlesticks trade at prices higher than the low of the first candlestick but lower than its high.
The fifth and final candlestick of the pattern is a large bullish candlestick whose high breaks the high of the first candlestick. The fifth candlestick also closes at a price higher than that of the first.
How Many Days Does Rising Three Patterns Take to Develop on A Daily Chart?
The rising three candlestick patterns form over the span of five days on a daily chart. The rising three candlestick pattern comprises five candlesticks in total, and each of its candlesticks takes one day to form.
When do Rising Three Candlestick Patterns happen?
A rising three candlestick pattern occurs in the middle of a bullish trend. The rising three candlestick pattern indicates a pause in the bullish trend when the bears or sellers attempt to drag the prices lower. The bullish trend resumes at the end of the rising three candlestick pattern formation.
How to Identify Rising Three Candlestick Patterns in Technical Analysis?
The rising three candlestick patterns is identified using three main steps. The image below explains the three main parts of the pattern and the specific rules concerning each part.

- Spotting a large bullish candlestick
The first step in identifying a rising three candlestick pattern is spotting a large bullish candlestick. The bullish candlestick must be part of an ongoing uptrend, and it must have a large body, as the image above shows.
- Spotting three consecutive bearish candlesticks
The second step in identifying a rising three candlestick pattern is to spot three consecutive bearish candlesticks. All three bearish candlesticks must be contained within the body of the first bullish candlestick. The image above shows that the three bearish candlesticks lie within the body of the first bullish candlestick. The three bearish candlesticks trade at prices higher than the low of the first candlestick but lower than the high of the first candlestick.
- Spotting the fifth bullish candlestick
The third step in identifying a rising three candlestick pattern is to spot the last and final bullish candlestick. The last bullish candlestick must have a large body that breaks the high of the first candlestick and closes above its close. The image above also indicates that the last candlestick must break the first bearish candlestick open to be considered a valid rising three candlestick pattern.
Investors and traders must pay close attention to all three steps while identifying the rising three candlestick pattern, as each step plays a crucial role in contributing to the pattern and the signal it indicates.
The rising three candlestick pattern is a longer pattern compared to most patterns in technical analysis, and it hence requires more patience when identifying it. It is also possible for the rising three candlestick pattern to have a combination of small bullish and bearish candlesticks in the three candlesticks formed between the two large-bodied bullish candlesticks.
How accurate are Rising Three Candlestick Patterns?
The accuracy of the rising three candlestick pattern is considered good only when it is used along with other technical indicators. Rising three candlestick patterns do often produce false signals, and so they are not considered reliable to be used in isolation.
Investors and traders must ideally use the rising three candlestick patterns to make trading decisions only after confirming the trends with other technical indicators such as Moving Average or the Moving Average Convergence Divergence (MACD).
Can you improve the Rising Three Candlestick accuracy?
Yes, the accuracy of the rising three candlestick pattern can be improved by using it along with other technical indicators like the Moving Averages or the MACD. Investors and traders can confirm the signals produced by the rising three candlestick pattern using other technical indicators and act on its signals only if the signals produced by the two points to the same upcoming trend.
How to Trade using the Rising Three Candlestick Pattern?
There are five main steps to follow while trading with the rising three candlestick pattern. The most important aspect that investors and traders should pay attention to is the proper identification of the pattern on a stock price chart. The five main steps to be followed while trading with the rising three candlestick patterns are listed below.
- Analysing the ongoing market trend
The first step to trading using the rising three candlestick pattern is to analyse the market situation and market trends. The rising three candlestick pattern occurs during an ongoing uptrend, and investors and traders should watch out for the pattern in situations where the security price shows a steady increase. The image below indicates what a price chart looks like prior to the formation of a rising three candlesticks pattern.
The image shows that the rising three candlestick pattern appears during a steady and prolonged uptrend.
- Identifying the rising three candlestick pattern
The second step to trading using the rising three candlestick pattern is to identify the rising three candlestick pattern. The rising three candlestick pattern comprises a strong bullish candlestick, three bearish candlesticks with small bodies that trade below the high and above the law of the previous candlestick, and a final strong bullish candlestick that breaks the high of the first candlestick and closes above it. The image below shows what a rising three candlestick pattern looks like.
- Confirming the pattern
The third step in trading with the rising three candlestick pattern is confirming the pattern. Investors and traders must use other technical indicators like the Moving Averages or the MACD to ensure that the rising three candlestick pattern signals are in line with those from the alternate technical indicators.
- Deciding the trade entry position
The fourth step to trading using the rising three candlestick pattern is to decide the trade entry position. Traders can enter trading positions at the close of the fifth bar of the pattern. Traders also often prefer to make a trade entry when the fifth candlestick crosses the high of the first candlestick. The position of the trade entry depends on the risk appetite of the traders and the type of trading strategies they prefer. Traders who prefer more aggressive trading strategies often utilise stop-loss orders to minimise their risk of losses. The image below shows the entry point that most traders prefer to make while trading with the rising three candlestick pattern.
- Utilising a stop-loss
The final step to trading with the rising three candlestick pattern is to utilise a stop-loss order. A stop-loss is an order to automatically sell securities when the price reaches a certain level. Stop-loss prevents high losses. Traders place stop-loss orders depending on their trading strategies. Aggressive traders place stop-loss orders at higher prices, such as below the fifth candlestick, whereas a conservative trader will choose to place them at a lower price point, such as right below the first candlestick. The image below indicates the different price points where aggressive and conservative traders prefer to place their stop-loss orders.
Investors and traders can easily trade any security using the rising three candlestick pattern with the help of these five steps. The exit trade positions are decided upon by the individual traders. Traders can have profit targets at any profit percentage of their choice. Investors and traders commonly sell the stocks at a profit at the next resistance level, making the next resistance level the profit target.
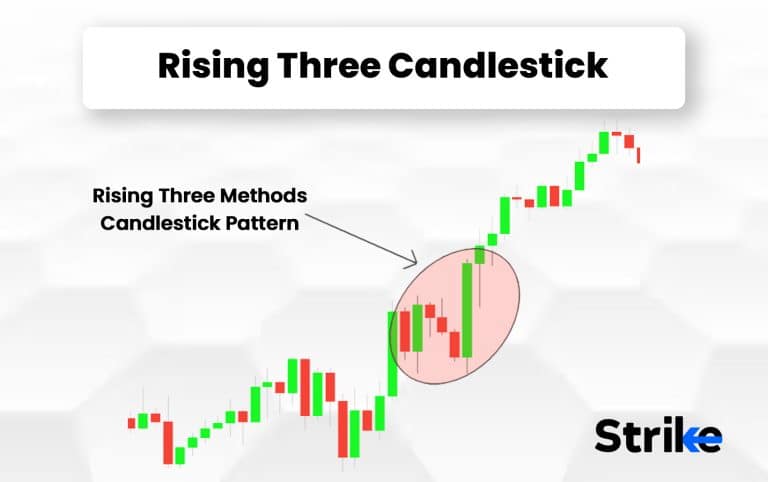
What are Examples of Rising Three Candlestick Patterns?
The pattern occurs in the middle of an ongoing uptrend. The red box indicates the rising three candlestick pattern. The pattern begins with a large bullish candlestick. There are three bearish candlesticks following the bullish candlestick.
The fifth and final bullish candlestick breaks the high of the first bullish candlestick of the pattern. The trade entry is made above the high of the fifth candlestick. The stop-loss for this particular example is placed at the low of the first candlestick, and the profit target is kept at the next resistance level.
What Indicator is Best to Trade with the Rising Three Candlestick Pattern?
The best indicators to use with the rising three candlestick patterns are Moving Averages or the Moving Average Convergence Divergence (MACD). Moving Averages and Moving Average Convergence Divergence (MACD) indicate whether the chosen security is in an uptrend or a downtrend.
Investors and traders can thus cross-check the signals from the rising three candlestick patterns with those from these technical indicators before making trading decisions. Investors and traders also use Bolinger bands with the rising three candlestick pattern.
Can you trade Rising Three Candlestick Patterns with Bollinger Bands?
Yes, the rising three candlestick pattern is traded with Bollinger bands. Bollinger bands are technical indicators that indicate overbought and oversold levels, making it easy for investors and traders to crosscheck the Bollinger Band signals with the rising three candlestick pattern to confirm the trend continuation.
What are the benefits of the Rising Three Candlestick Pattern?
There are primarily two main advantages of using the rising three candlestick pattern. The advantages largely stem from the strong correlation that the appearance of the pattern shares with the possibility of trend continual. The two advantages are listed in detail below.
- The reliability of predicting the chances of the trend continual
The three rising candlestick pattern is considered a reliable indicator of the chances of the bullish uptrend resuming. The appearance of the pattern has a strong correlation with the probability of the bullish trend picking up and continuing.
- The ease of identification
The rising three candlestick pattern is also easy to identify for traders. The five-candlestick structure of the pattern is distinct and is easily spotted on a price chart.
Investors and traders must ideally use other technical indicators to confirm the rising three candlestick pattern before making trading decisions. Investors and traders can avoid incurring losses if they confirm the pattern using alternate technical indicators.
What are the limitations of the Rising Three Candlestick Pattern?
There are mainly two disadvantages to the rising three candlesticks pattern including the existence of different variations to the pattern and the difficulty in managing risk while using this pattern. The two disadvantages are listed in detail below.
- The existence of variations
One of the main disadvantages of the rising three candlestick pattern is the presence of variations in the pattern. The three bearish candlesticks that form between the two large bullish candlesticks can sometimes be small bullish candlesticks as well, making it slightly confusing for investors and traders.
- The difficulty in managing risk
Another main disadvantage of the rising three candlestick pattern is the difficulty of managing risk with the pattern. The pattern has a tendency to produce false signals, which can lead to traders losing money. Investors and traders must ideally use stop-loss orders to prevent incurring losses and manage risk well.
Investors and traders can use alternate technical indicators along with the rising three candlestick pattern to make up for its disadvantages. The Moving Averages and MACD work especially well with the candlestick pattern and help investors and traders prevent losses.
Is Rising Three Candlestick Profitable?
Yes, the rising three candlestick pattern is a profitable pattern when used in combination with other technical indicators. The reliability of the pattern increases when it is used with other technical indicators, which can help confirm the rising three candlestick pattern signals.
Are Rising Three Candlesticks Enough for Trading?
No, the rising three candlestick pattern is not enough for trading if it is used in isolation. Other technical indicators, such as Moving Averages and MACD or Bollinger Bands, must be used with it to confirm the pattern before making trading decisions.
Is Rising Three Bearish?
No, the rising three patterns are not bearish. The rising three candlestick patterns are bullish trend continuation indicators that occur during an ongoing bullish trend. The rising three candlestick pattern signifies the resumption of the bullish trend.
What is the Most Powerful Triple Candlestick Pattern aside from Rising Three?
The morning star, the morning star doji, the bullish abandoned baby, the three white soldiers, the three inside up, and the three outside up are all other powerful triple candlestick patterns. The triple candlestick patterns are key predictors of how the active market trend is going to behave next, and investors and traders can use them to plan their investment and trading strategies.
What is the difference between Rising Three Candlestick and Falling Three Candlestick?
The two main differences between the falling three candlestick pattern and the rising three candlestick pattern are listed in the table below.
| Rising Three Candlesticks | Falling Three Candlesticks |
| It is a bullish trend continuation indicator. | It is a bearish trend continuation indicator. |
| It comprises two large-bodied bullish candlesticks with three small bearish candlesticks in between. | It comprises two large-bodied bearish candlesticks with three small bullish candlesticks in between. |


 Previous Article


![15 Investing.com Alternatives [Free+Paid] You Should Use in 2026](https://www.strike.money/wp-content/uploads/2026/04/Investing.com-Alternatives.jpg "15 Investing.com Alternatives [Free+Paid] You Should Use in 2026 16")
![15 TradeStation Alternatives [Free+Paid] You Should Use in 2026](https://www.strike.money/wp-content/uploads/2026/04/TradeStation-Alternatives.jpg "15 TradeStation Alternatives [Free+Paid] You Should Use in 2026 17")
![15 Chartink Alternatives [Free+Paid] You Should Use in 2026](https://www.strike.money/wp-content/uploads/2026/04/Chartlink-Alternatives.jpg "15 Chartink Alternatives [Free+Paid] You Should Use in 2026 18")
: Overview, 10 Types of Indicators, Settings for Different Markets 20")

 : Definition, Formula, calculation, Uses, Advantages Vs limitations 22")


: How We Used This 70/30 Indicator in 6 High Win-rate Strategies 26")


No Comments Yet.