The Money Flow Index (MFI) is a technical analysis indicator used to measure the strength and potential reversals in price movements of a security. The MFI offers perceptions of the money movement into or out of a specific asset. The MFI integrates volume and price data to evaluate if buying or selling pressure is dominating the market. Traders and investors can learn a lot about market sentiment and potential changes in trends by monitoring the money flow.
The Money Flow Indicator is based on the idea that an increase in positive money flow over a specific period represents buying pressure, whereas an increase in negative money flow over that same period shows selling pressure. The typical price, which is the average of the high, low, and closing prices, and the volume traded during that time are used to compute the MFI. The money ratio is then determined by contrasting the positive and negative money flows. The MFI is then calculated by scaling this ratio from 0 to 100.
The Money Flow Index Indicator is used by traders and investors to spot overbought and oversold conditions in an investment. Security is often overbought and is due for a market correction if the MFI score is above 80. A MFI number below 20, on the other hand, implies that the asset is oversold and will undergo a rebound. The MFI is frequently combined with other technical indicators to validate trading signals and help traders decide more wisely.
Determine the usual price, calculate the raw money flow, calculate the money ratio by comparing the positive and negative money flows, and then use a scaling procedure to convert the money ratio to the Money Flow Index for calculating MFI.
What is the meaning of the Money Flow Index?
The Money Flow Index (MFI) is an indicator used to measure the direction of money flowing into or out of the market. The Money Flow Index (MFI) provides valuable information about the buying and selling pressures behind the observable price movements. The MFI considers both price and volume data to evaluate the flow of funds and identify probable overbought or oversold conditions in an investment.The RSI only considers price to evaluate the market sentiments, this is the main difference between MFI and RSI.
Traders and investors can better comprehend market sentiments and spot potential trend reversals by analysing the MFI. An MFI rating above a predetermined threshold denotes overbought market conditions and the potential for a downward correction in the security. An MFI rating below a predetermined cutoff point in contrast, denotes oversold conditions and indicates a probable upward bounce.
The MFI is highly useful in assessing the strength and feasibility of pricing trends. It supports traders and investors in evaluating market dynamics, validating trading signals, and figuring out when to enter and exit the market at the most advantageous periods. Market participants should better understand market sentiment and create more effective trading strategies by incorporating the Money Flow Index into their calculations.
What is MFI?
MFI stands for Money Flow Index. The Money Flow Index is calculated by analysing both price and volume data to assess the flow of funds and determine potential overbought or oversold conditions.
The term “MFI,” is a widely recognized abbreviation used by traders and analysts to refer to the Money Flow Index. Traders use abbreviations and acronyms to streamline communication and save time, so MFI is the preferred shorter version when discussing this specific indicator.
MFI technical indicator evaluates money flow, volume, and price to gauge market sentiment and probable changes in price trends. “MFI” is a convenient and well-known name in the financial sector, traders and analysts frequently use it to refer to this indicator.
How does the Money Flow Index (MFI) function?
The Money Flow Index (MFI) is a momentum indicator that functions by measuring the flow of money into or out of a security or market. The Relative Strength Index (RSI), which also measures market momentum and overbought/oversold circumstances, and the Money Flow Index (MFI) have many similarities. The MFI integrates volume data to offer additional insights into the money flow behind price swings, whereas the RSI only considers price changes.
: Definition, How it Works, Uses, and Calculations 11")
The MFI provides a more thorough evaluation of market sentiment and probable reversals, acting as an extension of the RSI in this way. The Money Flow Index, in contrast to conventional oscillators like the Relative Strength Index (RSI), integrates both price and volume data rather than just price. This is the reason why analysts refer to the MFI as the volume-weighted RSI.
The idea of positive and negative money flow serves as the foundation for MFI operations. Positive money flow is the accumulation of funds during that time when the average price (high, low, and closing prices) is higher than it was during the prior period. Negative money flow depicts the accumulation of cash when the typical price is lower than the normal price of the preceding period.
There is a simple process for the MFI calculation. First, the average of the high, low, and closing prices for each period is used to get the typical price. The typical price is multiplied by the volume traded over that period to determine the raw money flow. The positive and negative money flows are then determined by summing up the raw money flows for the respective periods.
The money ratio is calculated by dividing the positive money flow by the negative money flow. A value greater than 1 suggests more positive money flow, and a value lower than 1 suggests more negative money flow. This ratio represents the relative strength of the money flow.
The money ratio is converted into a scale from 0 to 100 to create the Money Flow Index. It then becomes simpler to compare and analyse data because of this scale. Stronger buying pressure is indicated by a higher MFI value, whereas stronger selling pressure is indicated by a lower MFI value.
Why is the Money Flow Index (MFI) important?
The Money Flow Index is important as it helps to provide critical information about buying and selling pressure, identifies overbought and oversold conditions, confirms trading signals, and also improves trading strategies. The Money Flow Index (MFI) is important because of the five reasons mentioned below.
- Assessing Buying and Selling Pressure: The MFI aids traders and investors in determining the volume and movement of capital into or out of a security or market. Market participants gain insight into market sentiment by analysing the MFI to comprehend the purchasing and selling pressure that drives price changes.
- Identifying Overbought and Oversold Conditions: A security or market’s potential overbought or oversold circumstances are detected using the MFI. An MFI rating beyond a predetermined level, often 80, denotes overbought conditions and indicates that a market correction is overdue. An MFI rating below a predetermined cutoff point, usually 20, which denotes oversold conditions, indicates a probable upward bounce. Having this knowledge enables traders to foresee probable price reversals.
- Confirming Trading Signals: The MFI is frequently employed in combination with other technical indicators, to confirm trade indications. A potential trend reversal is indicated, for instance, by a security that exhibits a bearish divergence, where the price is reaching higher highs but the MFI is making lower highs. Traders can improve the accuracy of their trading selections by combining the MFI with additional indicators.
- Enhancing Trading Strategies: Trading strategies that use the MFI provide traders with a more thorough grasp of market dynamics. Trading professionals spot periods of greater buying or selling pressure by looking at the money flow, which enables them to choose entry and exit locations more wisely. This raises the profitability of trading techniques and enhances their effectiveness.
- Used In Combination With RSI: The MFI complements other technical indicators like the Relative Strength Index (RSI) by adding volume data. The MFI adds another dimension by taking into account the volume of trades, whereas the RSI just focuses on price fluctuations. This combination provides a more thorough evaluation of market mood and improves trading choices.
The traders and investors gain a deeper understanding of market dynamics and make more informed trading decisions by utilising the MFI because of the above-mentioned reasons.
What are the uses of the Money Flow Index indicator?
The biggest use case of the Money Flow Index is that it is used to spot divergences that warn of possible trend change in price. The Money Flow Index (MFI) indicator has the below-mentioned top five uses in technical analysis.
- Confirming Price Trends: The MFI is used to confirm the strength and sustainability of price trends. It indicates a healthy and robust market movement When the MFI aligns with the prevailing price trend when the MFI aligns with the prevailing price trend. Divergences between the MFI and price action are used as a warning sign of a potential trend reversal.
- Spotting Potential Trend Reversals: The MFI assists traders in spotting probable trend reversals by examining changes in buying and selling pressure. These divergences serve as early warning signs of a shift in market sentiment as well as potential turning points for trends.
- Filtering Trade Signals: The MFI serve as a filter for trade signals produced by other indicators or methods. Traders then decide whether to enter the trade or modify their risk management if a trading technique gives a buy signal but the MFI shows an overbought position. A low MFI value also implies oversold situations when a sell signal is created, sending a warning signal.
- Assessing Market Strength: The MFI sheds light on how intense the market’s purchasing and selling pressure is. Traders can evaluate the overall strength or weakness of a security or market by keeping an eye on the MFI. Low MFI levels reflect greater selling pressure, whereas high MFI values signal greater buying pressure.
- Comparing Securities: The relative strengths or weaknesses of securities or markets are compared using the MFI. Traders prioritise their trading chances by determining the MFI for assets to determine where the money flow is strongest or weakest.
These are the key uses of the Money Flow Index indicator in technical analysis. The MFI is widely used by traders and investors to make wise trading decisions, because of the above-mentioned uses.
How often do Traders use the MFI indicator for Analysing Stock Market?
The frequency of MFI indicator usage among traders varies. Some traders rely heavily on the MFI as part of their trading strategy, while others only use it sparingly or not at all.
The MFI is primarily used to gauge the strength and sustainability of price movements in the stock market by examining volume and price action. It aids traders in spotting probable reversals, overbought or oversold situations, and price and volume divergences.
The MFI is also used by traders that employ indicators often and adhere to a technical analysis strategy, along with other indicators such moving averages, the relative strength index (RSI), and MACD (moving average convergence divergence). These traders frequently hunt for confirmation signals across a number of indicators, before making trading decisions.
The MFI and other technical indicators, on the other hand, are not significantly relied upon by traders who concentrate more on fundamental analysis or who have created their own distinctive trading techniques. They give priority to elements including corporate financials, market data, industry trends, and news.
How to use the Money Flow Index (MFI) indicator for Day Trading?
The Money Flow Index (MFI) indicator for day trading is used to spot potential buying and selling opportunities during a single trading session. There are eight steps involved in using the (MFI) indicator in Day Trading.
- Understand MFI Basics: Learn the fundamental principles and formula for the MFI indicator as described in the previous responses. Recognise that the MFI evaluates the movement of money into or out of security by combining price and volume data.
- Determine the Time Frame: Pick a time window that works for your day trading approach. The MFI is applied on other timescales, such as 5-minute, 15-minute, or 1-hour charts. The timeframe you choose will depend on your trading preferences and style.
- Identify Overbought and Oversold Levels: Choose the MFIs’ overbought and oversold levels that fit your trading style. MFI readings exceeding 80 are typically regarded as overbought, while values below 20 are typically regarded as oversold. The 10 and 90 value MFI scale are considered the thresholds for overbought and oversold situations. These thresholds are changed based on your experience and the particular market conditions you are trading.
- Look for Divergences: Look for differences between the MFI and price movement. It is known as the bullish divergence when the price hits lower lows and the MFI makes higher lows. This implies possible purchasing opportunities. Bearish divergence, on the other hand, happens when the price hits greater highs while the MFI makes lower highs, signalling possible selling opportunities.
- Confirm with Volume Analysis: Combine MFI readings with volume analysis to verify trade signals. Strong volume and high MFI readings support either a bullish or bearish indication, with high MFI readings supporting the former.
- Establish Entry and Exit Points: Decide on entry and exit locations for your trades based on the MFI readings and further confirming factors. Think about opening a long trade when the MFI crosses above the oversold level, signalling potential buying pressure. Think about opening a short position when the MFI crosses below the overbought level, indicating potential selling pressure.
- Manage Risk: Use effective risk management strategies to safeguard your capital, such as placing stop-loss orders or employing trailing stops. Decide on your risk tolerance and position sizing, depending on how volatile the security or market you are trading is.
- Practice and Refine: It is good practice to test your MFI-based day trading strategy in a simulated or paper trading environment before implementing it with real money. Monitor and evaluate your trades, and make necessary adjustments to refine your strategy over time.
The steps for using the Money Flow Index (MFI) indicator for day trading are modified based on individual traders’ experience and the specific securities or commodities being traded. It’s important to develop a comprehensive trading plan that incorporates risk management, technical analysis, and market knowledge.
How to buy using the Money Flow Index (MFI) indicator?
Buying using the Money Flow Index (MFI) indicator involves using the readings to identify potential buying points in your trades. The following are seven major steps to consider when buying using the MFI indicator.
- Identify Oversold Conditions: Keep an eye out for readings below 20, which signify oversold circumstances, on the MFI indicator. It shows that there has been significant selling pressure, potentially resulting in a buying opportunity when the MFI is inside this range.
- Bullish Divergence: Keep an eye out for a bullish divergence between the price chart and the MFI indicator. There is a bullish divergence when the price makes a lower low but the MFI indicator makes a higher low. This can imply a buying opportunity by pointing to waning selling pressure and a possible trend reversal.
- Verify with Price movement: Verify the purchasing opportunity suggested by the MFI with price movement before entering a trade. Watch for signs of a bullish reversal, such as bullish candlestick formations, trendline breaks, or price reversals off important support levels. These affirmations provide buyers with more assurance about future buying opportunities.
- Wait for Trend Reversal Signals: Wait for other trend reversal signals to align with the MFI indicator in addition to oversold conditions and bullish divergence. This can include a change in the overall market sentiment, positive news catalysts, or a shift in the broader technical indicators supporting an upward move.
- Consider Volume Confirmation: It is helpful to confirm buying signals with volume confirmation while the MFI incorporates volume data. Look for an increase in buying volume or a surge in trade activity during oversold conditions, indicating potential buying interest from traders and investors.
- Set Entry and Exit Points: Determine your entry point and set a stop-loss order to manage risk, after you’ve identified a buying opportunity. You can set the entry point slightly above the confirmation level and the stop-loss order below the recent swing low or a key support level. Additionally, consider setting a profit target based on your risk-reward ratio.
- Monitor and Adjust: Pay special attention to the MFI indicator and price movement after placing the transaction. Adjust your stop-loss order or take profits as the price swings in your favour. Think about trailing your stop-loss to protect profits and modifying your exit strategy in response to shifting market conditions.
The prices of assets in the market depend upon variables like market conditions, news, etc., so traders should always dynamically enhance their strategies to make wise decisions in the market.
How to sell using the Money Flow Index (MFI) indicator?
Selling using the Money Flow Index (MFI) indicator involves using the MFI readings to identify potential selling opportunities or exit points in your trades. The following are six major steps to consider when selling using the MFI indicator.
- Monitor Overbought Conditions: MFI readings above 80 suggest overbought situations, which should be watched for. The market or the asset will be overdue for a price correction or reversal if the MFI rises beyond this threshold. This is a sign to think about liquidating your positions or taking profits from your existing ones.
- Watch for Bearish Divergences: Bearish divergences between the MFI and price action should be noted. It is known as a bearish divergence, when the price hits higher highs while the MFI hits lower highs. This is a sign of a potential trend reversal. It is a sign that it’s time to sell or think about getting out of long positions.
- Identify Reversal Patterns: Use the MFI indicator with additional technical analysis instruments to find probable reversal patterns. Seeing a bearish reversal pattern like a double top or a bearish engulfing candlestick pattern reinforces the sell signal if the MFI indicates overbought circumstances (over 80). Look for price trends that coincide with the MFI readings to boost your confidence in your selling decision.
- Set Price Targets: Determine your selling price targets based on the MFI readings and other relevant factors. Think about establishing profit goals or trailing stops to lock in gains, in the event that the MFI displays overbought conditions or bearish signs. Change your selling strategy, depending on the MFI reading’s strength and the state of the market as a whole,
- Take Volume Confirmation into Account: The MFI takes volume data into account; it is useful to search for evidence of selling pressure through volume analysis. Your decision to sell should be further supported if you notice a substantial surge in selling volume paired with high MFI readings or bearish divergences.
- Combine with Other Indicators: Using the MFI indicator in combination with other technical indicators or research methods is frequently advantageous. Consider trendlines, moving averages, or support and resistance levels, to verify the MFI-based selling signals.
It is important to keep in mind that MFI is only one tool among and that there are other aspects to take into account, such as fundamental analysis and the state of the market as a whole. It is advised to test and hone your approach first using a demo account or with small position sizes before applying it to live-to-trade.
What is the Formula for the Money Flow Index (MFI)?
The formula for calculating the Money Flow Index (MFI) involves the calculation of three most important components: the typical price for a period, raw money flow, and money ratio.
The Typical Price:
Typical Price = (High + Low + Close) / 3
The Raw Money Flow:
Raw Money Flow = Typical Price x Volume
The Positive Money Flow and Negative Money Flow:
Positive Money Flow = Sum of raw money flows on days where the typical price is higher than the previous day’s typical price.
Negative Money Flow = Sum of raw money flows on days where the typical price is lower than the previous day’s typical price.
The Money Ratio:
Money Ratio = Positive Money Flow / Negative Money Flow
The Money Flow Index (MFI):
MFI = 100 – (100 / (1 + Money Ratio))
The Money Flow Index is calculated after evaluating the results derived from the above-mentioned formulas.
How to Calculate Money Flow Index (MFI)?
The MFI is a valuable indicator that helps traders assess the strength and direction of money flowing into or out of a security or market. The below-given methodology is involved in determining the value of the MFI. The MFI is calculated using the four most important calculations mentioned below.
- The typical price for a period:
The typical price is the average of the high, low, and closing prices for a given period. It represents the average price at which a security traded during that period.
The formula for the typical price:
Typical Price = (High + Low + Close) / 3
- Calculate the raw money flow:
The raw money flow is the product of the typical price and the volume for a given period. It indicates the amount of money flowing into or out of a security.
The formula for the raw money flow:
Raw Money Flow = Typical Price x Volume
- Calculate the money ratio:
The money ratio contrasts positive and negative cash flows over a predetermined number of periods. It chooses the direction and strength of the money flow.
The formula for the money ratio: Money Ratio = (Positive Money Flow / Negative Money Flow)
Follow the below-mentioned three steps to calculate the money ratio.
- Identify positive money flow: Sum up the raw money flow for each period where the price is higher than the previous period’s typical price.
- Identify negative money flow: Sum up the raw money flow for each period where the price is lower than the previous period’s typical price.
- Calculate the money ratio using the above formula.
- Calculate the Money Flow Index (MFI):
The money ratio is used on a scale from 0 to 100 to create the money flow index. It shows the strength of the price movement and possible reversals.
The formula for the Money Flow Index:
MFI = 100 – (100 / (1 + Money Ratio))
Example:
Let’s consider a stock with the following data for five consecutive days:
Day 1: High = ₹50, Low = ₹45, Close = ₹48, Volume = 100,000 shares
Day 2: High = ₹52, Low = ₹47, Close = ₹51, Volume = 150,000 shares
Day 3: High = ₹54, Low = ₹49, Close = ₹50, Volume = 200,000 shares
Day 4: High = ₹53, Low = ₹48, Close = ₹52, Volume = 180,000 shares
Day 5: High = ₹55, Low = ₹50, Close = ₹53, Volume = 120,000 shares
Step 1: Calculate the typical price for each day:
Day 1: Typical Price = (₹50 + ₹45 + ₹48) / 3 = ₹47.67
Day 2: Typical Price = (₹52 + ₹47 + ₹51) / 3 = ₹50.00
Day 3: Typical Price = (₹54 + ₹49 + ₹50) / 3 = ₹51.00
Day 4: Typical Price = (₹53 + ₹48 + ₹52) / 3 = ₹51.00
Day 5: Typical Price = (₹55 + ₹50 + ₹53) / 3 = ₹52.67
Step 2: Calculate the raw money flow for each day:
Day 1: Raw Money Flow = Typical Price x Volume = ₹47.67 x 100,000 = ₹4,767,000
Day 2: Raw Money Flow = Typical Price x Volume = ₹50.00 x 150,000 = ₹7,500,000
Day 3: Raw Money Flow = Typical Price x Volume = ₹51.00 x 200,000 = ₹10,200,000
Day 4: Raw Money Flow = Typical Price x Volume =
₹51.00 x 180,000 = ₹9,180,000
Day 5: Raw Money Flow = Typical Price x Volume = ₹52.67 x 120,000 = ₹6,320,400
Step 3: Calculate the money ratio:
Positive Money Flow = Sum of raw money flows on days where the typical price is higher than the previous day’s typical price.
Negative Money Flow = Sum of raw money flows on days where the typical price is lower than the previous day’s typical price.
Assuming we start the calculation from Day 2:
Positive Money Flow = ₹10,200,000 + ₹9,180,000 = ₹19,380,000
Negative Money Flow = ₹4,767,000 + ₹6,320,400 = ₹11,087,400
Money Ratio = Positive Money Flow / Negative Money Flow = ₹19,380,000 / ₹11,087,400 = 1.748
Step 4: Calculate the Money Flow Index (MFI):
MFI = 100 – (100 / (1 + Money Ratio))
MFI = 100 – (100 / (1 + 1.748))
MFI ≈ 63.07
The Money Flow Index (MFI) for the given example is approximately 63.07.
How to read the Money Flow Index (MFI) chart?
The Money Flow Index (MFI) is widely used by traders of all experience levels because of its simplicity. Following are the three major steps involved in reading the Money Flow Index (MFI) chart.
: Definition, How it Works, Uses, and Calculations 12")
1. Being aware of the range: The MFI is frequently shown as a line graph with values between 0 and 100. This makes it easier for beginners to use and understand.
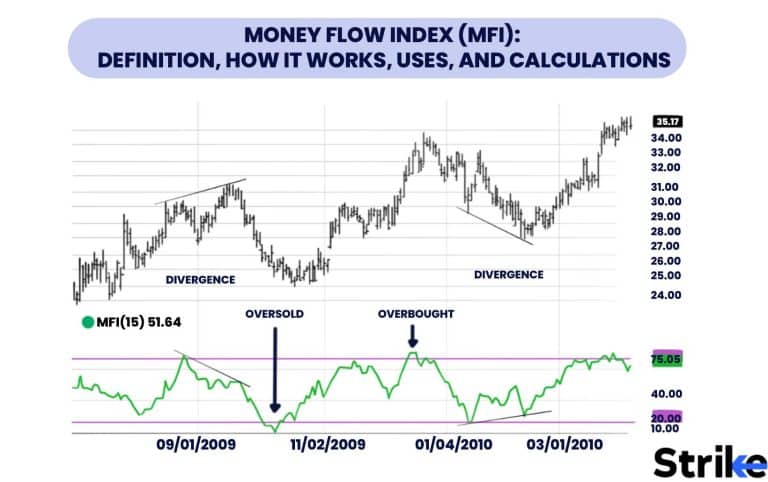
2. Spotting divergences: Keep an eye out for differences between the security’s price and the MFI. A potential bullish divergence, or rising purchasing pressure despite declining price movement, is indicated if the MFI is reaching higher highs while the price is making lower lows. It can indicate a bearish divergence, suggesting that selling pressure is increasing despite the upward price movement, if the MFI is making lower lows while the price is making higher highs.
3. Confirming trend reversals: Watch for trend reversals when the MFI crosses above or below certain threshold levels, such as 90 or 10 (or 80 and 20). It can suggest a potential reversal from oversold conditions and the start of a bullish trend if the MFI crosses above 90 from below. It can similarly indicate a potential reversal from overbought conditions and the start of a bearish trend if the MFI crosses below 10 from above.
The Money Flow Index (MFI) chart is similar to the RSI, and its application and functioning are almost similar with just the difference of how both of these are formed. Knowing either of them can help you understand the other one.
How to use the Money Flow Index (MFI) in Technical Analysis?
The MFI is widely used to identify potential overbought or oversold conditions and generate buy or sell signals. Following are the three steps for using the MFI in technical analysis.
1. Calculate the Money Flow Index: Determine the typical price for each period. The typical price is the average of the high, low, and closing prices for a specific period (e.g., typically 14 periods). Start by calculating the raw money flow (RMF) for each period. The RMF is the typical price multiplied by the volume for that period. Then evaluate the money flow ratio (MFR) for each period. The MFR is the ratio of positive money flow to negative money flow.
Calculate the MFI using the formula: MFI = 100 – (100 / (1 + MFR))
2. How the MFI values should be interpreted: The MFI normally runs from 0 to 100. A rise in the MFI above a particular mark indicates overbought conditions, which can indicate a price correction. Traders can think about selling or taking profits in this scenario. A probable price comeback or reversal is implied when the MFI drops below 20, which implies oversold circumstances. Traders can think about purchasing or opening long positions when this happens.
3. Timeframes and settings: The MFIs’ effectiveness can change depending on the period and settings. More frequent indications are provided by shorter timeframes (like intraday); however, they are more susceptible to misleading signals. Fewer trading opportunities, and longer timeframes (such as daily or weekly) can provide more trustworthy indications. Adjust the MFIs’ period and sensitivity depending on your trading strategy and the features of the asset you are examining.
It is important to consider the timeframe and settings of the MFI to ensure reliable signals for your trading strategy and the specific asset being analysed. Use the MFI as a valuable resource to navigate market trends and optimize your trading approach. It is always advised for traders to practise and backtest Money Flow Index strategies before using these methods in actual trading scenarios.
What are the Trading Signals generated by the Money Flow Index (MFI) indicator?
The Money Flow Index (MFI) is a technical indicator that measures the strength of a security by using price and volume data to provide trading signals. The following are the three trading signals generated by the MFI indicator.
1. Failure Swings
A failure swing results when the MFI goes in the opposite direction of the price. It is known as a failed swing when the MFI reaches overbought or oversold levels (usually above 80 or below 20) and then reverses course without the price making a new high or low. This indicator shows that the price trend is about to reverse.
2. Overbought/Oversold Condition
The MFI can show whether an asset is overbought or oversold. A downward correction takes place if the MFI rises above 80, indicating that the security has been overbought. It denotes oversold conditions, on the other hand, when the MFI drops below 20, indicating that the asset has been undervalued and that an upward correction can occur.
3. Divergences
The MFI can also generate divergence signals. Divergence occurs when the MFI and the price of a security move in opposite directions. A bullish divergence occurs when the price makes a lower low but the MFI forms a higher low. This suggests a potential upward reversal in the price. Bearish divergence, on the other hand, occurs when the price makes a higher high, but the MFI scale forms a lower high, which signifies a potential downward reversal.
It is always recommended to practise proper risk management and consider multiple factors before executing trades.
What are the benefits of the Money Flow Index indicator?
The Money Flow Index (MFI) is a popular indicator used in financial analysis to measure the strength and momentum of money flow in the market. It provides insights into the buying and selling pressure of the market and is also beneficial in the below-mentioned ways.
- Identify Overbought and Oversold Conditions: The MFI has a range from 0 to 100, which is frequently used to determine whether an asset is overbought or oversold. The asset is overbought and experiences a price correction or reversal if the MFI increases above the 80 scale. It means that the asset has been oversold, and it is a good time to buy if the MFI drops below 20.
- Verifying price trends: The MFI is used to verify a price trend’s robustness. It indicates that there is significant buying pressure supporting the upward trend if the MFI is increasing along with the price. Similar to how it would imply more selling pressure and also confirm a downward trend if the MFI dropped along with the price.
- Analysis of divergence: A divergence is when an asset’s price moves in the opposite direction of the MFI. This is known as bullish divergence, and it suggests that there is increasing purchasing pressure when the price establishes lower lows while the MFI creates higher lows. It is known as a bearish divergence and indicates that there may be selling pressure when the price reaches higher highs while the MFI hits lower highs. Divergence can aid traders in foreseeing trend continuations or trend reversals.
- Analysis based on volume: The MFI takes into account both price and volume information, giving a more complete picture of market activity. The MFI can assist traders in determining the significance of price changes by taking into account both variables and validating or contesting the strength of a move based on the accompanying volume.
- Generating trading signals: Traders use the MFI with other indicators or chart patterns to generate trading signals. They can, for example, look for a bullish crossover of the MFI above a certain threshold combined with a breakout from a chart pattern as a potential buy signal. A bearish crossover of the MFI below a specific threshold along with a breakdown of a chart pattern is seen as a potential sell signal.
The MFI is a useful tool, but it should not be relied upon completely. It is always best used as part of a comprehensive trading or investment strategy that takes into account other indicators, fundamental analysis, and risk management techniques.
What are the limitations of the Money Flow Index indicator?
The Money Flow Index (MFI) is a popular technical indicator used in financial markets to measure the strength and direction of money flowing in and out of a security. The MFI is a useful tool, but it does have the following six limitations that traders should take care of.
- False Signals: The MFI is not perfect and can produce erroneous signals, just like any other technical indicator. It is predicated on the idea that volume and price statistics accurately reflect the market’s purchasing and selling pressure. Price and volume, however, does not always correctly reflect the genuine emotions of market participants, resulting in false signals.
- Lagging Indicator: It responds to price and volume data that have already happened because the MFI is a lagging indicator. It cannot give accurate alerts for swift market changes or reversals because of this. Trading decisions made by traders who primarily rely on the MFI are also delayed because of the same.
- Sensitivity to time Length: A certain lookback time, generally 14 days, is used in the MFIs’ computation. The indicator’s sensitivity and responsiveness are impacted by the period length option. Longer durations produce slower signals that miss possibilities for immediate action, while shorter periods produce more frequent but potentially more erroneous signals.
- Limited Effectiveness in Trendless Markets: The MFI works best in markets that are clearly in a trend, either upward or downward. The MFI can generate contradictory or untrustworthy signals in sideways or range-bound markets, where prices vary within a constrained range. Traders should use the MFI with caution, in such market situations.
- Not Appropriate for All Securities: The MFI was designed primarily for use in equity markets. It can also be used with other financial instruments, such as currency or commodities, but the results are not always as favourable. The MFIs’ application is limited by the possibility that its assumptions regarding volume and price correlations do not hold in all markets.
- Lack of Context: The MFI gives data on purchasing and selling pressure, but it neglects to consider other elements that impact market dynamics, such as fundamental analysis, current affairs, or market attitude. Traders should think about using the MFI in conjunction with other indicators and research methods to get a more complete picture of the market.
No single indicator can guarantee accurate predictions or eliminate all risks in trading. Traders should always exercise caution, perform a thorough analysis, and consider other factors before making trading decisions.
Is MFI a leading or lagging indicator?
The Money Flow Index (MFI) is considered both a leading and a lagging indicator, depending on how it is used and the context in which it is applied. The two scenarios are discussed below in detail.
Leading Indicator: The MFI occasionally functions as a leading indicator, giving warning of impending trend reversals or shifts in market sentiment. This is especially true when the MFI deviates from price changes. It indicates waning purchasing demand and a potential impending market reversal if the price of an asset is reaching higher highs but the MFI is hitting lower highs. It shows lessening selling pressure, similar to the last example, and a potential price reversal if the price is making lower lows while the MFI is making higher lows. Traders can predict changes in the market’s direction before actual price movements confirm them by seeing these divergences.
Lagging Indicator: The MFI can also be regarded as a lagging indicator in specific circumstances. It uses historical price and volume data to determine money flow; hence, it depends on data from earlier price and volume movements. The MFI cannot immediately signal changes in the trend or market reversals because of this. It takes a little while for it to react to price fluctuations and needs enough data points to get reliable findings.
Traders frequently employ the MFI with other indicators or price patterns to confirm signals and boost their confidence in their trading decisions. The MFI can display traits that are common to both leading and trailing indicators. Its capacity to spot divergences and predict trend reversals supports its leading qualities, while its reliance on historical data and the possibility of modest signal production delays suggest trailing traits.
It is crucial to understand these factors and take the larger market context into account when evaluating and employing the MFI in trading or investment strategies.
Is MFI a volume flow indicator?
Yes, the Money Flow Index (MFI) is indeed considered a volume flow indicator. It considers both price and volume data to calculate the strength and intensity of money flow into and out of a specific asset over a given period, The idea of positive and negative money flow is included in the MFI. There is positive money flow when the average price (high, low, and close), multiplied by the volume, is higher than the average price from the prior period. Negative money flow, in contrast, happens when the average price is less than the average price multiplied by the volume of the previous period.
The MFI measures the purchasing and selling pressure in the market by calculating the ratio of positive money flow to negative money flow. It shows whether money is going into an asset (positive money flow) or out of it (negative money flow), based on the volume of trades.
The MFI is categorised as a volume flow indicator because it takes volume as well as price changes into account to reveal the strength and direction of money flow in the market.
Is a higher MFI good or bad?
A higher MFI is considered a good selling signal by traders. A higher MFI (Money Flow Index) value is considered either good or bad, depending on the context and trading strategy being employed. Following is an explanation of the two possible scenarios appearing in the case of a higher MFI.
Higher MFI as “good”:
A higher MFI value indicates strong buying pressure and increased money flow into the asset. This is seen as a positive sign for the price movement of the asset. A higher MFI above the overbought threshold suggests that the asset is in an overbought condition and a potential reversal or correction in price is going to occur. Traders who anticipate such reversals see this as an opportunity to sell or take profits.
Traders can additionally look for divergences between the MFI and price movements. It indicates weakening buying pressure and serves as a warning sign for a potential price decline if the price is trending upwards while the MFI is trending downwards (negative divergence).
Higher MFI as “bad”:
A greater MFI number, on the other hand, is undesirable if it implies excessive market speculation or an uncontrollable purchasing frenzy.
A price correction or reversal is on the horizon if the MFI remains significantly above the overbought threshold for an extended period, which indicates that the asset is overvalued. Losses for traders who purchased the item at high levels can result from this. A high MFI number can also signify a probable divergence or a weak underlying trend without commensurate price strength or positive price action, which will be interpreted by traders as a warning indicator.
It’s important to note that the interpretation of MFI, like any other technical indicator, should not be considered in isolation. Traders should experience and have confidence in using MFI by practising it in different kinds of market conditions.
Is a lower MFI good or bad?
A lower MFI is considered a good buying signal. A lower MFI (Money Flow Index) value is considered either good or bad, depending on the context and trading strategy being employed. A lower Money Flow Index (MFI) number is typically interpreted as a bearish indication or a sign of weakness. It is crucial to remember that the interpretation of MFI values depends on the particular situation and the chosen trading approach.
The MFI value is low when it is below 20 it denotes that selling pressure has been the main factor, which has resulted in an oversold state. This means that the price has been forced to an unreasonably low level and is therefore overdue for a possible reversal or upward price correction. Traders frequently view this as a potential purchasing opportunity since they anticipate a price increase.
Can MFI and RSI be used together?
Yes, MFI (Money Flow Index) and RSI (Relative Strength Index) are used together in technical analysis. Both indicators provide valuable information about market conditions and sentiment, and using them in combination enhances the effectiveness of trading strategies.
1. Signal confirmation: It boosts confidence in the trading decision when MFI and RSI produce comparable signals. It makes more sense to take into account a probable price correction or reversal if both indications point to an asset being overbought.
2. Spotting divergences: MFI and RSI work in tandem to spot divergences, which happen when the price and the indicator move in opposition to one another. Divergences offer early warning signs of possible trend reversals. The hint of a potential shift in price direction is strengthened if MFI displays a divergence and RSI verifies the pattern.
3. Different viewpoints: MFI focuses on volume and money flow, whereas RSI just concentrates on price changes. Traders can see the movements of the market more thoroughly by taking both indicators into account. MFI sheds light on the volume-based buying and selling pressure’s severity, while RSI measures the size and speed of price swings. Combining different viewpoints can result in a more complex comprehension of market movements.
4. Risk management: Combining MFI and RSI helps with risk management by offering complementary information. Traders take into account the overbought and oversold levels suggested by both indicators. This is useful in figuring out the best points to take profits or decrease losses.
It’s important to remember that no indicator, alone or in combination, can ever guarantee precise trade forecasts, although MFI and RSI are used in tandem. Traders frequently create their strategies by mixing several indicators and tactics, depending on their trading preferences and style.
What is the difference between MFI and RSI?
MFI (Money Flow Index) and RSI (Relative Strength Index) are both popular technical indicators used in financial analysis, particularly in the field of technical analysis for trading and investing. Their approaches to calculation and interpretation are very different from each other, as described below.
Calculation:
MFI: The Money Flow Index measures the strength and intensity of money flow into and out of a particular asset over a specified period. It uses both price and volume data for its output.
MFI is calculated using the formula: MFI = 100 – (100 / (1 + Money Flow Ratio)), where Money Flow Ratio = (Positive Money Flow / Negative Money Flow).
RSI: The Relative Strength Index gauges the magnitude and velocity of price changes in a security over a particular specified period.
RSI is calculated using the formula: RSI = 100 – (100 / (1 + RS)), where RS (Relative Strength) = (Average Gain / Average Loss).
Interpretation:
MFI: The MFI fluctuates in the range between 0 and 100. A rating below 20 is considered oversold, indicating a potential upward price movement, while a value above 80 is considered overbought. Traders also check for divergences between price movements and the MFI, to spot probable trend reversals.
RSI: The RSI fluctuates as well, ranging from 0 to 100. A rating below 30 is regarded as oversold, indicating a potential upward price correction, while a value above 70 is considered overbought, indicating a potential downward price correction. Divergences between price movements and the RSI can reveal information about trend reversals, similar to the MFI.
Focus:
MFI: The MFI concentrates on the link between price and volume in order to determine the market’s buying and selling pressure. It considers the money flow into or out of an asset.
RSI: The RSI only considers price fluctuations and seeks to spot overbought and oversold market circumstances that can presage price reversals.
Both indicators are used to assess market conditions and generate trading signals, but their calculation methods and interpretations differ. Traders use a combination of indicators to gain a more comprehensive view of market dynamics and make informed trading decisions.


 Previous Article


![15 Investing.com Alternatives [Free+Paid] You Should Use in 2026](https://www.strike.money/wp-content/uploads/2026/04/Investing.com-Alternatives.jpg "15 Investing.com Alternatives [Free+Paid] You Should Use in 2026 16")
![15 TradeStation Alternatives [Free+Paid] You Should Use in 2026](https://www.strike.money/wp-content/uploads/2026/04/TradeStation-Alternatives.jpg "15 TradeStation Alternatives [Free+Paid] You Should Use in 2026 17")
![15 Chartink Alternatives [Free+Paid] You Should Use in 2026](https://www.strike.money/wp-content/uploads/2026/04/Chartlink-Alternatives.jpg "15 Chartink Alternatives [Free+Paid] You Should Use in 2026 18")
: Overview, 10 Types of Indicators, Settings for Different Markets 19")


 : Definition, Formula, calculation, Uses, Advantages Vs limitations 22")


No Comments Yet.