Evening Star Doji is a three-candle pattern that signals a potential reversal in an uptrend. Evening star doji candles generally indicate a lack of consensus among traders regarding the direction of the price. The evening Doji Star pattern is not a frequent pattern. A doji candle (red colour) with a body placed below a trendline confirms an evening doji star in most charts.
This pattern provides traders with a clear indicator of when to sell or short a stock, which is one of its advantages. Following an upswing, the pattern suggests that bears are gaining pace; therefore, it would be prudent to sell before the price declines further. One drawback of employing the Evening Star Doji is that its accuracy is not always reliable. Investigating additional technical indicators and market movements is essential to validate the pattern.
What is an Evening Star Doji?
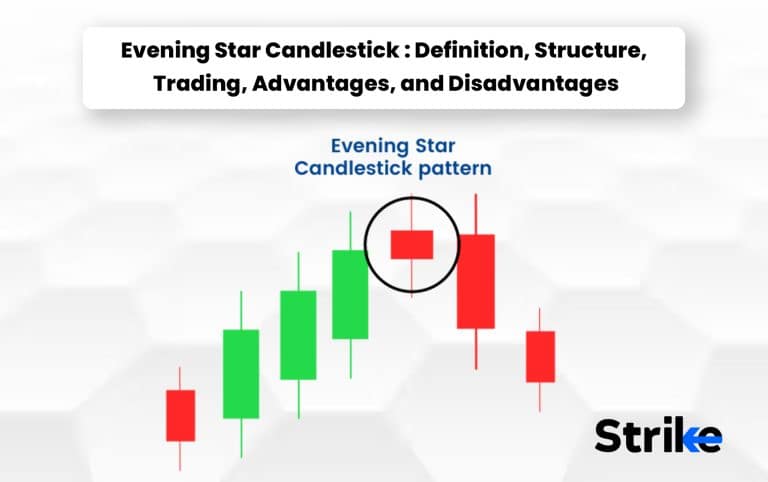
The evening star doji is a bearish reversal pattern made of up three candles: a red candle, a small-bodied candle, and a large green candlestick. It is formed when a green candlestick is followed by a Doji, which is then followed by a red candlestick. An evening star doji is similar to an evening star candlestick pattern. The Evening Doji Star must be a Doji candle for the second candle, which is the only distinction. Let us look at an example to understand this better.
There are three candles to be taken note of in the above image. The first is a green candle, the second is a small candled and red doji and the third is a large red candle. This causes the formation of an evening star doji. The Doji represents indecision in the market, and the red candlestick indicates that the bears have taken control.
How is an Evening Star Doji Candlestick Formed?

The Evening Star Doji candlestick is composed of three separate candlesticks. The first candlestick is a green candlestick, which shows that the bulls are in charge of the market at this time. The second candlestick is a Doji, which indicates that the market is uncertain about what direction to take.
The third candlestick is a red candlestick, and this colour denotes that bears have assumed control of the market at this time. Below is the formation of the evening star doji pattern. The while candle in the below pattern is interchangeable with a green candle in most charts, while some charts use white candles to represent bulls.
What does Red Evening Star Doji Candlestick indicate?
A red doji is a candlestick with a small body that appears in the centre of the evening star doji pattern, between a long bullish candle and a long bearish candle. A red doji shows a bearish trend. The doji is a symbol of indecision in the market and shows that bulls are losing momentum while bears may be gaining power. This is suggested by the fact that the bulls are losing momentum.
The pattern begins with a long bullish candle, which is then followed by a small-bodied doji candle that gaps up from the preceding candle, signalling indecision in the market. The pattern ends with a long bullish candle.
A long bearish candle that spans down from the doji at the end of the pattern is a clear indication that bears have gained control of the market. The appearance of a red doji is a warning sign that the bulls are losing steam and that the bears are gaining power. This may be a hint that the current upswing is about to come to an end and that a trend reversal is on the horizon.
What does Green Evening Star Doji Candlestick tell?
A green doji is a small-bodied candlestick that appears in the centre of the evening star doji pattern, between a long bullish candle and a long bearish candle. This indicates that the market is neutral. A green doji emerging in the Evening Star pattern is a sign that the power of the bulls and bears in the market is roughly equal and that there is hesitation in the market. This is a hint that the upward trend is starting to lose steam, indicating that a trend reversal is on the horizon.
Does It Matter if an Evening Star Doji Candlestick Is Red or Green?
Yes, a red Evening Star Doji candlestick is a bearish reversal pattern, while a green Evening Star Doji candlestick is a bullish reversal pattern.
When does Evening Star Doji Candlestick happen?
The Evening Star Doji pattern typically occurs during an uptrend and signals a potential reversal.
How often does Evening Star Doji Candlestick occur?
The Evening Star Doji candlestick pattern does not occur very often, making it rare. It is a strong signal that traders should pay attention to when it does occur.
How to read Evening Star Doji Candlestick in Technical Analysis?
The Evening Star Doji candlestick pattern is read as a potential reversal signal. Traders should look for a green candlestick, followed by a Doji, and then a red candlestick. It is a strong signal that the trend is likely to reverse. Look at the image below.
There are four main things traders do to safeguard their positions or take advantage of the reversal in response to the signal. You have the option of taking profits if you are already long. Consider shorting the asset if you do not already have a position in it. It is essential to implement stop-loss orders to prevent further losses.
Traders then utilise additional technical indicators to corroborate the bearish reversal signal and search for additional signals of market weakness, such as a decline in trading volume or a breach below critical support levels. It is essential to note, however, that no trading technique or indicator is infallible, and there is always the possibility of incurring a loss when trading. Always employing risk management measures, traders should never risk more than they afford to lose.
How accurate is the Evening Star Doji Candlestick in Technical Analysis?
The accuracy of the Evening Star Doji candlestick pattern in technical analysis depends on the context in which it appears. The evening star is a good indicator that a downward trend has begun, for instance. But it may not be accurate when it appears in other contexts.
How does the Evening Star Doji pattern’s trend location impact its predictive power?
The pattern appearing at the end of a long uptrend is a strong signal that the trend is likely to reverse. The pattern appearing in the middle of an uptrend may be less reliable.
When is the best time to Trade using Evening Star Doji Candlestick?
The best time to trade using the Evening Star Doji candlestick pattern is when it appears at the end of an uptrend. Traders should check the daily or weekly chart for the pattern and wait for the pattern to be confirmed before starting a short trade. Confirmation may appear in the form of a price movement that breaks below the low of the Doji candle or a reduction in the volume of trading activity.
How to Trade with Evening Star Doji Candlestick in Stock Market?
Traders in the stock market who want to trade using the Evening Star Doji candlestick pattern should look for a green candlestick, followed by a Doji, and then a red candlestick. The pattern seen at the end of an uptrend strongly indicates that the trend is about to change direction and head in the opposite direction.
Where does an Evening Star Doji commonly used?
The Evening Star Doji candlestick pattern is commonly used in technical analysis by traders looking for potential market reversals. It can be applied to any market, including stocks, forex, and commodities.
Is an Evening Star Doji in an Uptrend a Sell Signal?
Yes, an Evening Star Doji in an uptrend is a sell signal. It indicates that the bears have taken control of the market, and the trend will likely reverse from an uptrend to a downtrend.
What are the advantages of the Evening Star Doji Candlestick Pattern?
The main advantage of evening star doji is that it doesn’t provide a clear signal. Below are two other advantages.
- Accuracy – Evening star doji is a rarely appearing candle, but its accuracy is considered high when it appears.
- Works well with other indicators – Evening star doji is used alongside other technical indicators for better signals.
Evening star doji’s rarity and high accuracy make it an effective addition to any trader’s arsenal of technical indicators
What are the disadvantages of Evening Star Doji Candlestick Pattern?
The evening star doji pattern has two main disadvantages. They are listed below.
- It is highly reliant on additional indicators to confirm the pattern.
- It is a rare pattern and is barely documented.
The rarity of the pattern means that it does not occur frequently enough to be relied upon as a primary trading signal
What is the Opposite of Evening Star Doji Candlestick?
The Morning Star Doji is the opposite of the Evening Star Doji candlestick pattern. Morningstar is a bullish reversal pattern that signals a potential reversal from a downtrend to an uptrend. Below is what the morning star doji pattern looks like.
What are other types of Doji Candlestick Patterns besides Evening Star Doji?
The evening star doji is one among hundreds of patterns observable in a price chart. Below is a list of five other types of Doji candlestick patterns.
Gravestone Doji
A Gravestone Doji is a type of candlestick pattern that appears on a chart when the opening price, closing price, and low price are all the same, but the high price is considerably higher than the opening price. Gravestone doji was given that name vecause the pattern looks like a gravestone. A bearish reversal pattern appears at the end of an uptrend and indicates that the bulls have lost control of the market.
This pattern arises when an uptrend comes to an end. The fact that the upper shadow so long suggests that the bears were successful in driving the price higher, but that the bulls were unable to keep the momentum going. Traders frequently make use of the Gravestone Doji pattern to detect potential chances for short selling and to control their risk by setting stop-loss orders above the pattern’s high.
Dragonfly Doji
The Dragonfly Doji is a type of candlestick pattern that appears when the opening price, closing price, and high price are all the same, but the low price is much lower than the opening price. t. A bullish reversal pattern appears at the end of a downward trend and indicates that bulls have won control of the market. This pattern happens when a downtrend comes to an end.
It can be seen from the length of the lower shadow that the bears were successful in driving the price down; however, the bulls were successful in reversing the trend and closing the price roughly where it had opened. Traders frequently make advantage of the Dragonfly Doji pattern in order to locate possible buying opportunities and control their risk by placing stop-loss orders below the pattern’s bottom.
Long-Legged Doji
The Long-Legged Doji is a type of candlestick pattern that appears on the chart when the open, high, and closing prices are all the same but the price has made significant moves both higher and down throughout the trading day, which has led to the formation of long upper and lower shadows.
The pattern indicates that there is indecision in the market between the buyers and the sellers, and that neither party can acquire control of the price. Traders frequently use the Long-Legged Doji pattern to predict probable trend reversals. This is because the pattern can signify a shift in market sentiment when it appears.
Bullish star doji
The Bullish Star Doji is a type of candlestick pattern that is formed when a Doji candlestick comes after a downtrend and has a long lower shadow and very little or no upper shadow. This pattern indicates that buyers are likely to regain control of the market. The pattern points to the bears have lost control of the market, and the bulls beginning to build momentum in their pursuit of market dominance.
A Doji candlestick is formed when there is little to no upper shadow and a long lower shadow, indicating that the bears were successful in driving the price down but that the bulls were able to step in and drive the price back up, resulting in a Doji candlestick.
Bearish doji star
The Bearish Doji Star is a pattern that occurs on a candlestick chart when a Doji candlestick arises after an uptrend with a lengthy upper shadow and little to no lower shadow. This pattern is known as a “reversal pattern.” The pattern indicates that the bulls no longer have control of the market, and that the bears are beginning to acquire momentum in their pursuit of market dominance.
A Doji candlestick is formed when there is little to no lower shadow and a long upper shadow, indicating that the bulls were able to push the price up, but that the bears were able to step in and push the price back down, resulting in a Doji candlestick.
The different Doji candlestick patterns work differently even though they have the commonality of having a doji. It is hence advised to learn properly about it before utilizing it for your trades.
How does the Evening Star Doji compare to other trend reversal patterns?
The Evening Star Doji is regarded as a powerful signal when compared to other patterns that suggest a trend reversal due to the fact that it shows a sudden shift in market mood. Other reversal patterns, such as the double top or the head and shoulders, may take longer to develop and may not be as trustworthy.
What Candlestick Pattern is Similar to Evening Star Doji Candlestick?
The Evening Star is a pattern that is analogous to the Evening Star Doji and comprises three candles much like that design does. The Evening Star pattern is characterised by three candles: a large bullish candle at the beginning, a little candle with a short body and lengthy upper and lower shadows, and a massive bearish candle at the finish.
The Evening Star pattern likewise points to a bearish reversal, however in contrast to the Evening Star Doji pattern, the middle candle in the Evening Star pattern has a genuine body rather than a Doji. These patterns are considered to be significant reversal indications since they suggest a change in the sentiment of the market.
Is Evening Star Doji a bullish reversal pattern?
No, the evening Star Doji is not a bullish reversal pattern, contrary to popular belief. This is a bearish reversal pattern, which implies that there may be a change from a bullish to a bearish feeling on the market.
What is the difference between Evening Star doji and Morning Star Doji?
Both the Evening Star Doji and the Morning Star Doji are examples of three-candlestick patterns that point to the possibility of a reversal in the prevailing trend. They are dissimilar with regard to the tone that they project and the path that they take.The Evening Star Doji may appear following a period of bullish price movement.
A large bullish candle, a Doji, sometimes known as a spinning top, and a massive bearish candle make up this pattern. The presence of a Doji candle in the market is interpreted to represent indecision, and the subsequent formation of a bearish candle after a bullish candle signals a change in market sentiment from bullish to bearish.
The Morning Star Doji appears on the chart after a downward trend. A doji and a bearish candle make up this pattern. The presence of a Doji candle in the market is interpreted to represent indecision, and the subsequent appearance of a bullish candle after a bearish candle signals a change in market sentiment from bearish to bullish.


 Previous Article


![15 Investing.com Alternatives [Free+Paid] You Should Use in 2026](https://www.strike.money/wp-content/uploads/2026/04/Investing.com-Alternatives.jpg "15 Investing.com Alternatives [Free+Paid] You Should Use in 2026 10")
![15 TradeStation Alternatives [Free+Paid] You Should Use in 2026](https://www.strike.money/wp-content/uploads/2026/04/TradeStation-Alternatives.jpg "15 TradeStation Alternatives [Free+Paid] You Should Use in 2026 11")
![15 Chartink Alternatives [Free+Paid] You Should Use in 2026](https://www.strike.money/wp-content/uploads/2026/04/Chartlink-Alternatives.jpg "15 Chartink Alternatives [Free+Paid] You Should Use in 2026 12")
: Overview, 10 Types of Indicators, Settings for Different Markets 14")

 : Definition, Formula, calculation, Uses, Advantages Vs limitations 16")


No Comments Yet.