The tweezer top candlestick pattern is widely used by traders because it highlights a strong price rejection at a key resistance level and signals a weakening of bullish momentum. The tweezer top also reflects change in market psychology, which helps traders to spot early reversal trades.
When combined with volume, support-resistance analysis, or indicators like RSI and moving averages, the pattern provides stronger insights into potential downside moves and improves the overall trading decision process. Traders use this pattern to identify the short-selling opportunity or to exit long positions.
What is a Tweezer Top Candle?
A tweezer top is a bearish reversal candlestick pattern that typically appears after an uptrend, signaling buyers’ exhaustion. It is called a “tweezer top” because it consists of two consecutive candles, one bullish and another bearish, with equal or nearly equal highs, creating a visual “ceiling” that resembles a pair of tweezers. It belongs to the double-candlestick reversal pattern category in candlestick analysis.
Is Tweezer Top Bullish or Bearish?
The tweezer top is a bearish candlestick pattern that forms at the top of the uptrend and reflects a potential shift in the trend from bullish to bearish. When the confirmation candle closes below the low point of the pattern, it suggests a trend reversal. Traders often look for short selling or exiting of long positions after the formation of a tweezer top.
Structure of a Tweezer Top Candlestick
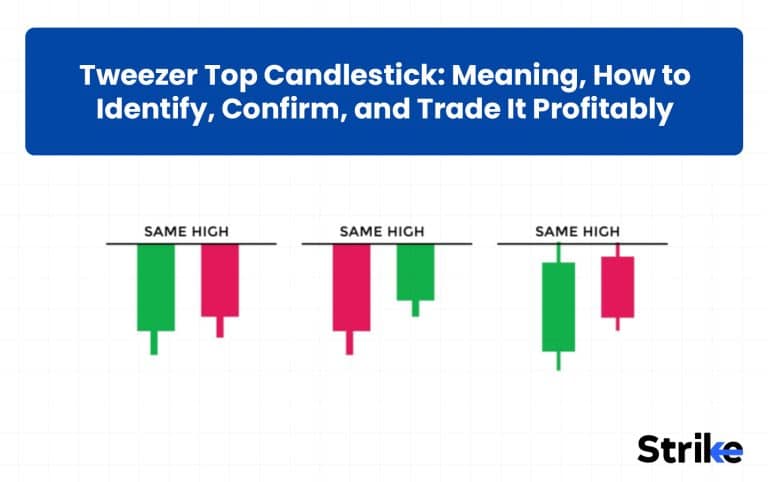
Tweezer Top consists of two consecutive candles having identical highs, where the first candle is a bullish candle and the other candle is a bearish candle.

- First Candle (Bullish Candle): A strong bullish candle that appears in an existing uptrend signals buyers are still in control. This candle marks the new high of the existing trend.
- Second Bearish Candle: This candle opens near the close of the first candle and moves up to touch the high of the first candle and face rejection. This rejection forces the second candle to close red, indicating sellers’ entry at the high of the first candle.
However, the two candles in the tweezer top do not have to be perfectly symmetrical; some variations are accepted.

- Candles can be different sizes
- Wicks may vary slightly, but highs should align closely
As long as the highs are almost the same and the second candle shows rejection, the structure remains valid.
Psychology behind a Tweezer Top
Tweezer-top psychology reflects the battle between buyers and sellers, where sellers shift market control from buyers to sellers at specific price points. This sentiment shift happens gradually in three major steps.
- Buyer’s Confidence (First Candle): In an uptrend, buyers keep pushing prices higher to make a new high driven by confidence or optimism. At this stage, the market appears to continue the uptrend.
- Rejection from the Same Level (Second Candle): On the next candle, price reaches the same high as the first candle, and supply increases sharply due to smart money profit booking, sellers getting active, and late buyers panicking.
- Shift in Momentum: When the second candle closes bearish, buyers realize the breakout failed, late buyers feel trapped, and sellers gain confidence. This weakens the bullish momentum and shifts the trend from bullish to bearish.
This shift in sentiment indicates that buyers are losing control while sellers begin to dominate near resistance. As a result, bullish momentum weakens, and the chances of a potential bearish reversal increase.
What Does the Tweezer Top Indicate?
A tweezer top indicates the potential exhaustion of the uptrend and warns of an expected bearish reversal. It shows that buyers tried pushing the price higher twice but failed at nearly the same level, suggesting the strong selling interest.
How to Identify a Tweezer Top Candle?
There are four main criteria traders should watch to correctly identify a tweezer top pattern. These criteria include identifying a prior trend, two consecutive candles with equal highs, confirmation candle and location.

- Prior Trend: A tweezer top always appears after a clear uptrend. Without a prior uptrend, the pattern has less significance.
- Two consecutive candles with equal highs: The tweezer top pattern consists of two candles of opposite colors with equal highs. Equal highs are a key characteristic of tweezer tops, indicating seller participation.
- Confirmation: A bearish candle closing below the tweezer top pattern validates the pattern and confirms the shift in a trend from bullish to bearish.
- Check Location: The pattern is more reliable when it forms near resistance, prior swing highs, or overbought conditions.
These criteria help traders identify a valid tweezer top pattern among the different types of candlestick patterns and avoid false signals.
How to Scan for Stocks with the Tweezer Top Pattern?
To scan the tweezer top pattern, there are several charting andscreening platforms like Strike Money, Chartink, and TradingView that allow traders to detect this pattern automatically by applying specific technical criteria. Scanning for the tweezer top candlestick pattern helps traders quickly identify potential bearish reversal setups across multiple stocks instead of manually checking hundreds of charts.
The criteria to scan a tweezer top focuses on uptrends with two consecutive candles sharing near-identical highs (the first bullish, the second bearish).
- Uptrend filter: Price above 20/50 EMA.
- Matching highs: The last two candles should reach almost the same high price. The first candle is usually bullish, showing strong buying pressure, but the second candle fails to move higher, which signals that the price is facing resistance, meaning it is struggling to rise above a certain level.
By applying these simple criteria in a stock screener, traders can quickly narrow down stocks that may be forming a tweezer top pattern. This makes it easier to focus only on potential reversal setups and analyze them further before making a trading decision.
Where Does the Tweezer Top Appear in a Chart?
There are three major locations where tweezer top appear more often. The locations are resistance, near previous highs or all-time highs, and after extended rallies.
- At Resistance Levels: A tweezer top commonly forms near a strong resistance level where the price previously failed to break higher. This area represents sellers’ dominance and price rejection.
- Near Previous Highs or All-Time Highs: The pattern often appears near prior swing highs or all-time highs, where profit booking and fresh selling pressure increase.
- After Extended Rallies: When the price rallies aggressively, a tweezer top forms at the peak, indicating exhaustion and a potential reversal.
The pattern is most meaningful when it forms at major resistance after an extended rally, not randomly within normal price fluctuations.
How Often Does the Tweezer Top Candlestick Pattern Happen?
The tweezer top pattern is not very common in its original form, particularly on higher timeframes. Statistical studies show that it is a relatively rare pattern compared to many other candlestick formations.
A large backtest by candlescreener on stocks from the S&P 500 using daily candles between 2010 and 2015 analyzed 614,034 candlesticks and found 3,209 Tweezer Top occurrences, which equals about 1.93% of all candlestick patterns identified in the dataset. On average, the pattern appeared once every 191 candles per stock, meaning traders might see it only occasionally on daily charts.
What Timeframe Is Best for Tweezer Top?
The best timeframe for tweezer top is generally the higher timeframe, such as hourly, daily, and weekly. Such timeframes typically reflect strong market participation and institutional activity. Price rejecting twice from the same level on a higher timeframe shows a genuine resistance, whereas on a lower timeframe, equal highs can form randomly due to volatility.
| Timeframe | Reliability | Best For | Notes |
| Daily / Weekly | High (Most Reliable) | Swing trading, positional strategies | Preferred by retail and institutional traders; less market noise, stronger confirmations |
| 4-Hour | Strong | Intraday to short-term swing trading | Offers a good balance between frequency and reliability |
| Hourly / Minute | Moderate to Lower | Day trading/scalping | More frequent signals but prone to whipsaws; must combine with volume and higher timeframe confirmation |
How to Confirm an Tweezer Top Signal
There are three main criteria to confirm the tweezer top signal. The criteria include a confirmation candle after a tweezer top, alignment checking, and volume analysis.
- Confirmation Candle: Wait for the third bearish follow-through confirmation candle after the tweezer top to close below the pattern’s low to validate seller dominance.
- Check for Alignment: Check whether the pattern formed aligns with resistance levels like prior highs, Fibonacci retracements, or order blocks in Smart Money Concepts.
- Volume and Indicator Check: Increasing volume during bearish candle formation indicates true rejection due to sellers’ dominance. Align it with indicators such as RSI above 70 or divergence to enhance reliability.
A tweezer top becomes highly probable only when price action, volume, and confirmation align together, especially when supported by divergence in momentum indicators. Wait for validation and trade with proper structure.
How Successful Is Tweezer Top?
The tweezer top pattern shows moderate reliability in predicting a bearish reversal when used in a wide market context. A backtested result from TradeSpider suggests the win rate is 55-60%, which can be further improved to 60-70% if traded in confluence with resistance or another technical indicator.
The success of the tweezer top also depends on the timeframe, where a higher timeframe is more reliable than a lower timeframe due to less market noise.
How to Trade Using the Tweezer Top Candlestick Pattern
There are four major steps to trade the tweezer top candlestick pattern. The steps include identifying the right market context, entry, profit target, and stop loss.
- Identify the Right Market Context: Look for a tweezer top after a strong and extended uptrend or near a key level. The pattern carries more weight when it forms near a key resistance level, a previous swing high, or a supply zone.

- Entry: Enter a short trade only after a confirmation candle closes below the low of the tweezer top pattern.

- Profit Target: Set the target at the next key support level, previous swing low, or 1:2 minimum risk-reward ratio. You can also trail the profits using EMA (Exponential Moving Average) if the price continues to have bearish momentum.
- Stop-Loss: Put the stop-loss above the high of the tweezer top candlestick pattern or 1-1.5x ATR.
The tweezer top pattern becomes more reliable when it is combined with market context and confirmed using an indicator.
Is Tweezer Top Candlestick Profitable?
Yes, the tweezer-top candlestick pattern is profitable, but only when it is traded with a proper market context, such as confirming signals from other technical indicators or patterns that suggest a potential reversal in the market trend.
According to Thomas Bulkowski’s Candlestick Encyclopedia, the tweezer-top candlestick pattern has a success rate of 56%, meaning it offers a statistical edge. However, this edge is only helpful when traded properly within the market context and with a minimum RR of 1:2.
Common Mistakes to Avoid with Tweezer Top
There are four common mistakes to avoid when trading with a tweezer top. The mistakes are briefly mentioned below.
- Ignoring Trend Context: A tweezer top is more reliable after a strong uptrend. Trading it randomly in the middle of the price reduces its effectiveness.
- Using It in Sideways Markets: In a sideways market, multiple similar heights can be formed without real reversal.
- Placing Tight Stop-Losses: Sometimes minor volatility can trigger your stop loss above the high of the tweezer top if the stop loss is tight.
- Overtrading Every Lookalike Pattern: Not every double candle is a tweezer top. Quality, location, and prior trends matter more than the appearance alone.
A tweezer top is powerful only when traded with context, patience, and proper risk management.
Difference between Tweezer Top & Tweezer Bottom
The difference between Tweezer Top & Tweezer Bottom is mentioned below in the table.
| Basis | Tweezer Top | Tweezer Bottom |
| Market Location | Forms at the top of an uptrend | Forms at the bottom of a downtrend |
| Signal Type | Bearish reversal signal | Bullish reversal signal |
| Candle Structure | Two candles with nearly equal highs | Two candles with nearly equal lows |
| Market Psychology | Buyers fail to push price higher; sellers gain control | Sellers fail to push price lower; buyers gain control |
| Expected Direction | Potential downward move | Potential upward move |
| Best Confirmation | Bearish candle close, RSI below 50, resistance level | Bullish candle close, RSI above 50, support level |
Both patterns reflect rejection at key price levels. The difference is simply who gains control—sellers at the top in a tweezer top, or buyers at the bottom in a Tweezer Bottom pattern.
What Are Other Candlesticks Besides Tweezer Top?
The other candlestick patterns besides tweezer top, which signals bearish reversal, include bearish engulfing, evening star, shooting star, hanging man, and dark cloud cover.
- Bearish Engulfing: A two-candle pattern where one large bearish candle engulfs the previous bullish candle, signaling a strong shift in momentum from buying to selling.

- Evening Star: A three-candle pattern that forms after an uptrend and signals a gradual shift in momentum from bearish to bullish.

- Shooting Star: Shooting star is a single candlestick pattern with a small body and long upper shadow indicating buyers initially pushed the price higher, but aggressive sellers forced the price back down near resistance.

- Hanging Man: Hanging Man is a single candlestick pattern with a small body and long lower shadow, suggesting that sellers are beginning to challenge the buyers to reverse the trend.

- Dark Cloud Cover: A two-candlestick pattern where a bearish candle opens above the previous high of the bullish candle but closes deep into its body, indicating growing selling pressure.

Each of these candlestick patterns—such as Bearish Engulfing, Evening Star, Shooting Star, Hanging Man, and Dark Cloud Cover—reflects a potential shift in market sentiment from buyers to sellers. When used with trend analysis, support-resistance levels, and confirmation signals, they can help traders identify high-probability bearish reversal opportunities.


 Previous Article


![15 Investing.com Alternatives [Free+Paid] You Should Use in 2026](https://www.strike.money/wp-content/uploads/2026/04/Investing.com-Alternatives.jpg "15 Investing.com Alternatives [Free+Paid] You Should Use in 2026 44")
![15 TradeStation Alternatives [Free+Paid] You Should Use in 2026](https://www.strike.money/wp-content/uploads/2026/04/TradeStation-Alternatives.jpg "15 TradeStation Alternatives [Free+Paid] You Should Use in 2026 45")
![15 Chartink Alternatives [Free+Paid] You Should Use in 2026](https://www.strike.money/wp-content/uploads/2026/04/Chartlink-Alternatives.jpg "15 Chartink Alternatives [Free+Paid] You Should Use in 2026 46")
: Overview, 10 Types of Indicators, Settings for Different Markets 47")


 : Definition, Formula, calculation, Uses, Advantages Vs limitations 50")


No Comments Yet.