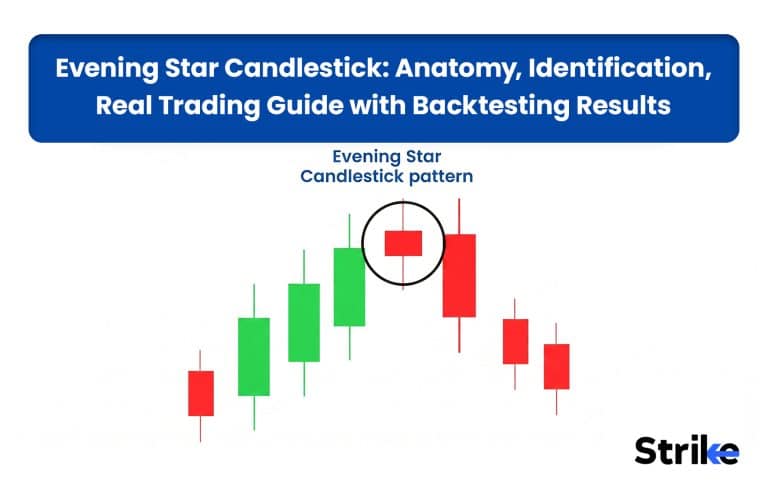
Evening star is one of the most popular bearish reversal candlestick patterns that helps traders understand psychological shifts in the market. Evening star pattern is widely used by traders to identify potential end of uptrend, lock profits or to initiate a short position.
However, the evening star pattern does not always work and hence it is important to understand how to separate the high probable evening star from weak once. In this blog you will learn how to identify, trade, its psychology, confirmation techniques, historical performance, reliability, common mistakes, and real chart examples.
What is the Evening Star Candlestick Pattern?
Evening star is a triple candle bearish reversal candlestick pattern commonly used in technical analysis to spot bearish reversal. This pattern typically appears at the end of the uptrend and signals gradual shift in market trend from bullish to bearish.
A prior uptrend should rally a minimum 7- 10% within a span of 10-15 days for a valid evening star formation.
Why This Candlestick is called an “Evening Star”?
This pattern is called evening star because it resembles the appearance and behaviour of planet venus (often called as evening star).
Planet venus (evening star) appears after the daylight and just before the nightfall, marking the transition between day and night. Similarly the evening star candlestick pattern appears after the uptrend and just before downtrend, marking the transition between uptrend and down trend.

Anatomy & Psychology Behind the Evening Star Pattern
Evening star pattern is a three star candlestick pattern that reflects the gradual shift of power from buyers to sellers. The structure and psychology behind each candle pattern is briefly discussed below.

- First Candle: A strong bullish candle within an existing uptrend, signalling a buyer’s confident and positive sentiment. At this time, sellers mostly remain inactive and new buyers keep entering the market in FOMO. We have observed that the first candle with an average of 1.5 – 2.2% body size on daily charts provides high-quality setups.
- Second Candle: Here the bullish momentum starts to fade. The second candle has a smaller body which can be either bullish, bearish or doji. This small candle represents market indecision, where buyers are no longer actively pushing price higher and on top of that the early profit booking starts to emerge. At this stage the balance between buyers and sellers gets more even. If the second candle forms a doji, the accuracy of the pattern increases by 50-60% compared to a small body candle.
- Third Candle: At this stage sellers take control. The third candle is a strong bearish candle that closes into the body of the first bullish candle of the pattern. This strong red candle shows that sellers have taken control of buyers and previously long-position traders also started exiting.
This is how a market sentiment shifts from optimism to caution or fear. If there is a gap between candles, the signal gets even stronger. The strength of the pattern also depends on how low a third candle closes. If the third candle closes below the midpoint of the first candle, it increases the probability of followthrough selloff by 60-70%.
What Does the Evening Star Pattern Indicate?
The evening star pattern indicates a gradual shift in market sentiment from bullish to bearish. It indicates that the buyers are now exhausted after a strong uptrend and increasing selling pressure can make the trend to reverse.
It is also important to note that if the evening star pattern forms in a strong uptrend, the trend will turn bearish, but within a short period of time, the trend will reverse back to bullish, giving you either a breakeven or a loss making trade. The evening star does not predict the magnitude of the fall, but on an average the price falls by 5-7% on an average on a daily chart.
Is Evening Star Bullish or Bearish?
Evening Star is a bearish reversal triple candlestick pattern which signals the change in trend from bullish to bearish. After an evening star formation traders either look to bok their existing profits or to create short positions.
How to Identify an Evening Star Pattern Accurately?
There are four important steps to identify an evening star pattern accurately. The steps are trend identification, checking the first candle, second candle, third candle, and confirmation.

- Trend Identification: A valid evening star pattern always forms after the prolonged or decent uptrend. So before you identify an evening star pattern, identifying the prior trend is more important.
- Check First Candle: A first candle should be a strong bullish candle with a decent length and minimum wick.
- Check Second Candle: In a perfect evening star pattern, the second candle should open gap-up and should form a small real body, less than 35% of the first candle’s body. This second candle can be either bullish, bearish or doji. However, if the second candle does not open gap-up, you can still consider it if you get a confirmation signal.
- Check Third Candle: It is the most important candle that confirms and completes the evening star pattern. A third candle should be a strong bearish candle that closes at least 50% into the body of the first candle. If you find an evening star where the third candle closes below the low of the first candle, it is often marked as the strongest evening star pattern.
- Confirm the Pattern: Confirm the pattern using volume or a confirmation candle. A pattern should have a high volume during the first candle of pattern followed by a low volume during the second indecisive candle and then again a high volume on the third bearish candle.
You can confirm the pattern using a confirmation candle, as is standard with many Candlestick Patterns, where the next candle should close below the low of the evening star. The reliability of such Candlestick Patterns increases if they form during an RSI overbought condition or near key technical levels like support or resistance.
What Makes a Perfect Evening Star Pattern?
There are three major features in the evening star pattern that makes it a perfect evening star pattern. The features are strong uptrend, gaps and doji.
- Strong Uptrend: A perfect evening star often forms after a strong uptrend.
- Gaps: A perfect evening star has a gap between the candles. The second candle opens gap-up while a third candle opens gap down.
- Doji: In a perfect evening star pattern the second indecisive candle is doji, instead of a small real body candle.
Above mentioned features separate the perfect evening star with a normal evening star pattern. Remember, even if the evening star is perfect, it can still fail.
How do We Trade the Evening Star Pattern? [With Real Example]
There are five simple steps to trade the evening star pattern. The steps include evening star identification, confirmation, entry, stop-loss and target.
- Evening Star Identification: First identify the valid evening star pattern using the steps discussed above. It’s even better If the pattern appears near the resistance or at the RSI overbought zone. Here we have taken the example of Laura’s Labs Ltd. After a strong rally, stock formed an evening star pattern near the level of 600, where the first and second candle had an upper wick showing selling pressure.

- Confirm the Pattern: Instead of entering immediately after evening star candle forms, wait for the next candle (confirmation candle) to close below the low of the evening star pattern. However, if you are an aggressive trader, you can enter a trade as soon as a pattern forms without waiting for a confirmation candle, but this will increase the chance of failure.

- Enter: You can either take an conservative entry or an aggressive entry. In conservative entry, you enter the trade after the pattern is confirmed by a confirmation candle, while in aggressive entry, you enter a trade immediately after the pattern forms without any confirmation. In our example, we entered at ₹571, after the pattern got confirmed by a confirmation candle.

- Stop-Loss: Stop-loss is usually placed above the top of the pattern. We placed our stop-loss at ₹607.
- Set Profit Targets: Profit targets can be set near the previous support level, previous swing low, 1:2 or 1:3 risk-reward, moving averages or a fibonacci retracement levels. We aimed for a 1:2 profit target at ₹497.
Remember, do not put stop-loss immediately above the patterns high. Keep 0.3 – 0.5% buffer area to avoid getting wicked-out.
Our Backtesting Results with Evening Star Pattern
We, at Strike Money, manually backtested the 100 Evening Star pattern on NSE-listed large and mid-cap stocks to determine whether it consistently identifies bearish reversals. We found that the standard Evening Star pattern delivered a 61% win rate when traded only after a confirmed bearish breakdown. However, when we added an additional filter of RSI above 70 (overbought) before the pattern formed, the setup became more selective and produced better-quality trades, with the win rate improving to 69%.
| Backtest Setup | |
| Backtest Parameter | Details |
| Pattern Tested | Standard Evening Star Pattern |
| Market | NSE-listed large and mid-cap stocks |
| Timeframe | Daily chart |
| Trade Direction | Short / bearish setup |
| Entry Rule | Sell after price closes below the Evening Star low |
| Alternative Entry | Sell on a pullback after breakdown |
| Stop-Loss Rule | Above the Evening Star high |
| Target Rule | Minimum 1:2 risk-reward or next support |
| Risk Rule | Minimum 1:1.5 risk-reward |
| Confirmation Used | Prior uptrend, bearish confirmation candle, volume, RSI filter |
| Avoided Setups | Sideways markets, weak confirmation, low-volume patterns |
Backtest Logic
The strategy followed 8 fixed rules.
- Identify a strong prior uptrend.
- Confirm a valid Evening Star formation.
- Prefer setups where RSI is above 70 before the reversal.
- Wait for a bearish close below the pattern’s low.
- Enter on the confirmation candle or pullback.
- Place the stop-loss above the pattern’s high.
- Target the next support or maintain at least a 1:2 risk-reward.
- Exit early if a strong bullish reversal appears.
| Backtest Result Summary | ||
| Metric | Standard Evening Star | Evening Star + RSI > 70 |
| Total Patterns Tested | 100 | 62 |
| Winning Trades | 61 | 43 |
| Losing Trades | 39 | 19 |
| Win Rate | 61% | 69% |
| Average Risk-Reward | 1:2.0 | 1:2.2 |
| Average Winning Trade | 6.8% | 7.3% |
| Average Losing Trade | 3.4% | 3.2% |
Key Findings
- Our manual backtest produced a 61% win rate using the standard Evening Star pattern.
- Adding an RSI overbought (70+) filter increased the win rate to 69%.
- Pullback entries offered better risk-reward than chasing the initial breakdown.
- High-volume confirmation further improved reliability.
- Evening Star patterns after extended uptrends outperformed those inside ranging markets.
- Sideways markets remained the biggest source of false signals.
How Reliable is the Evening Star Pattern?
Evening star pattern is one of the most reliable candlestick patterns but only when it is traded with the right market context. Research by Thomas Bulkowski found that the pattern correctly signals a bearish reversal 72% of the time, ranking 10th out of 103 candlestick patterns for reversal accuracy. Bulkowski’s study was based on almost 5 million candle lines, making it one of the most extensive candlestick pattern studies available.
Apart from market context, the reliability of evening star patterns also heavily depends on timeframe, confluence, and the location.
How do you Confirm an Evening Star pattern?
You can confirm an evening star pattern by confirming the prior uptrend, waiting for the third candle to close, checking volume, RSI or MACD, and key resistance level.
- Confirm the Prior Uptrend: First check whether the prior trend is bullish because a valid evening star only forms after a strong uptrend. If pattern forms in a sideways market, avoid analysing it further.
- Wait for the Third Candle to Close: It is the most basic criteria to confirm evening star pattern. A third candle should close below the midpoint or below the body of the first candle. If the third candle closes less than 50% of the first candle body, the pattern can be less effective.
- Check Volume: If you get the third bearish candle closing within the body of the first candle, check whether the selling is supported by volume more than average, usually 1.5 to 2X more than average. A sharp rise in volume during the third candle confirms the pattern.
- Confirm with RSI or MACD: To increase the conviction further, you can also use indicators like RSI or MACD. If the evening star forms near the RSI overbought zone (above 70) or during a bearish divergence, it adds additional confirmation to the pattern.
- Look for a Resistance Level: Identifying the pattern’s appearance at key levels like resistance zones or overbought zones further strengthens its signal. An Evening Star forming exactly at a known resistance level is far more reliable than one forming in open price space.
From now onwards, before looking at trading evening star patterns, check for these five criteria to filter out the genuine evening star pattern.
Which Indicators work Best with Evening Star?
The indicators that work best with evening star patterns are RSI, MACD, Moving Averages, Volume and Bollinger Bands.
- RSI (Relative Strength Index): Evening star formation while RSI is in an overbought zone (above 70) has a higher chance of reversal, because RSI overbought indicates that the price is stretched and due for a reversal. Evening star forming during RSI divergence also has a high probability of reversal.

- MACD: As MACD helps traders to identify the change in momentum, it can be used to confirm the evening star pattern. An evening star pattern followed by a MACD bearish crossover has a more confirmed signal.

- Moving Averages (50-day / 200-day): Moving averages act as a dynamic support and resistance. If the evening star forms near the moving average in a downtrend, it suggests that the price is facing resistance near the moving average and the trend will most likely reverse. Also, if the third candle of the evening star pattern closes below moving averages, it means sellers are gaining control.

- Volume: It is the most important indicator which helps to confirm whether the pattern is really supported by strong selling. If there is a marked increase in trading volume on the third candle, it shows that there are enough sellers trying to push down prices.

- Bollinger Bands:If the evening star pattern forms outside of the upper band of the Bollinger Bands, it indicates that the price will likely reverse back toward the mean. This interaction with the Bollinger Bands suggests that the price has become overextended and is due for a reversal inside the bands.

| Indicator | What to Look For |
| RSI | Above 70 or bearish divergence |
| MACD | Bearish crossover confirming momentum shift |
| Moving Averages | 3rd candle closes below 50/200 MA |
| Bollinger Bands | Star candle touches/pierces upper band |
| Volume | Spike on the 3rd bearish candle |
| Resistance Levels | Pattern forms at a key resistance zone |
The more of these align together, the stronger and more reliable the Evening Star signal becomes.
Common Mistakes to Avoid with Evening Star Pattern
There are five common mistakes to avoid while trading evening star patterns. These mistakes are briefly discussed below.
- No Prior Uptrend: The pattern is only valid if it appears after a strong uptrend. Avoid trading evening star patterns if they appear in a sideways market.
- Entering Too Early: Many traders enter the trade after the formation of the second candle to catch the top, anticipating the third candle will complete the evening star and the trend will reverse. Entering without confirmation leads to unnecessary loss.
- Skipping Volume & Indicators: Skipping indicators like volume and RSI can make you enter a weak evening star pattern. Using indicators, especially volume, improves pattern conviction and winning probability.
- Poor Stop-Loss Placement: Even though you found a perfect evening star pattern, reversals are still not guaranteed and hence stoploss placement plays a major role. Place your stoploss a few points above the high of the pattern to avoid losses due to pattern failure.
- Using It on Low Timeframes: Evening star patterns on lower timeframes are generally less reliable and only works when aligned with a proper market context. Trade evening stat patterns cautiously on a lower time frame and combine proper market context before trading.
Hence, by avoiding above mentioned mistakes and trading the pattern with write market context, you eliminate the risk of unnecessary losses.
What Happens when an Evening Star Fails?
When an evening star pattern fails, the expected bearish trend reversal does not occur and price again starts to rise in upward direction. This failed breakout of the evening star often leads to continuation of the bullish trend driven by fresh breakout buying and bearish traders short covering. This suggests that the pattern was just a brief pause and a buying pressure is still very strong.
Which is stronger: Evening Star or Bearish Engulfing?
Evening star pattern is the strongest bearish reversal pattern compared with bearish engulfing because evening star is a three candle pattern and hence holds more data, whereas bearish engulphing is a two candle pattern and holds less data.
Evening star, being a three-candle pattern, tells a complete story of a trend shifting from bullish to hesitation and finally to bearish. On the other hand, a Bearish Engulfing pattern is more immediate; however, a Bearish Engulfing is also more likely to be a fake-out if it is not confirmed with strong trading volume.
What are the Other Popular Triple Candlestick Patterns?
The other reversal candlestick pattern apart from the evening star is morning star, three white soldiers, three black crows, three inside up, three inside down, three outside up, and three outside down.
- Morning Star: It is a bullish reversal three candle pattern that forms near the end of the downtrend. This pattern has the large red candle, followed by a small bodied candle, followed by a large green candle. The Morning Star is exactly opposite of the evening star pattern and suggests the exhaustion of sellers. As a bullish reversal signal, the Morning Star indicates that the downward momentum has stalled and buyers are beginning to take control.

- Three White Soldiers: It is also a bullish reversal three candle pattern which is formed by three consecutive large green candles, each closing higher than the last. This suggests strong buying pressure near the bottom, which could eventually lead to the formation of three white soldiers as a bullish reversal appears. When three white soldiers follow this initial pressure, it confirms that a significant change in trend direction is underway.

- Three Black Crows: This pattern is exactly opposite to the three white soldiers pattern and has three consecutive large red candles, each closing lower than the last. It appears near the end of an uptrend, signaling strong selling pressure that often precedes the formation of three black crows. Once three black crows appear after this exhaustion, it confirms a definitive shift from a bullish to a bearish market trend.

- Three Inside Up: A bullish reversal pattern where the first candle is a large red candle, followed by a smaller green candle that stays within the range of the first candle. In the three inside up pattern, the third candle forms a large green candle that closes above the high of the first red candle. This successful close in the three inside up formation provides the necessary confirmation for a bullish reversal.

- Three Inside Down: It is the exact opposite of the three inside up candle pattern and suggests a bearish reversal. A large green candle, followed by a smaller red candle that stays within the range of the first candle. In a Three inside Down setup, the third candle is a large red candle that closes below the low of the first green candle. This final candle in the Three inside Down pattern confirms that the bears have successfully taken control of the market.

- Three Outside Up: A strong bullish reversal pattern where a first candle is a small red candle, followed by a strong green candle which completely engulfs the first candle showing strong buying pressure. In the Three Outside Up formation, the third candle confirms the pattern by closing even higher than the second candle. This additional upward momentum in the Three Outside Up pattern provides traders with stronger conviction for a bullish reversal.

- Three Outside Down: A strong bearish reversal pattern where a first candle is a small green candle, followed by a strong red candle which completely engulfs the first candle showing strong selling pressure. In the Three Outside Down formation, the third candle confirms the pattern by closing even lower than the second candle. This sustained selling pressure in the Three Outside Down pattern validates the bearish reversal signal for traders.

The success of Triple Candlestick patterns also depends heavily on context, including the prevailing trend, nearby support or resistance, trading volume, and confirmation from other technical indicators like RSI, MACD, or moving averages to validate these Triple Candlestick patterns.


 Previous Article


![15 Investing.com Alternatives [Free+Paid] You Should Use in 2026](https://www.strike.money/wp-content/uploads/2026/04/Investing.com-Alternatives.jpg "15 Investing.com Alternatives [Free+Paid] You Should Use in 2026 76")
![15 TradeStation Alternatives [Free+Paid] You Should Use in 2026](https://www.strike.money/wp-content/uploads/2026/04/TradeStation-Alternatives.jpg "15 TradeStation Alternatives [Free+Paid] You Should Use in 2026 77")
![15 Chartink Alternatives [Free+Paid] You Should Use in 2026](https://www.strike.money/wp-content/uploads/2026/04/Chartlink-Alternatives.jpg "15 Chartink Alternatives [Free+Paid] You Should Use in 2026 78")
: Overview, 10 Types of Indicators, Settings for Different Markets 80")

 : Definition, Formula, calculation, Uses, Advantages Vs limitations 82")


No Comments Yet.