Super Trend indicator is one widely used tool to determine the stock’s overall trend. The super trend is calculated using the stock’s closing price and the ATR (Average True Range) multiplier. The ATR measures the average volatility over a specific period of time. The Super Trend uses a multiple of this ATR value to identify the upper and lower trendline bands.
This is a very versatile indicator, as the multiplier can be adjusted so that the investor can use it for either short term or long term trend identification. A higher multiple means that the trendlines will be more sensitive and will pick up early signals. A lower multiple makes the trendlines less sensitive and the investor will see less signals, but they will be more reliable. It can be used on intraday time frames for very short term trading, and also on daily or weekly timeframes for longer term investing.
The best thing about the Super Trend is that it does a great job of filtering out noise from random price fluctuations so that the true trend can be identified. By tweaking the settings of the Super Trend, traders can use this and other indicators to identify early trends or wait for a second indicator to confirm the trend and potentially reduce risk. It is a great tool to use in a trend following strategy, allowing the traders to enter a trade early or wait and capture a momentum move.
As the retail participation has increased, retailers overly depend on super trend, so randomly on lower time frames, it often generates false signals due to volatility and trapment of retail positioning. Thus it must be used as a conformational tool.
What is a Super Trend Indicator?
A Super Trend indicator is a technical analysis tool used to determine the overall trend direction of an asset. The super trend indicator provides buy and sell signals based on trend reversals. The Super Trend indicator consists of two bands – an upper band and a lower band.

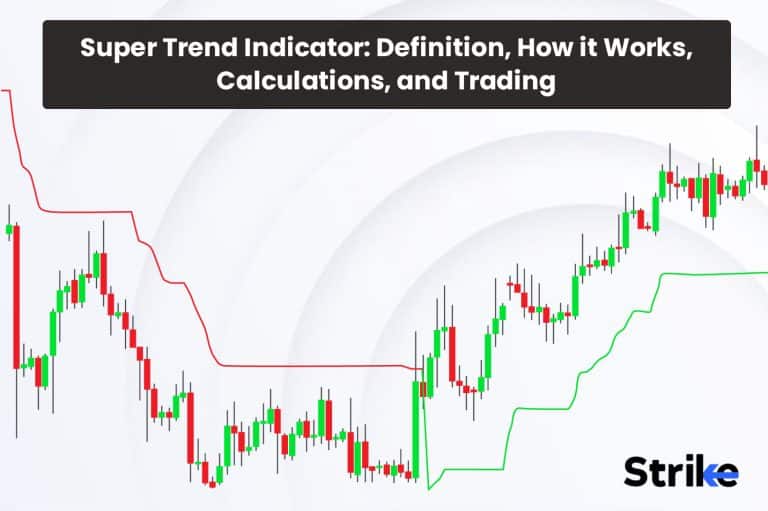
The green line represents the uptrend and the red line represents the downtrend. As long as the price stays within these bands, the current trend is considered intact. The price crossing the green line indicates a reversal from downtrend to uptrend and triggers a buy signal. The price crossing the red line indicates a reversal from uptrend to downtrend and triggers a sell signal.
The Super Trend bands are calculated based on the stock’s closing price and the Average True Range (ATR). The ATR represents the volatility of the stock. A higher ATR means the stock is more volatile, so the Super Trend bands will be wider. A lower ATR means lower volatility, so the bands will be narrower. An N-period ATR is typically used, where N is 7, 10, 14 or another number depending on sensitivity. Then a multiplier, typically 2 or 3 times the ATR value, is used to plot the upper and lower bands. This ATR band is compressed into one single line.
How does the Super Trend Indicator work?
The Super Trend indicator works by plotting upper and lower trendline bands based on a stock’s closing price and an N-period Average True Range (ATR). Let us examine how it operates more closely.
These ATR bands are compressed into one single line.
So if the color of the line shifts to green from red, it represents potential trend reversal from bearish to bullish side. The trend stays bullish until the color changes. Vice versa to this;
If the color of the line shifts to red from green, it represents potential trend reversal from the bullish to bearish side. If the price consolidates, the super trend will provide false signals and thus, supertrend should be used in conjunction with different time frame analysis based on price action methods, candlestick patterns and other technical indicators. This indicator continuously tracks trend reversals as prices fluctuate and trends shift.
This indicator offers easy use with great potential when used properly.

In the chart uploaded above, one can observe that, this is the Daily time frame of Nifty 50 index. This supertrend color signifies important information regarding the trend of the script. On a daily time frame, when the color shifted to red, this suggested a bearish trend may kick in. Traders can use this information and find shorting opportunities on lower time frame analysis and using other technical indicators. Vice versa to the upside.
Strike.money is one of the finest scanners available for Indian Stock Markets. If you run a scanner named supertrend scanner under technical scanners, it will display the list of all the stocks that are fulfilling the conditions of supertrend.
The scanner will run and display the stocks as per the selected condition.
Strike.money provides The drop down menu, 1hr, daily, weekly and monthly time frames can be selected and the scanner will display the stocks based on selected time frame and signal (bearish or bullish).

In the image uploaded above, the scanner displayed the list of stocks as per the selected conditions, the selected conditions are Hourly time frame and bullish reversal. One can observe from the past performance, the price dropped sharply and the supertrend changed its color from red to green. Using this information, traders could have deep dived into lower time frame analysis using price action and other technical indicators to take a high probability trading setup.
Similarly, these are the number of stocks that are showing either the new color change from red to green or the existing green color.
Why is Super Trend Indicator important in Technical Analysis?
The Super Trend indicator is important in technical analysis because it clearly displays the prevailing trend. Based on where the price lands relative to supertrend color and other measures, traders postulate trading plans to initiate a setup.
Super Trend also provides early trend reversal signals.
Super Trend is highly adaptable and is applied across any timeframe from 1-minute charts to daily or weekly charts, making it suitable for short-term trading and long-term investment alike. Though due to current volatility and ranging markets, super trend often generate false trading signals. Thus it should be used in conjunction with different time frame analysis and indicators to generate a high probability trading opportunity.
Super Trend bands filter out noise. It is an accessible, straightforward indicator, with only a few settings to adjust and easy interpretation, making it perfect as the basis of trading strategies with minimal time investment in learning how to effectively employ it. Super Trend works well when combined with other indicators, like RSI, MACD, or moving averages to enhance signal accuracy and create a robust trading strategy. Multiple indicators providing similar signals add confidence.
What is the formula for the Super Trend Indicator?
The Super Trend indicator consists of two bands – an upper band and a lower band. The formula to calculate these bands is
Upper Band = Closing price + (ATR multiplier * ATR)
Lower Band = Closing price – (ATR multiplier * ATR)
Where Closing price = The closing price of the selected time period (day, hour, minute, etc.)
ATR = Average True Range over a specified number of periods. For example, 10-day ATR or 14-day ATR. ATR is a measure of volatility, calculated as:
ATR = (High – Low) of the period + (High – Previous Close) + (Low – Previous Close) / 3
ATR Multiplier = A value, typically 2 or 3, to multiply with the ATR. A higher multiplier creates wider, more sensitive bands. A lower multiplier creates narrower, less sensitive bands.
For an uptrend, the closing price will remain above the lower band. For a downtrend, the closing price will remain below the upper band. Rhe closing price rising above the upper banb triggers a buy signal indicating reversal from downtrend to uptrend. The closing price falling below the lower band triggers a sell signal indicating reversal from uptrend to downtrend.
Once a new trend starts, the bands switch positions. The upper band becomes the lower band for uptrend and vice-versa for downtrend. The key is to optimize the ATR period and multiplier for the stock and timeframe based on historical data. Some common values are7, 10, 14 days
And multiplier 2, 2.5, 3.
Lower values will generate early but more frequent signals, while higher values will generate fewer but potentially more reliable signals. The Super Trend formula is simple but effective in determining trend reversals. With practice, traders achieve a high degree of accuracy from this indicator.
How to Calculate Super Trend Indicators?
The Super Trend indicator is calculated using the following steps.
1. Calculate the Average True Range (ATR) of the stock. ATR measures its true range over recent periods – it represents its highest point. ATR should then be divided by N periods (if n). Finally, find its True Range; that would be its maximum true range point in recent periods.
2. Calculate the median of all current highs minus current lows, as well as all past, closes over n periods to find its median price.
3. Calculate an ATR multiplier which usually ranges between one and two depending on the volatility of the stock, using higher multipliers for more volatile stocks.
4. Calculate an upper trend line by adding ATR multiplied by the multiplier to the median price and subtracting ATR multiplied by the multiplier from the median price. To calculate the lower trend line, reverse this process and subtract ATR multiplied by the multiplier from the median price.
5. Calculate a signal line which serves as the midpoint between upper and lower trendlines. The price moving above or below the signal line triggers buy or sell signals accordingly. It gives buy signals when price moves above the signal line indicating an uptrend and sell signals when price moves below the signal line suggesting a downtrend.
The Super Trend indicator helps traders to recognize new market trends while filtering out minor fluctuations, and providing entry and exit signals for trading strategies. Tuning parameters include the number of periods for ATR and multiplier. Adjusting these will change its sensitivity.
How to trade using a Supertrend Indicator?
To trade using super trend, these are the steps that are expected to follow:
- Determine whether the prevailing trend is an uptrend or downtrend and wait for price to close above or below signal line to indicate any shift.
- Once a trend is identified, wait for its price to retrace towards its signal line; this indicates an entry point into that particular direction of trend.
- If the supertrend indicator shifts its color, traders dive deep in lower time frame to analyze the current price action and the information from other technical indicators and candlestick patterns are gathered.
- Stocks are screened and scanned for necessary conditions to be fulfilled and a suitable trading plan is postulated. After the trading plan, executionary level trading setups are selected and trades are initiated taking into account appropriate risk management.
- Exiting the trade depends on the strength of the trend and risk management module.
Set trailing stop loss as the price moves in your favor, trailing it below swing highs (in an uptrend) and above swing lows (in a downtrend).

The above chart represents the supertrend color changing to Green from Red on a Daily Time Frame of the script named Nifty 50.

The chart uploaded above is the hourly (1 h) time frame of Nifty50. The blue line represents the turn of trend from bearish to bullish on a daily time frame.
The black horizontal line is an appropriate resistance level on a daily time frame.
The breakout candle is a strong hourly candle that has closed above the resistance with enough pressure and also is in a proper uptrend.
Lower time frame analysis would have provided a high quality opportunity to go long at this break. Break and retest on a lower time frame, suppose 5min, would have given this winning setup.
Super trend cannot be used alone as it can generate false signals in a volatile market or a consolidating market.
This is how super trend can be used alongside price action, other technical indicators, tools and candlestick patterns to take high probability winning setups. Also follow sound financial management principles such as maintaining at least a 1:2 risk/reward ratio in money management decisions.
What are the different Super Trend Indicators?
There are five main super trend indicator versions.
Standard Super Trend Indicator
This is the basic version discussed earlier. It uses the ATR and median price to plot the upper and lower trend lines. It gives trend change signals when price crosses over the signal line.
Super Trend Pro
This advanced version adds some additional features to reduce whipsaws. It includes price smoothing using an exponential moving average. This makes the trendlines less reactive to minor price changes. It also has a trend anticipation mechanism which generates signals when a reversal pattern forms and price is still crossing over. This helps enter trends earlier. There is also an option to adjust indicator sensitivity independently for uptrends and downtrends. For example, you have a higher sensitivity in downtrends compared to uptrends.
Dynamic Super Trend
The Dynamic Super Trend variant automatically adapts the indicator parameters based on the market volatility. The ATR multiplier adapts based on the ATR values. This fixes the issue of manually optimizing parameters. The sensitivity is dynamically adjusted to changing market conditions.
Multi-timeframe Super Trend
This plots the Super Trend lines based on ATR values from different timeframes. For example, it plots lines based on daily and weekly ATR to generate trend change signals. This produces fewer whipsaws as it filters out noise from lower time frames.
Super Trend Arrows
This version is a simplified indicator that only plots arrows and does not show the trend lines. It just shows the buy and sell arrows when trend changes are signaled. This declutters the chart and makes signals more prominent.
Super Trend Oscillator
Computes the price relative to the upper and lower trend lines and plots it as an oscillator. The movement of the oscillator indicates the underlying trend and momentum. It stays within the 0 to 100 range. Crossing above 70 indicates overbought and below 30 indicates oversold levels.
What are the factors that influence choosing a Super Trend Indicators setting?
There are two important settings to take into account when using the Super Trend indicator: period and multiplier. The period setting determines the number of price bars that are used in the calculations. Higher period settings will make the Super Trend line less responsive to price changes, while lower settings will make it more responsive. For short-term trading, a period of 10 – 3 price bars is often suitable. This 10-3 represents length (10) and factor (3). For swing trading, a period of 20-50 price bars is recommended, and for long-term trading, the period could reach 100-200 price bars.
The multiplier setting controls the sensitivity of the indicator to price changes. A higher multiplier makes the Super Trend less sensitive and thus, its line will reverse less frequently. On the other hand, lower multipliers make the indicator more sensitive and quicker to reverse. Ultimately, the Super Trend settings you choose will depend on your trading timeframe and style. For short-term trading, use lower period and multiplier settings. For medium-term swing trading, use moderate settings.
For long-term investing, higher settings are generally recommended. It may take some experimentation to find the settings that suit both your risk appetite and the volatility of the security you are trading. Start with standard ranges as a guideline before making adjustments based on how the indicator performs. Properly configured, the Super Trend indicator becomes a powerful tool in identifying new trends and reversals.
What trading strategy is best to use when trading the Super Trend Indicator?
Trend following strategy using super trend involves buying or selling securities based on the direction of trend as indicated by a Super Trend Indicator. Traders enter long positions when the Super Trend Indicator is below price in an uptrend; similarly, when it crosses above price in a downtrend. This strategy works best when the market is trending strongly in one direction; for instance, let’s say Nifty 50 Index’s Super Trend Indicator shows an uptrend with 10 periods and multipliers of 3, a trader could enter a long position when the price closed after the line became green as shown in the image below. But this won’t work in highly volatile market conditions. Thus analysis on different time frames alongside other technical indicators and tools should be considered before placing trades.

Reversal strategy involves taking positions in opposition to the current trend whenever Super Trend Indicator indicates a trend reversal. Traders enter short positions when Super Trend Indicator switches from an uptrend to downtrend and long positions when it switches from downtrend to uptrend.
What is the best time frame for trading the Supertrend Indicator?
Time Frame selection for using super trend indicator will depend on an individual trader’s goals and risk tolerance. Below we discuss three commonly utilized time frames.
1. Hour and 4-Hour Charts: These time frames are excellent for swing trading using the Supertrend indicator to detect medium-term trend changes and reversals on these timeframes. Many traders use 1-hour and 4-Hour time frames with this indicator for trading stocks and cryptocurrencies via swing trading strategies.
Daily charts: These are suitable for position trading on stocks, ETFs, and commodities. Daily charts with this indicator provide excellent coverage of major trend changes and reversals that occur daily, making this time frame ideal for positional trades in stocks, ETFs, and commodities.
Weekly Chart: Long-term investors using weekly charts for long-term investing should use weekly charts to track major trend cycles. The Supertrend indicator on weekly charts easily identifies uptrends and downtrends; additionally they’re useful in spotting trend changes to identify long-term investment timing opportunities.
It’s essential to select a time frame that reflects both your trading style and investment horizon. A short timeframe such as 1-hour or 4-hour works well for swing trading, while daily or weekly time frames tend to work best with position trading or long-term investing.
How does Super Trend differ from other Indicators?
The Super Trend indicator is a lagging indicator that follows price action, unlike moving averages which are smoothed price overlays. The Super Trend line will change direction only after the price trend has established itself. This results in fewer whipsaws compared to moving averages. It incorporates an accelerator multiplier that dynamically adjusts the distance of the indicator line from the price.
When prices are rising/falling rapidly, the indicator line moves further away from the price to reduce false signals. When price action slows down or stabilizes, the indicator line moves closer to the price. This adaptive mechanism makes the Super Trend more responsive to current market conditions. It uses a larger period setting which makes it more suitable for identifying medium to long-term trends. The larger period filters out short-term price noise and focuses on the primary trend. This makes the Super Trend ideal for swing traders and investors. The indicator has a built-in stop loss mechanism.
The placement of the stop loss is determined by the location of the Super Trend line relative to the price. This systematic stop loss management helps lock in gains when the trend reverses. The Super Trend gives clear buy and sell signals based on the interaction of the price and the indicator line.
As one of the most popular Swing Trading Indicators, a buy signal occurs when the price crosses above the Super Trend line, while a sell signal is triggered when it crosses below. This simplicity makes it one of the easiest Swing Trading Indicators to interpret and utilize within a systematic trading strategy.
Does the Moving Average work well in conjunction with the Super Trend Indicator?
Yes, moving averages work very well in conjunction with the Super Trend indicator. They provide confirmation of Super Trend signals and also help identify high probability trading setups. One way to combine the Super Trend and moving averages is to use a longer period moving average (e.g. 50 or 200 MA) to determine the primary trend. In the image below, the price crossed both the moving averages and also the super-trend shifted from red to green indicating strong opportunity to trade upside. The price might have provided ample opportunities on lower time frames and even on daily time frame, the price managed to give opportunity at the retest of the green 200 dma. Moving averages provide a lot of insights on different time frames. Lower time frame analysis and the status of super trend can be followed in various ways to generate a view.

Can Bollinger Bands be used with Super Trend Indicators to improve trading strategy?
Yes, Bollinger Bands is often used together with the Supertrend indicator to improve your trading strategy. The respective upper and lower bands may work as reversing points plus the middle band. The bands may also work as potential targets or the price may break these extremes to continue the prevailing trend.

What are the Benefits of Super Trend Indicators?
Below are five main benefits associated with using a super trend indicator, including its simplicity and its ability to get rid of market noises.
Simplicity
The Super Trend indicator is an easy and straightforward trend-following indicator. Its basic logic captures price movements when the price closes above or below an upper or lower band in its display.
Removes Market Noise
The Super Trend indicator plots trends against price fluctuations or market noise. By design, this indicator filters out minor price changes while showing current up or downtrend trends; helping traders stay focused on broad trends rather than getting distracted by minor price variations. Identification of Trend Reversals
A Super Trend line’s change from an uptrend to a downtrend or vice versa signals a possible trend reversal and is used as an entry signal early into any emerging new trends. The key is waiting for prices to also move past the Super Trend line towards this emerging new trend; together, this combination produces a robust trend reversal trading strategy.
Entry and exit points
The Super Trend indicator not only detects trends and reversals but also provides entry and exit points. The price closing above its upper band indicates a buy signal to enter an uptrend is given and when the price closes below its lower band a sell signal to exit a downtrend is triggered.
Super Trend works across timeframes
A major advantage of the Super Trend indicator is that it works on all timeframes from very short-term intraday charts through weekly and monthly ones, providing traders with options for both scalping and long-term trend following. Depending on which timeframe is being traded on,
In today’s era, the manipulation can be observed at a higher scale, thus, dependence on supertrend should be avoided.
The Super Trend indicator is an invaluable asset to trend traders due to its simplicity, noise filtering capability, trend reversal indicators, entry/exit signal generation capabilities as well as multi-timeframe applicability.
What are the Limitations of Super Trend Indicator?
The lagging super trend carries its biggest disadvantage. Below is an explanation of the same and the six main disadvantages of the super trend indicator.
Lagging indicator
The Super Trend indicator is based on moving averages and the average true range, which are lagging indicators. They incorporate past price data and signals generated may come later than the actual trend reversal in the market. This lag can potentially reduce profits or lead to missed trading opportunities for trend traders. The lag effect can be reduced by optimizing the parameters but cannot be eliminated entirely.
Fails in choppy market
Trend following indicators like Super Trend perform poorly in non-trending, choppy markets. The price is fluctuating within a range and not establishing a clear trend means the indicator generates multiple wrong signals, leading to losses. Traders should avoid using the Super Trend in range-bound or choppy market conditions.
Prone to false signals
The Super Trend indicator aims to filter out market noise, but it still sometimes generates false or erroneous signals at times. These false signals can mislead traders if they do not wait for price confirmation before entering a trade. Optimizing the parameters can reduce but not eliminate false signals.
Works best for mid to long-term trends
The Super Trend indicator works best for filtering out minor fluctuations and capturing mid to long-term trends. For short-term scalping or day trading, the signals sometimes come too late for traders to gain a profit from the trends. The indicator parameters need to be substantially reduced to adapt it for shorter time frames but that also makes it prone to generating more false signals. For short term trading, other technical tools may be more useful than the Super Trend indicator.
Cannot confirm the trend
The super trend indicator is useful to detect trends and reversals, but it cannot confirm the trend. Price action techniques like breakouts, support-resistance levels, chart patterns etc. need to be used in conjunction with the Super Trend to validate the trend signals and gain confidence in the generated reversal alerts or buy/sell triggers. The Super Trend should not be used alone to confirm trends as it can provide false reversals at times.
The Super Trend is a useful trend following indicator but suffers from certain weaknesses inherent in lagging, technical indicators. False signals, limitations in detecting short-term trends or range-bound markets, and the inability to conclusively confirm trends are some of the main drawbacks of the Super Trend indicator. Using good price action confirmation techniques, optimizing parameters for different instruments and timeframes, and discretionary usage can help address some of these limitations and improve the performance of Super Trend-based trading systems.
Is Super Trend accurate?
No indicator is accurate. We can call it precise. So, yes, super trend do provide precise signals but they are more relevant and quality based on higher time frames. Traders are expected to take the information from supertrend and dive deep into lower time frame analysis to solidify a trading setup.
The accuracy of the Super Trend depends on the confluence. In the right market environment and timeframe, optimized for the instrument, and used along with price action as well as trend validation, the Super Trend is a fairly accurate indicator. However, no technical indicator is perfectly error-free or foolproof. The key is using good money management to limit risks as accuracy cannot be assured with any indicator. With experience, traders judge the situations where the Super Trend is likely to be most accurate and learn to better filter the signals.
So while useful as a trend-following tool, the Super Trend indicator needs discretionary usage and should not be relied upon blindly. Backtested and forward-tested for an instrument and optimized to generate sufficiently accurate trend reversal and entry/exit signals for developing a profitable trading system. But accuracy is quite sensitive to the parameter settings, market conditions as well as the way the indicator signals are employed and confirmed. Prudent usage with realistic expectations can help make the most of the Super Trend indicator.
Is Super Trend profitable?
Super Trend alone cannot guarantee profitability in trading. It is just one tool among many that traders use to make trading decisions. Successful trading requires a product of extreme emotional control, acceptance of uncertainty, psychology and profitable trading strategy, money management, and a solid understanding of market dynamics. It’s important to note that trading involves risk and there are no guarantees of profits.
Markets are unpredictable, and past performance is not indicative of future results. In today’s era of capital markets, manipulation of scripts is at peak and retailer’s stop losses are liquidity for the market players.It’s crucial to thoroughly research and test any trading strategy, including Super Trend, before using it with real money. Additionally, it’s recommended to consider seeking professional advice and education in trading to improve your chances of success.


 Previous Article


![15 Investing.com Alternatives [Free+Paid] You Should Use in 2026](https://www.strike.money/wp-content/uploads/2026/04/Investing.com-Alternatives.jpg "15 Investing.com Alternatives [Free+Paid] You Should Use in 2026 100")
![15 TradeStation Alternatives [Free+Paid] You Should Use in 2026](https://www.strike.money/wp-content/uploads/2026/04/TradeStation-Alternatives.jpg "15 TradeStation Alternatives [Free+Paid] You Should Use in 2026 101")
![15 Chartink Alternatives [Free+Paid] You Should Use in 2026](https://www.strike.money/wp-content/uploads/2026/04/Chartlink-Alternatives.jpg "15 Chartink Alternatives [Free+Paid] You Should Use in 2026 102")


 : Definition, Formula, calculation, Uses, Advantages Vs limitations 106")


 111")


No Comments Yet.