Trading strategy is the structured, rule-based approach that helps traders to decide when to enter, when to exit, and how much to risk on every position. A trading setup helps traders to eliminate emotional decision-making and replace it with discipline, consistency, and a clear execution plan.
A good trading strategy involves definite entry and exit criteria, a well-built risk management system with adequate stop-loss and position sizing, and performance measured by backward or forward testing. It must maintain consistency across different market conditions. A trading strategy does not guarantee profits, but it increases the probability of winning and saving money.
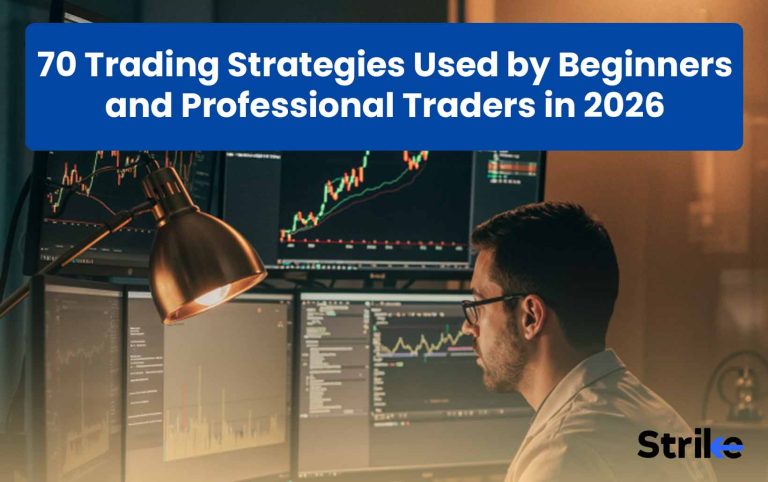
Here are 10 popular trading strategies, each best suited for a specific type of trader and goal.
| No. | Trading Strategy | Best For |
| 1 | Dollar-Cost Averaging | Long-term investors seeking low risk |
| 2 | Swing Trading | Part-time traders capturing short-term moves |
| 3 | Position Trading | Long-term trend followers |
| 4 | Day Trading | Active traders avoiding overnight risk |
| 5 | Scalping | High-frequency, short-term traders |
| 6 | Trend-Following | Riding strong market trends |
| 7 | Breakout Trading | Volatile and high-momentum markets |
| 8 | Mean Reversion | Range-bound market conditions |
| 9 | Options Trading Strategy | Advanced traders using leverage and hedging |
| 10 | Price Action Trading | Traders who prefer clean, indicator-free charts |
1. Dollar-Cost Averaging
Dollar-Cost Averaging is an investment strategy that involves investing a fixed amount of money in stocks or other assets at regular intervals of time. Dollar-Cost Averaging strategy allows investors to spread their purchase over time instead of speculating and timing the market to reduce the impact of volatility and emotional decision-making.
The image above illustrates Dollar Cost Averaging (DCA), where a purple dot represents an investor putting a fixed amount of money at regular intervals regardless of market ups and downs. The orange line represents the average price paid over time. The above chart clearly explains that Dollar Cost Averaging (DCA) helps reduce the impact of market fluctuations and lowers the risk of trying to time the market.

| Benefits | Risks |
| Reduces timing and emotional risk | Underperforms lump-sum in strong bull markets |
| Smoothens average buying price | Capital remains exposed in long bear markets |
| Simple, disciplined, and rule-based | Not suitable for weak or declining businesses |
| Works well in volatile and range-bound markets | Can create false comfort without fundamental checks |
| Ideal for long-term wealth building | Returns depend heavily on asset selection |
As per the backtest result from IUX Education, the S&P 500 showed a 7.5% CAGR on $12K invested with a monthly $100 investment from 2014 to 2024, yielding a 90% cumulative return vs. the lump sum’s 10.5-11%.
2. Position Trading
Positional trading is the medium- to long-term trading strategy where traders hold their position for weeks, months, or even years. This strategy allows traders to capture bigger price movements driven by broader technical structures and underlying fundamentals instead of focusing on short-term price movements.
Positional traders often look for a strong trending stock and enter at an optimal point using different indicators, breakouts or buying on support. Traders use fundamental data as a filter, where indicators are mostly used to time the entry and to manage the trade.
The above chart shows corrections in National Aluminium stock by 46% from ATH. This opened the opportunity for positional traders to buy the shares at a 46% discount. Stock took support from the Fibonacci golden zone, where positional traders could have bought after a change of character on a lower time frame. This trade has been running since the last 7 months, giving more than 100% return.

| Benefits | Risks |
| Captures large, high-reward market trends | Requires patience and long holding periods |
| Fewer trades reduce brokerage and noise | Exposed to overnight, event, and macro risks |
| Less screen time compared to intraday trading | Capital remains locked for extended durations |
| Works well with trend-following and sector analysis | Drawdowns can last longer before trend resumes |
| Emotionally calmer than short-term trading | Not effective in range-bound markets |
Positional trading comparatively gives better risk to reward, enabling traders to maximise their gains.
3. Swing Trading
Swing trading is a short-to-medium term trading strategy where traders aim to capture a swing within a broader market trend. Swing trading involves holding positions for several days to several weeks using technical analysis on hourly, daily or weekly charts.
In swing trading traders look for a trending market and enter on breakout or pullback. Traders also use indicators like MACD, RSI, or Moving Averages to time their entry. The exit is based on a pre-defined target of 1:2 or a trend reversal.

| Benefits | Risks |
| Captures frequent trading opportunities | Requires active trade management |
| Lower time commitment than intraday trading | Overnight gap risk exists |
| Clear entry, stop, and target structure | False breakouts can lead to losses |
| Works well with technical indicators | Overtrading can reduce performance |
| Flexible for part-time traders | Not ideal in very low-volatility markets |
As per backtest result by luxalgo, swing trading has 45-65% win rates, 8-15% CAGR, and Sharpe ratios of 1.0-1.4 across volatile markets like Nifty, capturing multi-day swings with technical setups.
4. End of Day Trading
End of Day Trading or EOD trading is a strategy where traders make buying and selling decisions after the market closes, avoiding all the intraday noise. In EOD trading, traders focus on trading in the next trading session based on today’s candle close.
EOD traders analyze daily charts after market hours to identify breakouts, reversals, trend continuations, or key level reactions. Orders are usually pleased after the market hours or before the next day opening.
The image mentioned above is a chart of Canara Bank demonstrating EOD analysis. A stock was taking support at 142 level, where it formed a bullish engulfing candlestick pattern at support. A trader can wait for the daily candle to close to confirm the bullish engulfing pattern and then take a position at EOD or before the next day’s opening, anticipating a potential upward move.

| Benefits | Risks |
| Decisions based on confirmed daily close | Overnight gap risk |
| Less screen time, ideal for working traders | Slower capital rotation |
| Reduces emotional intraday trading | Misses some intraday opportunities |
| Clear structure for stop-loss and targets | Can underperform in choppy markets |
| Suitable for trend-following setups | Requires patience and discipline |
backtests from Quantified Strategies (S&P 500, 1993-2023) deliver 12.4% CAGR vs. 10.2% buy-hold, with 55-65% win rates and Sharpe ~1.2 on daily close patterns.
5. Range Trading
Range trading is a trading strategy where traders buy near support and sell near resistance in a range bound market, where stock is repeatedly bouncing between support and resistance. Instead of expecting breakout or strong trend, traders anticipate that the price will stay in a range for a while.
In range trading, traders first mark the horizontal support and resistance levels with minimum three touch points and plan long or short entry once price reaches to support or resistance level. For long entries, targets are usually resistance level and for short entries, targets are usually support level with stoploss beyond the range.
As we can clearly see in the above chart, Hindustan Unilever stock price was consolidating between the price range of 2383 and 2708. By identifying these levels as support and resistance zones, traders can go long when price comes to support and short when price reaches its resistance.

| Benefits | Risks |
| Works well in sideways markets | Breakouts can cause quick losses |
| Clear entry and exit levels | False signals near range boundaries |
| Defined risk–reward setup | Requires quick profit booking |
| Frequent trading opportunities | Not suitable in strong trending markets |
| Can be combined with RSI & BB for confirmation | Overconfidence after multiple small wins |
According to quantified strategies, range trading shows a high win rate of 65-80% considering the proper risk management.
6. Trend-Following
Trend-following trading is a strategy where traders trade in the direction of an established trend in the market. A trend-following trading strategy follows a very basic concept: look for buying opportunities in an uptrend and selling opportunities in a downtrend.
Trend-following trading starts by marking the market structure, such as higher high/low or lower high/low, to decide the trend bias. Traders plan their entry during pullback, breakout, or trend continuation patterns within the existing trend. Stops are placed below recent swing lows (in uptrend) or above swing highs (in downtrend). Profits are often trailed using moving averages or structure-based trailing stops.
The above chart shows the M&M stock is in an uptrend, making higher highs/higher lows and trading above the 200 EMA. A trend trader can trade such stocks by buying them on pullback and selling them until the trend reverses.

| Benefits | Risks |
| Captures large sustained moves | Multiple small losses in choppy markets |
| Strong risk–reward potential | Requires patience and discipline |
| Works well with structure and momentum | Late entries reduce profit potential |
| Simple concept, scalable approach | False breakouts can trigger stop-loss |
| Suitable for swing and position traders | Emotionally difficult to hold through pullbacks |
Trend-following strategies deliver 8-15% annualized returns in backtests across commodities and equities, with top systems like Turtle Traders achieving 20-80% CAGR historically, though 70-80% of retail trend traders underperform benchmarks due to drawdowns exceeding 30%
7. Index Trading
Index trading is a strategy that involves buying and selling of indexes such as NIFTY 50 or S&P 500, instead of trading individual stocks. Since Index is a group of leading companies, this trading helps traders to capture broader market moves mainly driven by institutional money, economic data, or global causes.
Since indexes cannot be bought or sold directly, traders use instruments like futures, options, or an ETF. Index trading is popular among traders because it offers diversification, liquidity, and clear market structure. Traders use technical analysis and price action for index trading, which can be scaling, intraday, swing, or positional.

| Benefits | Risks |
| Lower company-specific risk | Requires understanding of derivatives (if trading futures/options) |
| More technically reliable movements | Leverage can increase losses |
| Strong liquidity and tighter spreads | Sensitive to global and macro news |
| Suitable for both intraday and swing trading | Volatility spikes can trigger quick stop-loss |
| Reflects overall market sentiment | Returns may be moderate without leverage |
NSE India index F&O trading dominates approximately 60-70% of equity turnover with ₹500+ lakh crore notional daily.
8. Gold Trading
Gold trading refers to buying and selling of gold as an asset to make profit from its price movement. The price of gold is mainly influenced by factors such as global demand and supply, interest rates, central bank policies, geopolitical tensions, and the strength of the U.S. dollar.
These factors along with price action are used by traders to speculate gold price for trading. There are different instruments available to trade gold which includes physical gold, ETFs, futures and options.
The above image is a price chart of gold where it rose by more than 60% in a year due to
recent geopolitical tensions and US Federal Reserve interest rate decisions. Traders can use such information to trade the movement in gold price.

| Benefits | Risks |
| Acts as hedge during market uncertainty | Highly sensitive to global news |
| Strong liquidity and global participation | Sharp volatility during economic data releases |
| Diversifies portfolio risk | Influenced by dollar and interest rates |
| Suitable for trend and breakout trading | Leverage in commodities can magnify losses |
| Technically responsive to support/resistance | Can remain range-bound for long periods |
Gold is one of the highly traded assets with Daily volumes averaged $361bn, OTC $180bn, exchanges $174bn , and ETFs $7bn. Gold ETF trading doubled to $7bn/day globally, led by North America (+138%)
9. Social Trading
Social trading is the modern style of trading where traders observe, share or even copy the trade of other experienced traders through online platforms and communities. Instead of trading purely based on their own analysis, traders can refer to the knowledge and actions of professional traders.
This type of trading is commonly done through a copy trading feature, where traders select their mentor based on performance metrics such as win rate, drawdown, risk management, and consistency and copy their trade.
The image above shows the TradingView Community section, where traders publicly share their market analysis and chart ideas. Users can view, learn from, or follow their favorite contributors. You can also post your analysis as a contributor; a TradingView premium membership is required.

| Benefits | Risks |
| Access to experienced traders’ strategies | Blind copying can lead to heavy losses |
| Learning opportunity for beginners | Past performance may not sustain |
| Saves research time | Limited control over trade decisions |
| Transparent performance statistics | High drawdown risk if trader is aggressive |
| Can diversify trading approaches | Overconfidence in “star traders” |
With more people looking to invest on their own, social trading platforms with options like copy trading and peer-to-peer views are becoming popular. The global social trading platform market is projected to grow at a CAGR of 9% between 2025 and 2034.
10. Price Action Trading
Price action trading is a strategy where a trader makes a trading decision purely based on price movement, chart structure, and candlestick behavior instead of depending on lagging signals from indicators. Traders use price action because it reflects all the available information that traders can read and anticipate future market movement.
In price action trading, traders focus on market structure (higher highs, higher lows), breakout levels, liquidity zones, and candlestick patterns for entry, exit and risk management.
The above price structure of Ashok Leyland is clearly showing that the stock is in uptrend marking higher highs and higher lows. A price made hammer candle pattern after a pullback in an uptrend. A trader could have entered after the hammer to trend continuation trade. This is how an opportunity can be identified just by using price action.

| Benefits | Risks |
| Clean charts with minimal indicators | Requires strong chart-reading skills |
| Works in trending and range markets | Subjective interpretation of setups |
| Adaptable to any timeframe | No fixed mechanical entry rules |
| Strong focus on risk management | Beginners may overtrade |
| Reflects real-time market sentiment | Emotional decisions can impact execution |
A trending stock that outperformed for over the past 3–12 months continued outperforming with average excess return of around 1% per month (~12% annually) before costs.
11. Fibonacci Retracement Strategy
Fibonacci retracement is a trading strategy that uses specific percentage levels based on Fibonacci, such as 23.6%, 38.2%, 50%, 61.8%, and 78.6%, to identify potential pullback areas within a trend. It works on the idea that the market moves in waves instead of straight lines. After a strong move, price often retraces back to these Fibonacci levels before continuing its original trend.
To trade this strategy, begin with marketing market structure to decide trend bias and then plot Fibonacci retracement from swing low to swing high (in an uptrend) or from swing high to swing low (in a downtrend). These zones will act as a support and resistance where you can plan your trade.
Above chart clearly shows how a stock took support from fibonacci golden zone ( 50% – 61.8%) and continued its uptrend.

| Benefits | Risks |
| Identifies structured pullback entry zones | Can give false signals in choppy markets |
| Works well in trending conditions | Subjective swing selection affects accuracy |
| Provides clear risk placement levels | Not reliable as a standalone tool |
| Combines well with price action and RSI | Traders may over-rely on specific levels |
| Improves risk–reward opportunities | Requires patience during pullbacks |
As per backtest result from dukscopy, Fibonacci Retracement strategy delivered 45-55% win rates with 1:2 R:R on forex/Nifty when entered on pullbacks to 38.2%, 50%, or 61.8% levels.
More than 52% of reversals were happening from Fibonacci golden zone 61.8%.
12. Seasonal Trading
A seasonal trading strategy is based on the idea that the financial markets move in a repeating pattern during a specific time of the year. These assets, sectors, or commodities perform similarly during specific months in the year due to economic cycles, festivals, earnings seasons, weather patterns, or institutional fund flows.
Traders analyze the historical data of an asset to identify the consistent monthly or quarterly trends. If an asset had performed well historically during specific months, traders began to create positions before they started.
Above is the image of the seasonality screener, which shows the month-wise performance of the Nifty 50 over the last 20 years, showing the average return of each month in the last 20 years. It shows that the Nifty performs best in the month of April, with an average return of 3.3%. Whereas in the month of February, Nifty gives an average return of -1.4%. Hence, this seasonality indicator helps traders to plan for their trade accordingly.

| Benefits | Risks |
| Uses historical probability advantage | Past patterns may not repeat |
| Helps anticipate sector strength | Macro changes can invalidate trends |
| Useful for swing and positional trading | Not effective for short-term scalping |
| Adds strategic timing edge | Blind reliance can cause losses |
| Works well with data-backed analysis | Requires historical data study |
13. Portfolio Rebalancing Strategy
Portfolio rebalancing is an investment strategy that involves a systematic process of adjusting the asset allocation back to its original target weights. Portfolio rebalancing works by selling a portion of the outperforming assets and reallocating funds into underperforming ones to restore balance.
Portfolio rebalancing can be time-based or threshold-based, where adjustments are made once allocations deviate beyond a set percentage. This helps investors to maintain long-term stability, reduces emotional decision-making, and keeps the investment strategy aligned with financial goals.
It shows that investors start with a single portfolio containing different assets like stocks, ETFs, bonds, and others. Over time, due to market performance, some assets gain more and others lose, which changes the original allocation.

| Pros | Cons |
| Maintains risk discipline | May reduce gains in strong bull markets |
| Encourages buy low, sell high | Requires monitoring |
| Reduces emotional decisions | Transaction costs |
| Improves long-term stability | Tax implications |
| Simple and systematic | May lag during strong trends |
Rebalancing a portfolio once a year can improve returns relative to risk compared to just buying and holding. As per “The Review of Asset Pricing Studies, Volume 13, rebalancing can increase the Sharpe ratio by about 0.2 to 0.5.
14. Day Trading
Day trading is a short-term trading style where traders buy and sell financial instruments within the same trading day. The aim of this strategy is to profit from small price movements that occur during market hours using volatility, momentum, and intraday price action.
Day trading relies on a lower timeframe such as 1-minute, 5-minute, or 15-minute charts. Traders use technical analysis and indicators for entry, exit,and risk management. Intaday trading allows traders to use leverage to maximise their return, but this also increases risk.
In the above chart, Reliance Industries formed a Bearish Pennant pattern on the 5 min chart on 13th Jan 2026, broke the pattern to the downside on the same day confirming the pattern. This breakdown provided a clean intraday short setup giving us a trade of 1:2 risk to reward within the same session.

| Benefits | Risks |
| No overnight risk exposure | High emotional and mental pressure |
| Frequent trading opportunities | Requires strong discipline |
| Capital is rotated daily | Transaction costs can reduce profits |
| Works well in volatile markets | Overtrading can cause losses |
| Suitable for active traders | Small mistakes can compound quickly |
According to tradeciety, only 4-10% of day traders profit consistently after fees, per broker data, whereas 80-90% day traders fail to make consistent profits.
15. Momentum Trading
Momentum trading is a strategy where traders aim to capture the strong price movement of an asset in a particular direction. Traders believe that assets showing a strong uptrend or downtrend will continue moving in the same direction for some time, where traders aim to take advantage of that momentum.
To trade momentum, traders identify the stock moving in a strong trend supported by volume and enter the trade using price action. Indicators like RSI and Moving Averages are often used in this strategy to confirm the momentum of the stock.
Image above shows the drop in the stock HCL Technologies LTD after reaching its strong resistance level of 1740-1750, with a strong downside momentum. The stock dropped more than 12% within the span of 18 days.

| Benefits | Risks |
| Captures strong trending moves | False breakouts can cause quick losses |
| High reward potential | Requires quick decision-making |
| Works well in volatile markets | Late entries reduce profit potential |
| Aligns with institutional flow | Momentum can reverse sharply |
| Scalable for swing and intraday trading | Emotional pressure during fast moves |
According to Quantinsti, around 60-70% of the momentum trading strategy underperforms benchmark S&P 500 over a long period due to trend reversals. But the skills trader can achieve 10-20% of annualized return with strict risk management.
16. Breakout Trading
Breakout trading is a strategy where traders enter the trade after price breaks and closes decisively above resistance or below support in a consolidated market. These breakouts often lead to strong directional moves where traders aim to capture this new trend.
Traders trade these breakouts by first identifying consolidation patterns, such as ranges, triangles, or channels. When price closes above resistance or below support, traders enter the trade accordingly with stoploss below recent swing low or other side of consolidation.
Above is the stock chart of Shriram Finance, which was facing resistance near the level of 700 to 730. On 29 October 2025, stock closed above the level of this zone, giving breakout of the resistance. A breakout trader would have entered a long position after a breakout with RR of 1:2 or 1:3.

| Benefits | Risks |
| Captures early stage of new trends | False breakouts can trigger losses |
| High reward potential | Requires patience for confirmation |
| Clear entry and stop-loss levels | Overtrading in choppy markets |
| Works well with momentum | Breakouts without volume often fail |
| Suitable for swing and intraday traders | Emotional FOMO can lead to poor entries |
Trading Rush analysis (100 breakouts tested): Raw breakouts hit ~36% win rate, but valid ones with pullback/volume filters reach 50-58%, with 40-50% fakes; 1:2 RR viable in trends.
17. Reversal Trading
Reversal trading is a strategy where traders plan for a trade once the prevailing trend changes its trend, either from bullish to bearish or from bearish to bullish. Traders consider reversal in a trend once price breaks lower high in an uptrend and higher low in a downtrend.
Traders trade reversal patterns using price action, reversal chart patterns and indicators. Indicators such as RSI, MACD and volume helps traders to confirm the trend reversal through concepts like divergence.
As we can see in the chart above, L&T Finance reversed its trend from downtrend to uptrend after making double bottom. A trend reversal trader can capitalize on such trade with favorable risk to reward.

| Benefits | Risks |
| High reward–risk potential | Entering too early can cause losses |
| Early entry into new trends | Lower win rate than trend-following |
| Works well near major support/resistance | Strong trends can continue further |
| Suitable for swing traders | Requires patience and confirmation |
| Can catch large turning points | Emotional bias toward calling tops/bottoms |
According to ACY Securities’ AI-driven backtest report, reversal trades showed the lowest win rate at 41.2% across 32 trades with a net loss of -$870.90, underperforming trend-following setups.
18. Gap Trading
Gap trading strategy involves trading a market gap created in the market between the previous day’s close and the next day’s open. Such gaps often get created due to overnight news, earnings reports, economic data, or global market events. These sudden price jumps create good trading opportunities for traders, as price strongly reacts to these gaps.
Traders either trade in the direction of the gap if momentum continues or they trade a gap filling if price moves back to fill the gap. Entry is usually taken after the first few candles to confirm the direction with a stoploss placed beyond the gap.
On Jan 17th 2025, Infosys opened 3.8% gap down, after which the stock slowly rose to fill the gap before continuing its downtrend. After filling the gap, stock fell more than 18%. Traders could have planned for short trade after gap fill and break of support trendline.

| Benefits | Risks |
| High volatility creates quick opportunities | Rapid reversals can cause losses |
| Clear intraday structure for entries | Requires fast decision-making |
| Works well during earnings season | News-based volatility is unpredictable |
| Suitable for active intraday traders | Emotional trading can increase risk |
| Strong risk–reward setups possible | False continuation signals are common |
According to quantinsti, 70% of stock gaps close the same/next day (1993-2020 SPY data), favoring mean-reversion entries.
19. News Trading
News trading is a strategy where traders take positions based on news, such as financial reports, global events, or major economic news. Such news creates sharp volatility in a market, where traders aim to profit from this rapid price change.
Some traders enter the trade immediately after the news to enjoy the volatility, whereas some traders wait for the market to decide a clear direction after the news. Although the news trading gives bigger profits, it also carries the risk of sudden and unpredictable loss due to high volatility.
The above- mentioned chart is a chart of stock ITC which was at its key level before the fall. This sharp fall was influenced by government decisions to raise excise duty. Stock broke its key support level after news and fell more than 25%, where traders could have plans for a short trade.

| Benefits | Risks |
| High volatility creates strong opportunities | Extremely unpredictable price swings |
| Quick profit potential | Slippage and spread widening |
| Clear event-based timing | Requires fast execution |
| Works well in index and currency markets | High emotional pressure |
| Can capture large single-day moves | Wrong positioning can lead to sharp losses |
Such news often triggers sudden volume spike (3-5X of average volume) liquidity gaps, and breakdowns or breakouts from key levels.
20. Mean Reversion
Mean reversion is a trading strategy that is based on the idea that the price has a tendency to revert back to its average value after moving too far in one direction. Traders seek overextended price action where they anticipate a reversal or correction back to an average like VWAP, moving averages, or statistical bands.
Traders identify overextended prices using indicators like RSI, Bollinger Bands or EMAs. Traders look for a buy trade after the price sharply falls down and is expected to reverse back to its mean. Whereas, traders plan to sell when price rises sharply.
The above chart shows how the price reversed to its mean value which was VWAP after an over-extended fall in one direction. The RSI below 30 suggests the over-extended drop in price, where traders would have planned for a reversal trade after a bullish candle.

| Benefits | Risks |
| Works well in range-bound markets | Fails in strong trending markets |
| Clear statistical edge in extremes | Overbought/oversold can persist |
| Defined targets near mean levels | Requires precise timing |
| Suitable for intraday and swing trading | Catching falling knives risk |
| Can offer quick bounce trades | Emotional bias toward early entries |
A backtest result on S&P data from 1993-2013, a stock increases on an average 0.8% after it goes below RSI 10.
21. Scalping
Scalping is a very short-term trading strategy where traders aim to make profit from very short-term price movements within seconds or minutes. The timeframe used in scalping is usually 1 minute to 5 minutes. This style of trading focuses on speed, liquidity, momentum, and precision rather than large price targets.
Traders mostly trade highly liquid stocks for better and faster execution and focus more on the frequency of trades instead of big gains.
The above chart shows the breakout of the ascending triangle pattern on a 1 min timeframe. A scalper could have entered the trade on a breakout with a profit target of 1:2 or 1:3. In this case, we achieved 1:3 RR within 20 min.

| Benefits | Risks |
| No overnight risk | High stress and mental pressure |
| Frequent opportunities | Transaction costs can reduce profits |
| Quick capital rotation | Requires fast execution |
| Suitable for volatile sessions | One large loss can erase gains |
| Small exposure time per trade | Overtrading risk is high |
Regulatory data from ESMA, ASIC, and broker reports (e.g., 2020-2025) consistently show 80-95% of retail day/scalpers lose money quarterly, leaving just 1-10% profitable long-term.
22. Forex Trading
Forex trading involves buying and selling of currency pairs in order to make a profit from changes in exchange rates. Science currencies are traded in pairs; one currency strengthens while the other weakens, where traders capture this price difference in their relative movement to make profit.
Unlike stock trading, forex trading is decentralized and open for 24 hours for five days a week, where the currency price is influenced by interest rates, inflation, central bank policy, economic data, and geopolitical events, making forex trading more sensitive to global macro conditions.
Given above is the price chart of the currency pair EUR and USD, where traders are trading the fluctuation between the exchange rate of EUR and USD. When EUR strengthens, price goes up and EUR weakens, price goes down.

| Benefits | Risks |
| 24-hour market (5 days a week) | High leverage increases risk |
| High liquidity in major pairs | Sensitive to global news events |
| Low capital requirement to start | Rapid price swings possible |
| Suitable for trend and breakout trading | Emotional trading amplified by leverage |
| Multiple trading sessions globally | Requires understanding of macro factors |
Forex trading has the highest volume compared to other forms of trading, with global forex daily trading volume reaching around $7.5 trillion in April 2025 per the BIS Triennial Survey, which is a 42% increase from 2022.
23. Crypto Trading Strategy
Crypto trading involves buying and selling of cryptocurrencies and digital assets such as Bitcoin, Ethereum, and altcoins to profit from price volatility. Crypto markets are also decentralized, highly speculative, and operate 24/7, where price is driven by liquidity and sentiment rather than traditional fundamentals.
Crypto reading involves heavy use of technical analysis because prices are influenced by demand–supply dynamics, institutional inflows, macro conditions, and market sentiment. Since crypto markets are highly volatile and allow traders to take leverage to 200X , risk management becomes an important part of crypto trading.
The given image is of the famous cryptocurrency “Bitcoin,” which operates 24/7. Bitcoin is one of the most traded assets due to its volatility, liquidity, and 24-hr access. The average daily trading volume of Bitcoin is around 82 billion USD across major exchanges.

| Benefits | Risks |
| 24/7 market access | Extremely high volatility |
| Strong momentum opportunities | Regulatory uncertainty |
| High return potential in bull cycles | High leverage liquidation risk |
| Wide variety of tradable assets | Market manipulation in low-liquidity coins |
| Works well with technical analysis | Emotional trading due to rapid swings |
Crypto is one of the most traded assets in the world due to its volume,liquidity and accessibility. According to btcc, the Crypto trading volumes reached $18.6 trillion in 2026 (spot + derivatives), up 9% from 2025.
24. Options Trading Strategy
Option trading strategy involves buying, selling, or a combination of buying and selling option contracts to make a profit from their price movement. The price movement of option contracts is influenced by the price movement of its underlying asset because options are a derivative contract.
Unlike stock trading, option trading allows traders to use leverage. Traders enter option trading by analyzing technicals, option chains, or option greeks. These contracts come with weekly and monthly expirations where traders expect prices to move in their favor before the contract expires. Some common option trading strategies include buying calls or puts, covered calls, protective puts, straddles and iron condors, and credit and debit spreads.
There are a bunch of different option strategies based on the trend of the market. Above is the screenshot from the platform Sensibull, which has different types of ready option strategies, where traders can execute the option strategies directly into their portfolio depending upon their view on the market.

| Benefits | Risks |
| Limited risk (for option buyers) | High time decay (Theta loss) |
| Leverage allows larger exposure | Complex pricing structure |
| Can profit in any market condition | Unlimited risk in naked selling |
| Flexible strategy combinations | Volatility crush risk |
| Hedging tool for portfolios | Emotional overtrading due to fast moves |
90% of NSE FnO volume is dominated by options volume, according to Dhan. In options trading, OTM buyers face 80-90% losses per SEBI broker data.
25. Futures Trading Strategy
Futures trading is a strategy where traders buy or sell standardized contracts to trade an asset at a predetermined price on a future date. The prices of these contracts are influenced by the price changes in their underlying assets, such as indexes, commodities, or stocks.
Futures trading works on margin-based contracts, where traders pay a fraction of the contract value as a margin to get a large position. Traders enter futures trading by analysing the technical of its underlying and open interest. These contracts come with monthly expiry where traders expect prices to move in their favor before the contract expires.
The above-given image is the chart of the Nifty 50 futures contract, which moves exactly the same as the underlying Nifty 50 index. Traders analyze and speculate on the index or share but trade futures to get the advantage of leverage.

| Benefits | Risks |
| High leverage | High capital risk |
| Direct price exposure | Margin calls during volatility |
| No time decay | Large drawdowns possible |
| Ideal for trend trading | Overnight gap risk |
| Suitable for hedging | Emotional pressure due to leverage |
In India, the highest futures trading activity happens in Indexes such as Nifty, Bank Nifty with average daily volume ₹500 lakh Cr and commodities such as Gold and other MCX metal hiting record ₹93,929 Cr ADT.
26. Dividend Capture Strategy
Dividend Capture Strategy is a short-term trading approach where traders enter the stock before its ex-dividend date to receive dividend and sell the stock shortly after. When a company announces a dividend, it sets an ex-dividend date. To receive the dividend, traders must own the stock before this date.
However, after a dividend, stock price drops by the same amount as the dividend, which means dividend amount is not a free money. Traders sell the stock as soon as it recovers after the dividend.
Above chart is a price chart of ITC, which shows the gradual rise in stock price over the time along with dividend. As we can see at the bottom highlighted area of the chart, ITC announced a dividend 2 times in a year with a dividend yield of 3.5 to 4.4%. An investor can buy such fundamentally strong stock for capital appreciation along with dividend income.

| Benefits | Risks |
| Short holding period | Price drops on ex-date |
| Additional income source | Dividend may not cover price decline |
| Works well in stable markets | Tax implications |
| Can combine with technical setups | Transaction costs reduce returns |
| Opportunity for quick capital rotation | Not effective in bearish trends |
A good dividend yield for sustainable long-term investing typically falls between 3-6%, balancing income generation with payout safety and growth potential. Yields above 8% often signal unsustainable dividends or value traps,
27. Short Selling
A short-selling trading strategy involves selling off a share without owning it, expecting the price of the stock to fall so that they can buy them at a lower price and keep the difference as profit.
Short selling works by borrowing the shares from the broker and selling them into the market. If the price falls, traders buy the shares back and return them to the broker and keep the difference as profit. Traders use price action, charts, news, and open interest to find short selling opportunities with strict stop losses.

| Benefits | Risks |
| Opportunity to profit in falling markets | Unlimited loss potential |
| Works well in corrections/crashes | Short squeeze risk |
| Useful for hedging portfolios | Margin requirements |
| High probability during breakdowns | Emotional pressure |
| Quick profit in panic selling | Regulatory restrictions |
Stocks with extremely high short interest often experience higher volatility. Unlike buying a stock that has a max loss of 100% of capital employed, short selling theoretically has an unlimited loss.
28. Earnings Trading Strategy
Earning trading is a strategy where traders build positions based on stocks’ quarterly earnings announcements. Such earnings reports often influence stock prices because they reveal a company’s performance, profit growth, revenue, and future guidance.
There are two common approaches for earning from trading. A trader can build a position before an earnings announcement or enter a trade after an earnings announcement. Building positions before earning comes with a risk of unpredictable volatility. A good earning report can also lead to price fall, if the expectations are high.
On 7 November 2025, Torrent Pharma released Q2 FY26 positive earnings report with consolidated net profit surging 30% YoY and revenue from operations rose 14% YoY. Stock gave a breakout of a flag pattern after a positive earnings report. Traders can closely monitor such earnings events and combine strong fundamental triggers with price action setups to identify high-probability trading opportunities.

| Benefits | Risks |
| High volatility opportunities | Unpredictable market reaction |
| Quick profit potential | Gap risk |
| Works well with options strategies | IV crush (options traders) |
| Strong momentum trades | Slippage and wide spreads |
| Clear event-based trigger | Emotional trading pressure |
Studies by Patell & Wolfson (1984), Journal of Accounting Research, show that a significant portion of a stock’s quarterly price movement happens within the earnings announcement window (often 1–3 days).
29. Hedging Strategy
Hedging strategy is a risk management strategy where traders take an opposite position in a related asset to minimize the potential risk of the portfolio due to uncertainty. Hedging works as an insurance, helping to offset the losses you are making in your investment.
There are different tools available for hedging. A trader can buy a put option in the falling market to hedge his loss in its underlying. A pair trader can buy or sell futures contracts to lock in the exchange rate. Gold is also used as a hedge against inflation or economic crises.
Image above illustrates the payoff chart of options hedging strategy known as “Protective Put” where traders or investors buy a put option of the same stock to protect against a fall in price. As we can clearly see, we have unlimited profit if price rises, but the max loss is capped to -$1000. This is because, when the stock price falls below the put’s strike price, the put gains value and offsets the loss in the stock.

| Benefits | Risks |
| Reduces downside risk | Reduces overall profit potential |
| Protects portfolio during volatility | Cost of hedge (premium/margin) |
| Useful during uncertain events | Over-hedging reduces efficiency |
| Helps manage emotional stress | Requires understanding of correlation |
| Improves long-term capital protection | Timing hedge incorrectly can reduce returns |
Modern Portfolio Theory (Harry Markowitz, 1952) demonstrated that combining negatively correlated assets can reduce overall portfolio volatility without proportionally reducing returns.
30. Sentiment Analysis Trading
Sentiment trading strategy involves study of the overall market sentiment to predict the upcoming price movement instead of only relying on price charts or financial data. Markets are driven by participants’ emotions such as fear, greed, optimism, and panic, influencing market price.
This sentiment data can be news headlines, social media trends, market surveys, volatility indexes, and tools like the Fear & Greed Index. A professional traders and investors look for a buy when fear is extreme and sell when greed is extreme.
Above is the “FII Index futures log% indicator“ in a section of sentiment indicator in Strikemoney platform. This indicator helps traders to understand the sentiment of the market based on FII position in index futures. High FII index future long percentage suggest bullish sentiment, whereas low FII index future long percentage suggest bearish sentiment.

| Benefits | Risks |
| Identifies crowd psychology | Difficult to time precisely |
| Useful for spotting reversals | False signals in trending markets |
| Works well with technical analysis | Sentiment can stay extreme for long |
| Helps avoid emotional trading | Overreliance on social media noise |
| Good macro-level insight | Requires multiple data sources |
As per Bollen, Mao & Zeng (2011), Journal of Computational Science, sentiment extracted from Twitter and financial news can predict short-term stock returns and volatility.
31. Insider Sentiment Trading
Insiders sentiment trading involves analyzing the buying and selling activity of company insiders such as executives, directors, or major shareholders to understand their confidence in the company’s future.
Insiders usually know more about the company’s internal health than the public. Therefore their buying and selling activity can signal potential future price of the business. The insider data which is publicly disclosed includes promoter buying or increasing stake, large insider purchases, continuous insider selling and changes in shareholding patterns.
Image above shows the deals and insider activity with name of the stocks and investor, category of investor, their mode of transaction, quantity, price, and value. This legal insider information can be used to speculate the share price for trading and investing.

| Benefits | Risks |
| Insight into internal confidence | Insider selling not always bearish |
| Useful for long-term positioning | Information delay (reported later) |
| Works well with fundamentals | Overinterpreting small transactions |
| Adds conviction to trades | Not effective for short-term timing |
| Helps identify accumulation | Can mislead during market euphoria |
Academic research by Lakonishok & Lee (2001), Review of Financial Studies, shows that stocks with significant insider buying tend to outperform the market over the following 6–12 months.
32. Volatility Trading
Volatility Trading strategy aims to profit from change in asset volatility rather than just change in price. This changing volatility helps traders to understand the speed of the market, not the direction of the market. This strategy is commonly used by options traders because options prices are influenced by volatility.
Traders buy options when they expect volatility to increase, because high volatility leads to strong price movement. Whereas, traders sell options when they expect volatility to decrease, because prices stay range bound during low volatility. The volatility mainly rises during uncertainty or major events.
Mentioned above is the chart of India VIX which measures the volatility of the Indian market. India VIX rose more than 500% during the COVID-19 peak, from 10-12 to 86.64 on March 24, 2020. This extreme rise in India VIX was due to panic from lockdowns and global turmoil where Nifty 50 dropped by 39%.

| Benefits | Risks |
| Can profit without directional bias | Complex to understand |
| High opportunity during events | IV crush risk |
| Works well in uncertain markets | Requires strong risk control |
| Flexible options strategies | High leverage exposure |
| Captures large price expansions | Fast capital erosion if wrong |
IV often peaks at the moment of uncertainty, not after the result is known. Even if the market continues trading with high IV after the event, a volatility crush will happen.
33. Pair Trading
Pair trading is a market neutral strategy where traders take opposite positions in two highly co-related assets. Pair trading involves buying one asset and selling another asset to profit from the change in the price relationship between the two, rather than from overall market direction.
Traders look for temporary divergence between two similar moving stocks. If one stock falls sharply and the other stays stable, traders buy the underperforming stock and sell the stable stock to make profit once the price gap gets back to normal.
The chart above explains the concept of pair trading using stock A and stock B as two related stocks. As we can see in a chart, Stock A (blue) and Stock B (pink), moving closely together over time.
At a point, stock A rises much more than stock B, creating a gap between them. A trader can short the overperforming stock (Stock A) and buy the underperforming stock (Stock B), expecting the prices to move back together. When this gap narrows,the trader reverses or exits the trade and captures the profit.

| Benefits | Risks |
| Market-neutral strategy | Correlation breakdown risk |
| Reduced directional exposure | Requires strong analysis |
| Lower volatility compared to single trades | Execution complexity |
| Works well in range-bound markets | Sudden divergence can expand losses |
| Diversifies trading approach | Limited profit potential |
According to Gatev, Goetzmann & Rouwenhorst (2006), Review of Financial Studies, found that a simple distance-based pair trading strategy generated average annual excess returns of about 11% before transaction costs over a long sample period.
34. Arbitrage
Arbitrage is the strategy where traders trade the price difference of the same asset across different markets or exchanges. Unlike directional trading, arbitrage does not require market trends, support and resistance.
In arbitrage profits come from simultaneous buying low and selling high to exploit inefficiencies. Arbitrage can occur across stocks, forex, commodities, cryptos, or derivatives, and is often executed on very short timeframes.
As we can see in the above image, the price of TATAPOWER differs by 0.05 on two different exchanges. Arbitrage traders identify such price differences to make profits. This trading is not meant for retailers and mainly done by institutions using systems.

| Benefits | Risk |
| Low directional risk | Small profit margins |
| Works in any market condition | Requires fast execution |
| Can be automated | High competition |
| Based on price inefficiency | Transaction costs matter |
| Scalable with capital | Not truly risk-free |
According to EnrichMoney analysis, arbitrage achieves 70-90% success via mean-reversion models, with the average win return of 0.1-0.5% per trade.
35. Calendar Spread Trading
Calendar spread trading is an options trading strategy where traders buy and sell options of the same strike price but of different expiry, usually buying a long-term expiry and selling short-expiry.
Traders trade calendars spread strategy when they expect prices to remain stable for a short-term, where the near-month option loses value faster as expiry approaches, which benefits the trader who sold it, while the far-month option retains more value. The profit in the calendar spread is limited and depends on time decay, volatility, and proper strike selection.
Above is the payoff chart of the calendar spread options strategy, where the market is expected to stay sideways near the level of 24900. The small green area is the profit zone, meaning if the market stays within this range, traders will make profit. If the price moves beyond the green area, it will enter the red zone loss area.

| Benefits | Risks |
| Limited risk strategy | Loss in strong trending move |
| Benefits from time decay | Complex to manage |
| Lower margin compared to naked selling | Volatility shifts can hurt position |
| Works well in range-bound markets | Requires expiry timing precision |
| Defined maximum loss | Profit potential is limited |
Studies by CBOE/OptionMetrics analyses confirm that calendar spread options strategies have a 55-65% PoP in neutral/range-bound markets (low vol, stable price).
36. Theta Decay
The theta decay strategy is an option-based strategy where traders aim to profit from the gradual loss of premium over time by selling the option contract. Theta measures how much the option loses its premium as it approaches its expiry.
Every option premium consists of intrinsic value and time value. This time value reduces gradually every day and gets near to zero on the day of expiry. The reduction in time value accelerates as the day of expiry nears.
The above chart shows how an option value decreases over time as it gets closer to expiration. On the left side of the graph (around 90–60 days), the time decay is slower, and the option loses value gradually.
However, as expiration nears (last 30 days), the decay gets much faster, and the option premium drops in price quickly.

| Benefits | Risks |
| Earn from time passing | Sudden big moves can cause losses |
| High probability setups | Unlimited risk in naked selling |
| Works well in range markets | Margin requirement |
| Faster decay near expiry | Volatility spike risk |
| Can generate regular income | Emotional pressure during sharp moves |
Roughly 30–50% of total time value erosion happens in the final 30 days before expiry, where at-the-money (ATM) options experience the highest theta decay, as per Black & Scholes (1973), Journal of Political Economy.
37. Volatility Crush Trading
Volatility crush trading is an option trading strategy where traders aim to profit from the sudden drop in the market volatility after a major event, such as earnings announcements, policy decisions, or important economic data releases.
Traders usually implement a volatility crush strategy by selling options during the time of high volatility. During this time, the options premiums are overpriced due to strong expected movement. After the event gets over, volatility drops and the value of overpriced premium falls. Traders try to sell such overpriced options to make profit once it falls after volatility drops.
The above image shows the implied volatility chart of Netflix. As we can see, the IV (represented by the orange line) rises before earning reports and drops after uncertainty disappears. Meanwhile, historical volatility (blue) reflects actual movement and doesn’t spike in the same exaggerated way before earnings. This IV crush phenomenon drops the option prices quickly, which can hurt option buyers but benefit option sellers.

| Pros | Cons |
| Profits from volatility drop | Risk of large directional movement |
| Works well around earnings events | Requires options knowledge |
| Can profit even if price stays near strike | High risk if not hedged |
| Predictable IV behavior in many stocks | Timing is critical |
| Suitable for advanced strategies | Not ideal for beginners |
Volatility crushes happen most consistently around earnings, roughly 4 times per year per stock, and occur in the majority of cases (about 70–85%). It is less predictable around macro events and highly risky during surprise-driven market moves.
38. Delta-Neutral Trading
A delta-neutral trading strategy is an options strategy where the net delta of the position is zero or near to zero, meaning the positions will not be affected by small price movements in the underlying.
Delta measures how much an option’s price changes when the underlying asset moves by one unit. By balancing positive and negative deltas, traders reduce directional risk and focus instead on factors like volatility and time decay. As the market moves, delta changes. Traders adjust the position to maintain the neutrality in delta. This adjustment of delta is called rebalancing or delta hedging.
The popular delta-neutral strategies involve straddles, strangles, iron condors, and calendar spreads. This image shows the payoff of an iron condor, which is a delta-neutral strategy. At entry, the overall delta is close to zero, meaning the position is not strongly biased toward bullish or bearish movement.

| Pros | Cons |
| Reduces directional risk | Requires constant adjustment |
| Allows focus on volatility and time decay | Can generate high transaction costs |
| Useful for professional risk management | Complex for beginners |
| Flexible strategy structure | Sudden large moves can disrupt balance |
| Can be combined with many option setups | Requires strong understanding of Greeks |
Unlike buy-and-hold strategies, delta-neutral trading requires continuous monitoring and rebalancing, especially when gamma exposure is high.
39. Gamma Scalping
Gamma scalping is an options strategy where a trader buys options (typically a call and a put combined) and keeps adjusting position with the price move. The trader tries to remain delta-neutral so that small price swings do not cause significant losses. They sell the shares when the price increases and buy shares when the price decreases.
The aim is to take advantage of the frequent price changes. When there is a lot of back and forth in the market, the trader can repeatedly buy low and sell high while holding the options. However, if the market stays quiet, time decay can reduce the option’s value and cause losses.
This chart shows why gamma scalping works best near ATMs and near expiry. Gamma is highest around the ATM strike (around 45), especially for near-term expiry (Sep-10). Higher gamma means delta changes rapidly with small price moves. This allows a trader who is long gamma (long options) to repeatedly buy low and sell high in the underlying as price fluctuates.

| Pros | Cons |
| Profits from volatility | Requires constant monitoring |
| Reduces directional risk | Time decay works against you |
| Can generate steady small gains | High transaction costs |
| Effective in volatile markets | Complex execution |
| Professional-level strategy | Not beginner-friendly |
40. Skew Trading
Skew trading is an option trading strategy where traders gain profit from the differences between implied volatility between different strike prices. In many markets, out of the money puts tend to have higher implied volatility than calls, as investors are willing to pay a higher premium to be insured against a downside. This pricing difference across the strikes is termed as volatility skew.
Skew traders do not predict the direction of the market but search overpriced and underpriced options. They can buy low implied volatility options and sell high implied volatility options aiming to benefit if the volatility gap narrows or returns to normal.

A smile skew suggests higher IV for both OTM calls and OTM puts, and lower for ATM options, creating a “U” shape. Whereas, smirk skew suggests IV is higher for OTM puts and decreases toward OTM calls, creating a downward slope. Skew traders use this difference in implied volatility across strikes to find mispricing
| Pros | Cons |
| Exploits volatility mispricing | Complex analysis required |
| Less dependent on direction | Skew can stay extreme |
| Used by professional traders | Requires strong risk management |
| Flexible strategy structures | Sensitive to market stress |
| Can provide volatility edge | Not suitable for beginners |
Volatility skew in major equity indices is one of the most persistent structural features of options markets. It is highly reliable in existence, but unpredictable in short-term expansion and contraction.
41. Basis Trading
Basis trading is a strategy that profits from the price difference between asset spot price and its underlying futures price. This difference between spot price and futures price is known as basis, which usually happens due to factors like Interest rates, storage costs, dividends, market demand and supply, and funding rates.
As futures contracts approaches expiration, the futures price converges toward the spot price, creating a trading opportunity. If futures are trading higher than a spot, traders buy the spot asset and sell the futures contract. Whereas, if futures are trading below the spot, traders sell the spot and buy the futures contract.
The above image explains the basis trading where spot price differs from future price by $0.5. As we can see, the future price is higher than the cash bond price, where traders will sell the future and buy the spot. As the futures contract approached expiration, the futures price gradually moved closer to the cash price and the basis became zero.

| Pros | Cons |
| Market-neutral approach | Requires capital and margin |
| Profits from convergence | Spread may widen temporarily |
| Often lower volatility strategy | Execution complexity |
| Used by institutions and funds | Funding rate risk (crypto) |
| Predictable at expiration | Liquidity risk |
National Stock Exchange of India (NSE) historical futures data shows NIFTY near-month futures usually trade at a 0.3%-1.5% premium in stable markets.
42. Funding Rate Arbitrage
Funding rate arbitrage is a market-neutral trading strategy primarily used in cryptocurrency where traders make profit from regular interest payments, known as funding fees. In crypto exchanges, perpetual futures use a funding rate mechanism to keep the futures price close to the spot price.
If the future price is higher than the spot price, long traders pay short traders, and if it is lower, short traders pay long traders. Traders buy the crypto in the spot market and simultaneously short the same crypto in the perpetual futures market. Hence, these positions offset the loss of each other, the risk is neutralized and traders make profit from funding payment.
The image above shows a funding rate arbitrage setup in crypto futures, where traders have short the BTC/USDT perpetual contract and bought the BTC/USDT spot to capture funding payments. The red marked portfolio shows the position with 3-day cumulative funding rate and APR (0.0900% / 5.47%), indicating the potential yield from the arbitrage opportunity.

| Pros | Cons |
| Market-neutral strategy | Requires significant capital |
| Earns recurring funding income | Funding rates can change rapidly |
| Less dependent on price direction | Exchange risk |
| Can be automated | Fees reduce returns |
| Popular with crypto funds | Not always consistently profitable |
The study by Coinbase Institutional – A Primer on Perpetual Futures says, major exchanges often show positive funding rates around 0.01% per 8 hours, which equates to roughly 10.9 % annualized if sustained.
43. Market Making
Market making is a high-frequency trading strategy where traders or institutions continuously quote buy and sell orders to profit from the bid-ask spread while providing the essential liquidity to the market.
A market maker strategy works by placing both buy (bid) and sell (ask) orders slightly below and above the current market price to earn the small difference between them, called the spread. When traders sell, the market maker buys; when traders buy, the market maker sells. By repeating this process many times and carefully managing inventory risk, they generate small but consistent profits without predicting market direction.
This image explains who market makers are and how they earn profit. Market makers act as intermediaries and buy at the bid price from sellers and sell at the ask price to buyers. The difference between the bid and ask price (the spread) becomes their profit.

| Pros | Cons |
| Consistent small profits | Requires large capital |
| Market-neutral structure | High competition |
| Works in both bull and bear markets | Technology-intensive |
| Generates liquidity income | Sensitive to volatility spikes |
| Scalable with automation | Complex risk management |
In highly liquid instruments, the spread can be as narrow as $0.01 per share, but high volumes mean even tiny spreads can translate into millions in profits across a day.
44. Liquidity Grab / Stop-Hunt Trading
Liquidity Grab also known as stoploss hunting is the trading strategy which involves identifying the area where most of the retailer stop loss is clustered. These areas are mostly above resistance and below support levels.
Smart money intentionally pushes the price toward these areas to hit the retailers stop loss and get the liquidity to actually move the market in desired direction. Liquidity Grab traders enter the trade once price closes inside the key level by sweeping the retailers liquidity and forming a wick.
Jindal Stainless Limited has a ₹750 as important key level, which initially acted as resistance and later as support. Price temporarily broke below the support level, triggering the stop losses set under the important level. After removing this liquidity the stock immediately turned round and resumed its upward direction.
| Pros | Cons |
| High reward-to-risk potential | Difficult to differentiate real breakout from fake breakout |
| Precise entry near reversal zones | Can result in repeated stop-outs in trending markets |
| Based on market psychology and liquidity | Requires experience and patience |
| Works well near key support and resistance | False confirmation signals possible |
| Can avoid chasing breakouts | Not suitable for beginners without structure understanding |
Osler (2003) studied FX markets and found that stop-loss orders are heavily concentrated just beyond recent highs and lows which often trigger short-term price cascades.
45. VWAP Trading Strategy
A VWAP trading strategy involves the use of VWAP, which determines the average price of the stock based on its price and volume both. VWAP acts as a dynamic support and resistance that institutions use to identify whether the price is trading at fair value, premium, or discount.
To trade using VWAP, traders wait for prices to pull back near VWAP in a trending market to enter in the direction of a trend or look for a rejection from VWAP when the price fails to cross it. A stop loss is usually placed beyond the VWAP or recent swing low or high. A VWAP trading strategy is typically used in intraday trading.
A chart above clearly demonstrates how a VWAP acted like a support for a stock in an uptrend. Stock retraced back to VWAP, formed a kind of inverted head and shoulder pattern and continued its trend taking support from VWAP.

| Pros | Cons |
| Reliable intraday benchmark | Not suitable for long-term analysis |
| Reflects both price and volume | Resets daily, limiting multi-day use |
| Useful dynamic support and resistance | Can give false signals in choppy markets |
| Widely used by institutions | Less effective in low-volume stocks |
| Helps identify fair value | Not effective alone without confirmation |
Institutions execute 80%+ of large orders as a % of VWAP to reduce slippage, as per empirical execution algorithm studies.
46. Order Flow Trading
Order flow trading strategy focuses on real-time buying and selling data in the market instead of relying on traditional price charts and technical indicators. Order flow helps traders to identify the real move behind the market, where a large number of participants may be active.
This strategy involves the use of tools like Order Book (Market Depth), Bid–Ask Spread, Time & Sales (Tape Reading), Footprint Charts, and Volume Data. When buying orders repeatedly hit the ask price, it indicates bullish sentiment. Whereas, when selling orders continuously hits the bid, it signals bearish sentiments.
The image above is the order flow chart that displays real-time buying and selling activity at each price level. The numbers on the left represent trades at the bid (selling pressure), and the numbers on the right represent trades at the ask (buying pressure). Traders interpret this order flow data by comparing bid vs. ask volume at each price level to see who is more aggressive. If ask volume is higher, it means buyers are aggressive, and when bid volume is higher, sellers are aggressive.

| Pros | Cons |
| Provides real-time market insight | Requires advanced trading platforms |
| Helps identify momentum early | Steep learning curve |
| Improves entry precision | Can be overwhelming for beginners |
| Effective for scalping and intraday trading | Requires fast decision-making |
| Reduces reliance on lagging indicators | Not ideal for long-term investing |
As per quantifiedstrategies backtest, 3:1 bid/ask imbalance shows strong buyer or seller dominance, and professional backtests in ES futures found it precedes a 15-minute price move about 68% of the time.
47. Volume Profile Trading
Volume profile trading is the strategy that analyzes how much volume is traded at a particular price range instead of at a particular time. This helps traders to identify key price levels that the market considers to be fair.
Volume Profile works by plotting a horizontal histogram on the price chart, showing how much volume is traded at each price point. A price point with maximum volume is known as POC (Point of Control) and the zone where 70% of total volume is traded is known as value area. Traders look for this key price point to plan their trade.
The image above shows the volume profile tools plotted between swing low and swing high, where the red line indicates POC (point of control) and the area around it is the value area where 70% of total volume is traded.

| Pros | Cons |
| Identifies strong price-based support/resistance | Requires understanding of market structure |
| Shows institutional participation zones | Can be confusing for beginners |
| Works well in both intraday and swing trading | Needs high-quality volume data |
| Helps in breakout confirmation | Less useful in very low-liquidity stocks |
| Provides objective entry and exit levels | Not a standalone strategy |
POC often acts as a short-term price magnet, but it is not necessary that POC will act as support or resistance.
48. Market Profile Trading
Market profile trading is a strategy that analyzes the market structure by combining price and time data in a visual format called a TPO (Time Price Opportunity) chart. TPO charts show how long stock has traded at a particular price point, forming a bell-shaped distribution that highlights where the market found fair value.
This bell shaped distribution includes POC (Point of Control), where the market spent most of its time and value area, where the market spent 70% of its time. Once price moves beyond these value areas with strength, it indicates a potential trending move due to imbalance.
This image shows a TPO (Time Price Opportunity) market profile alongside the price chart. The left panel shows regular price movement over time. Whereas the right panel shows how much time the price spent at each level. The red line indicates POC, and the green indicates the value area.

| Pros | Cons |
| Clearly defines value and imbalance | It takes time to understand properly |
| Helps identify trending vs range days | Can be complex for beginners |
| Strong framework for intraday trading | Requires consistent observation |
| Works well in liquid markets | Not ideal for low-volume stocks |
| Improves trade location accuracy | Not effective as a standalone tool |
Market Profile works on Auction Market Theory, where markets rotate between balance (range/value area) and Imbalance (trend/price discovery).
49. Tape Reading
Tape reading is a strategy where traders analyze the market based on real-time data such as trade prints, bid-ask changes, and order flow to understand immediate price behavior. By tracking these data, traders try to identify whether buyers or sellers are in control.
To trade using these strategies, traders identify the large orders hitting the market, repeated trades at the same price, sudden speed in transactions, or strong buying that absorbs selling pressure. Tape reading is used by short-term traders because it provides insights before the market moves.
This image shows a tape reading screen for ES futures, where traders monitor real-time executed trades (Time & Sales), current bid/ask liquidity (Depth), and buying or selling pressure. Green prints show aggressive buyers, red prints show aggressive sellers, and the speed and size of trades help identify short-term momentum and absorption.

| Pros | Cons |
| Provides real-time insight into buying and selling pressure | Requires fast reaction and focus |
| Helps in precise intraday entries | Difficult for beginners |
| Useful for scalping and short-term trading | Can generate false signals during low volume |
| Shows hidden strength or weakness | Needs access to quality real-time data |
As per Hasbrouck (1991), Journal of Finance, order flow has a statistically significant impact on price changes. Buy-initiated trades tend to push prices up, whereas sell-initiated trades push prices down, validating the core logic behind tape reading.
50. Smart Money Concepts
Smart money is a trading strategy that involves identifying and following the footprint of big institutions such as banks, hedge funds, and large funds. The goal of this strategy is to understand market structure, liquidity, and institutional order placement to align our trade alongside institutions.
The key elements traders use to trade SMC include market structure, BOS (Break of Structure), CHoCH (Change of Character), liquidity sweep, FVG (fair value gap), and OB (Order Block). Traders enter the trade once the price enters the key zones like FVG or order block.
The above chart clearly demonstrates how an SMC is used to trade Bitcoin charts. A clear Break of Structure (BOS) concept helped identify the overall trend bias, and key areas of interest like FVG and order block helped with entry.

| Pros | Cons |
| Focuses on institutional behavior | Can be subjective in interpretation |
| Provides logical entry and exit zones | Requires strong market structure understanding |
| Works across forex, stocks, futures, and crypto | Not suitable for random or low-liquidity markets |
| Encourages trading with trend bias | Beginners may overcomplicate setups |
| Improves risk-to-reward potential | Needs patience and discipline |
Hasbrouck (1991), Journal of Finance, found that order flow has a statistically significant and partially permanent impact on prices. This supports the idea that large institutional trades leave identifiable footprints.
51. Quantitative Trading Strategy
Quantitative trading is a strategy where trade execution is done by algorithmic software based on mathematical models, statistical analysis, and predefined rules instead of human judgment.
Quantitative trading works on pre-defined rules given to the algorithms based on historical backtesting of data and identifying patterns. These patterns could be based on price behavior, volatility, momentum, mean reversion, arbitrage, or statistical relationships between assets.
This image above clearly explains the complete lifecycle of a quantitative trading strategy from idea to live deployment.

| Pros | Cons |
| Removes emotional decision-making | Requires coding and statistical knowledge |
| Allows backtesting before risking capital | Risk of overfitting historical data |
| Can trade multiple markets simultaneously | Needs reliable high-quality data |
| Consistent rule-based execution | May fail in changing market conditions |
| Suitable for automation | Development can be time-consuming |
As per the QuantInst backtest report from 2010 to 2025, a quant fund generates an average of 12-18% CAGR with a Sharpe ratio of 1.2-1.8.
52. Algo Trading
Algo trading, or algorithmic trading, involves the use of computers to automatically execute the buying and selling orders based on predetermined backtested rules and conditions. These conditions can be based on price, volume, timing, technical indicators, or mathematical models.
Algo trading starts with defining a rule that informs computers when to enter, exit, take profit, or trail the stop loss. After the rules are defined, strategy is coded in the computer where the computer continuously scans the market to match the given conditions. Once the conditions are met, the computer executes the trade automatically.
The above image is the dashboard of Tradlgo, showing the backtest result of an algo strategy called “Gamma Rider,” which displays key metrics like total profit (₹38,267), average daily profit, win vs. loss days, risk-to-reward ratio, and maximum drawdown. This means that predefined rules in this algo strategy are profitable and ready to deploy.

| Pros | Cons |
| Eliminates emotional decision-making | Requires coding knowledge or technical setup |
| Fast and precise execution | Vulnerable to technical errors |
| Can monitor multiple markets simultaneously | Strategy may stop working in changing conditions |
| Allows automation and scalability | Needs continuous monitoring |
| Consistent rule-based trading | Over-optimization risk |
Algorithmic trading dominates modern markets, where 70–80% of U.S. equity trading volume is executed electronically via algorithms, as per SEC Market Structure Reports and BIS (Bank for International Settlements) electronic trading studies.
53. Automated Trading Strategy
An automated trading strategy is a system where trades are automatically executed by computers based on predefined rules coded in programs or algorithms. These predefined rules include all trading conditions, like entry price, exit price, stop loss, position size, and risk limits.
Traders develop such trading strategies based on technical indicators, price action, statistical models, or quantitative rules. These rules are then coded into a trading program or algorithms. Once market conditions match the programmed rules, the system automatically executes the trade.
The above-given image clearly explains algorithmic trading as a process where human ideas are converted into coded instructions that automatically analyze current market conditions.

| Pros | Cons |
| Removes emotional bias | Requires technical knowledge |
| Fast execution | Risk of system failure |
| Can trade 24/7 | Overfitting risk |
| Backtesting capability | Market conditions can change |
| Scalable with capital | Requires continuous monitoring |
Indian markets are also dominated by algorithms; as per recent NSE data, over 60% of trading activity is now powered by algorithmic and high-frequency strategies.
54. AI Trading
AI trading is a trading approach that uses artificial intelligence and machine learning to analyze market data and patterns and make trading decisions automatically. Instead of following fixed rules like traditional automated trading, AI systems can learn from historical data and adapt to new market conditions.
As we can see in the flow chart mentioned above, AI trading works by collecting large amounts of data, using machine learning to analyse market patterns in this data. This model generates trade signals based on probabilities and predicted outcomes. Trades are automatically executed on a trading platform.

| Pros | Cons |
| Removes emotional bias | Requires technical knowledge |
| Fast execution | Risk of system failure |
| Can trade 24/7 | Overfitting risk |
| Backtesting capability | Market conditions can change |
| Scalable with capital | Requires continuous monitoring |
| Consistent rule-based trading | Infrastructure & data costs |
| Eliminates manual errors | Slippage in live markets |
| Handles large data efficiently | Dependence on historical data |
Research published on Zipdo by Alexander Eser shows around 78% of financial firms have integrated AI into their securities trading strategies, and 80% of investment banks use machine learning algorithms for trading and risk analysis.
55. Statistical Arbitrage
Statistical arbitrage is a quantitative trading strategy that aims to profit from the price inefficiencies between two related financial instruments. This strategy relies on statistical models to find out the price inefficiencies.
Statistical arbitrage works by buying undervalued assets and selling overvalued assets when the price temporarily moves away from the normal range, expecting them to return back to equilibrium. Unlike pure arbitrage, which is risk-free, statistical arbitrage carries risk because it depends on probability, not guaranteed price differences.
Both the stocks in the image above are seen staying close to each other with regard to closing prices. The periods where there are separations are those timeframes in which the arbitrage opportunities arise with the assumption that the stock prices will converge eventually.

| Pros | Cons |
| Market-neutral exposure | Requires advanced statistical knowledge |
| Reduces directional market risk | Relationships may break down |
| Based on measurable probability | Needs high-quality data |
| Suitable for automation | Can suffer during extreme volatility |
| Diversifiable across multiple pairs | Complex to build and maintain |
According to Gatev, Goetzmann & Rouwenhorst (2006), Review of Financial Studies, pairs strategy generated about 1% annual returns with a Sharpe ratio around 1.0+ before transaction costs.
56. Regression-Based Trading
Regression-based trading is a strategy that uses statistical regression models to compare the relation of price and other variables. This regression model is built using historical data and helps traders to identify whether the price is overvalued or undervalued relative to its expected value.
Linear regression is the most commonly used form. Traders plot a regression channel on a chart, where the center line represents the trend and the upper and lower bands show deviations. Once a price deviates far from its regression line, traders expect the price to come back to its mean. If the price touches the lower deviation band, traders plan to buy, and when the price touches the upper deviation band, traders plan to sell.
The above-given image is showing the linear regression channel, where the central line is a regression line that indicates the overall trend of price. The upper and lower lines represent the deviation bands. When a price moves near the lower line, it enters the buying zone because it is considered to be undervalued. When the price moves towards the upper line, it enters the selling zone because it is considered overvalued relative to the trend.

| Pros | Cons |
| Data-driven and objective | Requires statistical knowledge |
| Helps identify overvaluation and undervaluation | Relationships may change over time |
| Useful for mean reversion and pair trading | Model accuracy depends on data quality |
| Can be backtested systematically | Risk of overfitting |
| Reduces emotional bias | Not ideal in highly trending markets |
As per QuantInsti tests on forex pairs, rolling regression channels (2σ) capture 68% of price action reversals.
57. Correlation Trading
Correlation trading is a trading strategy that uses the statistical correlation between two or more assets to make a trading decision. It typically involves correlating the speed and the direction of the asset, which is measured between -1 and +1.
When a value is close to +1, it indicates assets are moving in the same direction. A value close to -1, it indicates that assets are moving in opposite directions. A trader mostly trades assets that show high positive correlation. When one asset falls sharply in one direction with positive correlation, traders sell the strong one and buy the weak one, expecting the price will adjust back.
As we can see in the above chart, EUR/GBP and GBP/USD are negatively correlated. Both the pairs have GBP as a common currency affecting both pairs, but in different ways. When GBP/USD falls (meaning GBP is weakening against USD), EUR/GBP often rises (meaning EUR is strengthening against GBP) and vice versa. Traders use this negative co-relation for confirmation, hedging, and pair trading strategies.

| Pros | Cons |
| Helps identify intermarket relationships | Correlations change over time |
| Useful for diversification and hedging | Can break during high volatility |
| Supports pair trading strategies | Requires statistical monitoring |
| Improves trade confirmation | False assumptions may lead to losses |
| Reduces single-asset risk exposure | Not effective in isolation |
According to Longin & Solnik (2001), Extreme Correlation of International Equity Markets, the correlation between global markets increases significantly during extreme downside events, where average equity correlations can rise from 0.3–0.5 in normal periods to 0.7–0.9 during crashes.
58. Cointegration Trading
Cointegration trading is a statistical trading strategy that identifies two or more assets moving similarly over the long term, even if they temporarily diverge in the short term. It focuses on finding out pairs with stable price relationships.
Traders identify two related assets, such as stocks from the same sector or companies with similar business models. Traders then apply statistical tests, such as the Engle-Granger test, to determine whether the price spread between the two assets is stationary. If the spread consistently returns to a mean level, the pair is considered cointegrated.
The chart mentioned above shows that the price of crude oil and gasoline moves similarly over a longer period of time. Even though they go up and down separately, they generally move in the same direction because gasoline is made from crude oil.
The lower chart reflects the spread (difference between the crude oil and gasoline prices). It is important to note that the spread oscillates around but converts to zero, rather than moving off indefinitely. The most important concept of cointegration is this so-called mean-reverting behavior.

| Pros | Cons |
| Stronger statistical foundation than correlation | Requires advanced statistical knowledge |
| Market-neutral exposure | Relationship may break permanently |
| Suitable for systematic trading | Needs continuous monitoring |
| Reduces directional market risk | Data-intensive and complex |
| Based on mean reversion logic | Not beginner-friendly |
According to Gatev, Goetzmann & Rouwenhorst (2006), Pairs Trading: Performance of a Relative-Value Arbitrage Rule, distance-based pairs strategy generated about 11% annual excess return before transaction costs with a Sharpe ratio of 1.0+.
59. Factor Investing
Factor investing is a trading strategy that involves selecting stocks by their specific character, called a “factor,” that has historically delivered higher returns. These factors include value, momentum, quality, size, or low volatility backed by decades of academic research and institutional adoption.
Investors begin factor investing by identifying the right factors to focus on. Once the factor is selected, traders build the portfolio of stocks that score high on the selected factors. Some strategies combine multiple factors, known as multi-factor investing, to reduce the risk.
The image above shows the two main categories of factors. Style factors include company-specific characteristics, and macroeconomic factors include economy-related drivers.

| Pros | Cons |
| Backed by academic research | Factors can underperform for years |
| Structured and data-driven | Requires periodic rebalancing |
| Reduces emotional stock selection | Not ideal for short-term trading |
| Diversifiable across multiple stocks | Performance varies across cycles |
| Suitable for long-term wealth building | Requires patience and discipline |
If we consider the market cap as a factor, according to Fama & French (1993), Common Risk Factors in the Returns on Stocks and Bonds, small-cap stocks have historically outperformed large caps, and value stocks (low P/B, low P/E) have historically outperformed growth stocks.
60. Risk Parity Strategy
Risk parity is a trading strategy where traders or investors build positions based on risk consideration rather than allocating the capital equally. This strategy helps traders to distribute their risk equally across all the assets.
This strategy works by analyzing the volatility of different instruments and allocating the funds accordingly. An asset with high volatility will receive less capital allocation compared to an asset with low volatility. This ensures that no single asset should dominate the portfolio risk profile.
This pie chart illustrates the difference between asset allocation and risk allocation in a traditional portfolio. A portfolio on the left looks balanced according to asset allocation with 60% stocks and 40% bonds.
But if we analyze the same portfolio according to risk allocation, stocks contribute about 90% of the total portfolio risk, while bonds contribute only 10%. It means even if capital is split between assets, the majority of risk often comes from equities. So a portfolio may appear diversified by allocation, but not by actual risk exposure.

| Pros | Cons |
| Balances risk instead of capital | Often requires leverage |
| Reduces portfolio concentration risk | Sensitive to interest rate changes |
| Performs well in diversified environments | Complex to implement properly |
| Provides smoother return profile | May underperform in strong equity bull markets |
| Focuses on long-term stability | Not suitable for short-term traders |
Research by Asness, Frazzini & Pedersen (2012), Leverage Aversion and Risk Parity, shows risk parity portfolios historically improved Sharpe ratios compared to traditional 60/40 portfolios.
61. Tail Risk Hedging
Tail risk hedging is a strategy designed to protect the portfolio from extreme market events, such as market crashes or sudden sharp declines. The term “tail risk” refers to rare but severe events that lie at the extreme ends of a probability distribution.
This strategy usually involves buying a far out-of-the-money put option or buying assets that rise sharply when the market falls. This strategy is not a profit-focused strategy, as the main objective is capital preservation in extreme market conditions.
The image shows a tail risk in terms of a bell curve, comparing between a normal curve and a fat-tail curve. The center reflects typical market trends, whereas the outer tails reflect excessive gains or losses. It highlights that real markets have more extreme events than normal models, which is why investors prepare for sudden crashes or sharp rallies.

| Pros | Cons |
| Protects against extreme market crashes | Regular cost of protection |
| Reduces portfolio drawdowns | May reduce overall returns in bull markets |
| Provides psychological comfort during volatility | Difficult to time perfectly |
| Helps preserve long-term capital | Options can expire worthless |
| Useful for large portfolios | Requires understanding of derivatives |
Financial markets exhibit fat-tailed return distributions, meaning extreme crashes occur more often than predicted by normal models.
62. High-Frequency Trading
High-frequency trading is a specialized automated trading strategy that uses high-speed computers to execute large numbers of trades within fractions of seconds. The aim of this strategy is to capture the very short price fluctuations and exit within a short period of time.
High-frequency trading strategies work on complex algorithms that continuously scan for micro-opportunities such as bid-ask spreads, arbitrage differences, or short-term order imbalances. This strategy uses heavy technology, placed physically near an exchange, which is practically not possible for retail traders to do.
This diagram above shows that retail orders go through brokers to exchanges like NYSE and NASDAQ, while HFT firms such as Jane Street, Citadel Securities, and Virtu Financial use ultra-fast systems to execute high-speed trades, provide liquidity, and react to order flow within milliseconds.
| Pros | Cons |
| Extremely fast execution | Requires expensive infrastructure |
| Captures small inefficiencies repeatedly | Not accessible to most retail traders |
| Low directional exposure | Highly competitive environment |
| Fully automated and systematic | Vulnerable to technical failures |
| Works well in liquid markets | Profit margins are very small |
HFT contributes significant portion of equity trading volume, estimated around 40–50% of total U.S. equity volume, as per SEC Market Structure Reports and TABB Group industry research
63. Dark Pool Tracking Strategy
Dark Pool Tracking trading strategy involves monitoring and interpreting the large institutional trade execution in private exchanges known as “Dark Pools.” This dark pool allows institutions to execute large orders without revealing it to the public market.
Although the Dark Pool orders are not directly visible to the public exchange, it still leaves out certain data such as unusual block trades, dark pool volume spikes, or off-exchange transactions which can be tracked by specialized platforms. Cheddar Flow, Intrinio, and Polygon.io are few of the well known dark pool data providers.
The image above is a dashboard of the platform Cheddar Flow, showing real-time dark pool data. It highlights flow sentiment, put-call ratio, call and put volume, and detailed trade activity in stocks like NVDA, SPY, and TSLA. Traders can use this data to locate smart money positioning, identify unusual options activity, and gauge whether institutional flow is bullish or bearish before making trading decisions.
| Pros | Cons |
| Provides insight into institutional activity | Data is often delayed |
| Helps identify accumulation or distribution | Not all dark pool trades are directional |
| Useful in large-cap stocks | Limited access for retail traders |
| Can confirm technical setups | Requires experience to interpret correctly |
| Adds institutional context to trading decisions | Not effective as a standalone method |
Dark pools contribute a significant portion of the U.S. equity trading volume, which is nearly 35-45%, according to FINRA & SEC market structure reports.
64. Macro Trading
A macro trading strategy involves analyzing large-scale economic trends, global events, and monetary policies to make buying and selling decisions instead of focusing on charts and indicators.
This strategy works by studying interest rates, inflation, GDP growth, central bank decisions, and geopolitical events that influence financial markets. These parameters directly influence the price of stocks, indices, bonds, currencies, and commodities. In macro trading, positions are usually held for medium- to long-term time duration.
During the Union Budget 2026, it triggered sharp volatility, with the Sensex dropping over 1,800 points and Nifty falling below 25,000 due to STT hikes and policy surprises. Traders can trade such events where moves are sharp and have a strong trending momentum.

| Pros | Cons |
| Trades major economic trends | Requires strong economic knowledge |
| Works across multiple asset classes | Macro predictions can be wrong |
| Suitable for medium- to long-term trading | Positions may face high volatility |
| Aligns with central bank and policy cycles | News events can disrupt setups |
| Can capture large trend moves | Timing entries can be challenging |
Historically, global macro hedge funds have delivered an 8-12% average annual return over long-term periods, according to Fung & Hsieh (2002), Financial Analysts Journal.
65. Interest Rate Trading
Interest rate is a trading strategy where traders take positions based on actual or expected change in central bank interest rate. Since changes in interest rates directly affect the cost of borrowing, liquidity, and capital flow, they almost influence every asset class.
When central banks such as the RBI, Federal Reserve, or ECB increase the interest rate, borrowing becomes expensive, which slows down the business and reduces the stock market momentum. However, when interest rates fall, liquidity increases and borrowing becomes cheaper, increasing equities.
The above image shows the US 10-Year Bond Yield vs S&P 500 chart, representing how interest rates and stock market moves differently over a period of time. As we can clearly see, whenever yields rise sharply, markets often face pressure, and when yields fall, equities tend to perform better. Traders can use this macro indicator to adjust risk, stay cautious during rising yield phases, and increase exposure when yields start declining.

| Pros | Cons |
| Based on powerful macro drivers | Requires strong economic understanding |
| Influences multiple asset classes | Markets may already price in expectations |
| Suitable for medium- to long-term trends | High volatility around announcements |
| Works well in forex and bond markets | Timing can be difficult |
| Aligns with monetary policy cycles | Unexpected policy shifts can disrupt trades |
Interest inversely affects the bond price, especially longer duration bonds. A bond with duration of 7 years will approximately lose 7% in value if yields rise by 1%.
66. Inflation-Linked Trading
Inflation-linked trading is a strategy where traders make positions based on changed or expected changes in inflation. Since inflation directly affects the interest rates, purchasing power, corporate profits, and currency strength, it plays a major role in asset pricing.
When inflation rises, the central bank increases the interest rate, which lowers the moment in the equity market but strengthens the domestic currency and bond yield. Whereas when inflation lowers, low interest rates support equities, especially the growing sector.
The above image shows the historical behavior of inflation and equity returns. They both are negatively correlated, which means the market falls when inflation rises and vice versa. During 2022’s high CPI inflation (peaking near 7.8%), the Nifty 50 fell around 10% amid rate hikes, with rate-sensitive sectors like banking (e.g., HDFC, ICICI) underperforming.

| Pros | Cons |
| Based on major economic driver | Inflation data can be volatile |
| Helps anticipate central bank policy | Markets may price in expectations early |
| Useful for sector rotation strategies | Requires macro understanding |
| Applicable across equities, bonds, forex, commodities | Short-term reactions can be unpredictable |
| Supports long-term portfolio positioning | Not ideal for pure intraday trading |
Commodities tend to perform well during unexpected inflation shocks, especially Gold. Gold has historically reacted positively during periods of rising inflation expectations and monetary expansion.
67. Merger & Acquisition (M&A) Trading
Merger & Acquisition (M&A) trading is an event-based trading strategy where traders take positions based on price movement accrued when one company announces a merger and acquisition with another company.
When a company announces a merger & acquisition, it usually offers a premium price over the current price of the target company. This makes the targeted company stock price rise close to the offer price. This price difference is called the “deal spread,” which traders attempt to trade. Traders buy such company stocks and hold them until the deal closes.
Above is the chart of RBL Bank, which jumped over 9% in a day on October 20 after Emirates NBD announced plans to acquire a majority stake in the listed domestic private sector lender. This jump hit a new 52-week high in RBL Bank with a good volume. A trader can watch out for such news to identify potential breakout opportunities and strong momentum.

| Pros | Cons |
| Event-driven and structured | Deal cancellation risk |
| Potentially predictable spread returns | Regulatory uncertainty |
| Market-neutral possibilities in stock deals | Returns may be limited |
| Short- to medium-term strategy | Requires detailed deal analysis |
| Less dependent on overall market direction | Sudden negative announcements can cause sharp losses |
This strategy involves deal-break risk. Research documented in merger outcome datasets analyzed across U.S. equity markets shows that when deals fail, target stocks can fall sharply, often 20–30% or more immediately.
68. On-Chain Data Trading
On-chain data trading is a crypto trading strategy where traders analyze the blockchain transaction data to predict the future price movement of cryptocurrencies. This transactional data includes wallet activity, exchange flows, whale movements, miner behavior, and network metrics directly from the blockchain, instead of using charts and indicators.
Every transaction is recorded on a public blockchain, and the data is transparent for everyone. Traders use these data to access the real-time activity of big players known as whales. If whales are accumulating and the price is consolidating, it indicates hidden strength and vice versa.
The screenshot above shows a Bitcoin on-chain analytics dashboard powered by IntoTheBlock that gives a quick market sentiment overview. The top section (Token Summary) analyses the 8 key metrics, which suggest the current condition of Bitcoin based on on-chain data. Whereas the bottom signals section summarizes multiple indicators into a directional bias.

| Pros | Cons |
| Transparent and real blockchain data | Requires specialized tools |
| Helps detect accumulation/distribution | Interpretation can be complex |
| Useful for long-term cycle analysis | Not always effective for scalping |
| Can identify whale behavior | Data lag in some metrics |
| Less dependent on news speculation | Crypto-specific strategy |
Research by Liu & Tsyvinski (2021) in Risks and Returns of Cryptocurrency shows that blockchain metrics such as transaction volume and active addresses are positively related to future returns and network value.
69. Yield Farming Strategy
Yield farming is a crypto trading strategy where investors provide liquidity to decentralized finance (DeFi) platforms in exchange for rewards instead of holding the token.
Investors deposit their crypto into liquid pools, leading platforms, or decentralized exchanges such as Uniswap, Aave, Curve Finance, and PancakeSwap, where traders use this liquidity to swap or borrow assets. Later on these platforms distribute profits to investors as trading fees
lending interest, incentive tokens, and token appreciation.
The image explains yield farming in DeFi, where investors deposit crypto assets into a decentralized platform that lends them to borrowers. Borrowers pay interest on the loans, and investors earn that interest as yield.

| Pros | Cons |
| High potential returns | Impermanent loss risk |
| Earn passive income | Smart contract risk |
| Works well in bull markets | Token price volatility |
| Many platform choices | Complex for beginners |
| Can compound rewards | Regulatory uncertainty |
During 2020–2022, major DeFi protocols gave average annualized yields ranging between 4%–20%, according to Schär, F. (2021), Decentralized Finance
70. Staking-Based Trading
Staking-based trading is a crypto trading strategy where traders lock in their crypto coins to earn rewards while also trying to make money from price movements. Traders lock their crypto in Proof-of-Stake (PoS) blockchains to earn extra coins over time, known as staking yield.
Traders stake the coins when the market looks strong, making profit from staking yield and capital appreciation. Trades unstake the coin when the market is looking weak. Instead of unstaking, traders also sell futures contracts to hedge the risk.
The image above clearly explains the Proof of Stake (PoS) in a simple way, where vendors’ validators like Nitin, Shivam, and Vijay lock or “stake” some of their coins to get a chance to add the next block of transactions. Among them one validator is randomly chosen to create the block. If the block is valid, they earn the reward; if it’s invalid, they lose their staked coins.

| Pros | Cons |
| Earn passive income | Token price volatility |
| Predictable staking rewards | Lock-up period risk |
| Can compound rewards | Slashing risk (validator penalties) |
| Works well in bull markets | Smart contract risk |
| Lower effort than active trading | Regulatory uncertainty |
| Supports network security | Inflation dilution risk |
| Suitable for long-term holders | Opportunity cost during strong trends |
| Multiple platform choices (e.g., Ethereum staking) | Platform / exchange counterparty risk |
According to DataWallet, over 35.8 million ETH is staked, representing 28.9% of total supply, with an average current yield of 3.3% APY.
How to Backtest a Trading Strategy?
There are five major steps to backtest the trading setups. The steps involve defining a trading setup, collecting historical data, doing backtesting using either a manual or automated way, analyzing the key metrics, and optimization.
- Define trading setup: Start with defining the trading rules, such as instrument, entry/exit criteria, risk per trade, timeframe, and position sizing.
- Collect Historical Data: Collect the historical data of the last 5-10 years from the authentic sites, such as TradingView or NSE. Make sure to adjust the corporate actions on stocks.
- Manual Backtesting: It involves backtesting the setup by scrolling chart candle by candle, ideal for visual setups, such as order blocks or gaps. It is a slower process but builds a deep market understanding.
- Automated Backtesting: It involves use of programming languages such as pinscript or python. It is ideal for rule based trading setups and is a faster way for backtesting. The common platforms used involve Excel, Amibroker, TradingView, Python, etc.
- Analyze Key Metrics: Analyze the key metrics mentioned below in the table.
| Metric | Description | Ideal Target |
| Win Rate | Percentage of profitable trades | > 50% with favorable risk–reward |
| Profit Factor | Total gross profit ÷ total gross loss | > 1.5 |
| Maximum Drawdown | Largest peak-to-trough equity decline | < 20% |
| Sharpe Ratio | Risk-adjusted return per unit of volatility | > 1.0 |
| Expectancy | (Average Win × Win %) − (Average Loss × Loss %) | Positive |
A good trading strategy follows all the key metrics mentioned above in the table.
Optimization: Tweak the parameters in your setup if the setup does not follow the above-given key metrics. It is important not to do curve fitting and excessive parameter tweaking.
Proper backtesting validates a trading setup with data, builds trader confidence, and ensures decisions are based on logic rather than assumptions, forming the foundation for consistent and disciplined trading.
How to Measure the Performance of a Trading Strategy?
Measuring the performance of a trading strategy involves analyzing the key metrics like return, drawdown, expectancy, risk-reward ratio, profit factor, and risk-adjusted returns. Measuring these metrics helps trades understand whether the strategy has a real edge, controls risk properly, and can survive different market conditions.
Given below is the performance measurement table, which you can use to evaluate any trading strategy.
| Metric | What It Measures | Formula | Ideal / Interpretation | Why It Matters |
| Total Return (%) | Overall profit generated | (Final Capital − Initial Capital) / Initial Capital × 100 | Higher is better | Shows raw profitability |
| CAGR | Annualized growth rate | (Ending Value / Beginning Value)^(1/n) − 1 | 15–25%+ strong (retail trading) | Measures consistency over time |
| Win Rate (%) | Trade accuracy | Winning Trades / Total Trades × 100 | Depends on RR | Impacts psychological comfort |
| Risk–Reward Ratio | Avg win vs avg loss | Avg Win / Avg Loss | Above 1.5 preferred | Determines profitability structure |
| Expectancy | Average profit per trade | (Win% × Avg Win) − (Loss% × Avg Loss) | Must be positive | Confirms real edge |
| Maximum Drawdown (%) | Largest capital decline | Peak-to-Trough % fall | <20–25% ideal | Measures risk & survival |
| Profit Factor | Gross profit vs gross loss | Total Gross Profit / Total Gross Loss | >1.5 strong, >2 excellent | Shows efficiency of system |
| Sharpe Ratio | Risk-adjusted return | (Return − Risk Free Rate) / Std Dev | >1 good, >2 strong | Professional risk metric |
| Average Holding Period | Trade duration | Total Holding Days / Total Trades | Depends on style | Aligns with strategy type |
| Equity Curve Stability | Consistency of growth | Visual analysis | Smooth upward slope | Reveals structural strength |
This table will help you to build a strategy which delivers controlled returns with managed risk, consistent execution, and long-term survivability.
Which Tools are Necessary to Develop a Successful Trading Strategy?
Tools necessary to develop a successful trading strategy are briefly mentioned below, which includes charting platform, backtesting software, risk management, and a trading journal.
- Charting Platform: A professional charting platform is a core foundation of building any strategy. TradingView or MetaTrader is a well-known charting platform that provides advanced charting tools, multiple timeframe analysis, drawing tools, and custom indicators.
- Backtesting Software: Before executing any strategy in real time, it is important to backtest the strategy on historical data. Backtesting helps you measure win rate, risk-to-reward ratio, maximum drawdown, and strategy expectancy of your strategy.
- Risk Management and Position Sizing: Risk management tools help traders to protect their capital and maintain consistency. Position sizing makes sure that you don’t lose more than a fixed percentage per trade. High-probability setups also fail if the risk is not controlled.
- Trading Journal: A trading journal involves documenting trade entries, exit logic, setup type, emotional state, and outcomes, which helps traders to identify the recurring mistakes and strengths. By studying their past trades, traders improve their trading strategy.
By combining the right tools with disciplined testing and proper risk control, traders can build a strategy that is not only profitable on paper but sustainable in real market conditions.
What are the Best Books to Learn Trading Strategies?
The best books to learn trading strategies are mentioned below in the table. These books cover psychology, technical analysis, system-based trading, and real trader insights.
| Book Title | Author | Focus / Strategy Type | Why It’s Valuable |
| Market Wizards | Jack D. Schwager | Interviews & mindset | Deep insights into various trading strategies from top traders. |
| Trend Following: Learn to Make Millions in Up or Down Markets | Michael Covel | Trend-following systems | Classic on capturing long-term market trends. |
| The Complete TurtleTrader | Michael Covel | Systematic trend strategy | Real-world systematic trading rules and lessons. |
| Trading for a Living | Dr. Alexander Elder | Psychology & technical strategies | Combines psychology, risk management & trading setups. |
| How to Make Money in Stocks | William J. O’Neil | CAN SLIM growth strategy | Blends fundamental + technical criteria for stock selection. |
| Trading in the Zone | Mark Douglas | Psychology | Focuses on mindset and discipline essential for strategy execution. |
| The Intelligent Investor | Benjamin Graham | Value-driven strategy | Core investing and risk management lessons traders benefit from. |
| Reminiscences of a Stock Operator | Edwin Lefèvre | Trader psychology & behavior | Classic narrative with timeless strategy ideas. |
| High Probability Trading | Marcel Link | Probability based tactics | Strategy on trading only statistically favorable setups. |
| Mastering the Trade | John F. Carter | Day & active trading strategies | Tactical strategies, entries/exits, and risk management. |
Read these books, master the concepts, test them with discipline, and refine them through experience, because in trading, strategy works only when execution and psychology align.


 Previous Article


![15 Investing.com Alternatives [Free+Paid] You Should Use in 2026](https://www.strike.money/wp-content/uploads/2026/04/Investing.com-Alternatives.jpg "15 Investing.com Alternatives [Free+Paid] You Should Use in 2026 276")
![15 TradeStation Alternatives [Free+Paid] You Should Use in 2026](https://www.strike.money/wp-content/uploads/2026/04/TradeStation-Alternatives.jpg "15 TradeStation Alternatives [Free+Paid] You Should Use in 2026 277")
![15 Chartink Alternatives [Free+Paid] You Should Use in 2026](https://www.strike.money/wp-content/uploads/2026/04/Chartlink-Alternatives.jpg "15 Chartink Alternatives [Free+Paid] You Should Use in 2026 278")
: Overview, 10 Types of Indicators, Settings for Different Markets 279")


 : Definition, Formula, calculation, Uses, Advantages Vs limitations 282")


No Comments Yet.