A death cross is one of the widely used signals in technical analysis, often discussed when markets begin to show signs of sustained weakness. A death cross typically appears during periods of declining momentum and warns the traders and investors to pay closer attention to the broader trend and potential downside risk.
Significant market downturns, including the 2008 world financial crisis, the 2015 world slowdown, and the 2022 bear market, were accompanied by death cross indications on key indexes in the past. Studies on indices such as the S&P 500 and NIFTY 50 demonstrate that these indicators are rather infrequent, and that is why much attention is paid to them when they do occur.
What is a Death Cross in Stock Market?
A death cross in the stock market is a bearish technical signal that occurs when the short-term (50-day) moving average crosses below the long-term (200-day) moving average. This stock market technical signal suggests that the short-term momentum is weakening relative to the long-term trend, signaling that sellers are gaining control in the market.

What Causes a Death Cross?
The death cross is caused by several factors, which initiate prolonged selling pressure. These factors include economic slowdowns, rising interest rates, geopolitical uncertainty, weak corporate earnings, or major market corrections. These factors cause the price to decline over weeks or months, leading the short-term moving average to fall, forming a death cross.
What Happens When a Death Cross Occurs?
When a death cross occurs, it signals a shift in market sentiment from bullish to bearish, where the market shows four major reactions.
- Panic selling or reduced exposure: Many traders exit their positions after a death cross to avoid further losses.
- Institutional rotation: Large institutional investors shift their funds into defensive sectors, such as the healthcare sector, consumer staples sector, and utilities sector, which relatively remain stable during economic slowdowns.
- Higher volatility: After a death cross, panic selling and institutional exits increase price fluctuations and uncertainty.
- Bearish sentiment: Market participants become more cautious and negative about future price movements.
A death cross does not always lead to major market decline. Sometimes markets stabilize or recover after the signal, depending on whether the decline is driven by structural crises like the 2008 global financial crisis or temporary shocks, as changes in volatility can influence how the market reacts. Monitoring volatility helps traders understand whether the move is likely to extend or fade.
Why is it called a Death Cross?
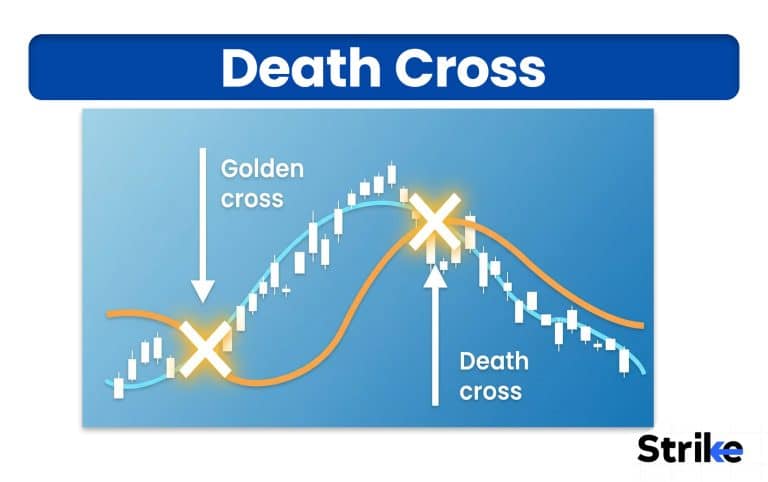
It is called a death cross because the cross of the short-term moving average below the long-term moving average visually resembles the shape of an “X” associated with death or warning. The term “death” symbolically represents a bearish implication, signaling the potential “death” of an uptrend and the start of prolonged declines.
The dramatic name also helps the pattern stand out in financial media as a strong warning signal. It reflects the bearish sentiment and fear among investors, as the pattern has historically appeared before major market downturns such as the Wall Street Crash of 1929 and the 2008 Global Financial Crisis.
How Does a Death Cross Work in Technical Analysis?
In technical analysis, a death cross works in three major phases, showing a gradual transition of sentiment from bullish to bearish. These phases include loss of upward momentum, crossover, and sustained downtrend or consolidation.
- Loss of upward momentum (Phase 1): In this phase the existing uptrend begins to peak as buying pressure starts fading and selling pressure increases. In this phase, the short-term moving average starts flattening and converging toward the long-term moving average.

- Crossover (Phase 2): Price drops further, narrowing the gap until the short-term moving average crosses below the long-term moving average. This point serves as a technical confirmation of a trend shift from bullish to bearish.

- Sustained downtrend or consolidation (Phase 3): After the crossover, it may continue moving downwards or enter a sideways consolidation phase as bearish sentiment dominates.

The Death Cross acts as a long-term trend signal in Technical Analysis, helping traders recognize weakening market conditions and adjust their trading or risk management strategies accordingly. In Technical Analysis, it is widely used to identify potential bearish phases and protect capital.
What Two Moving Averages Form the Death Cross?
The death cross is formed using two specific moving averages, mainly the 50-day and 200-day. A 50-day moving average acts as a short-term moving average representing the recent price trend, whereas a 200-day moving average acts as a long-term moving average representing the broader price trend.
Historical Examples of the Death Cross
Some of the notable death cross signals that appeared in Indian market indices are briefly discussed below.
2008 Global Financial Crisis: During the 2008 global financial crisis, Nifty peaked around 6,357 in January 2008 and formed a death cross on April 8, 2008, after the global credit crisis intensified. After the cross, the index continued to fall sharply, eventually plunging about more than 50% to nearly 2,253 by October 2008.

2015 Global Market Volatility: During the global market volatility in 2015, the NIFTY 50 entered a death cross in the month of September 2015. The index continued to fall low after the death cross signal, and it finally dropped to approximately 6,825 in February 2016, indicating a fall of approximately 13% since the crossover period. It was later revealed that the market stabilized and slowly recovered in mid-2016 with the global situation improving and domestic sentiment boosted.

2020 COVID-19 Market Crash: During the COVID-19 pandemic market crash of 2020, Nifty experienced a rapid sell-off, forming a death cross around March 13, 2020. The index fell by 25% after the death cross and 40% from its peak of 12,400. The market recovered nearly 100% within the next 12 months due to massive global stimulus and liquidity measures.

How to Find Death Cross Stocks?
There are two main methods to find death cross stocks: manual chart analysis and automated stock screeners.
- Manual Chart Checking: In this method, traders add 50-day and 200-day moving averages on the chart and manually identify the point where the 50-day moving average is crossing below the 200-day moving average, signaling a potential death cross.
- Stock Screeners: This method involves theuse of screening software such as Strike Money, Charting, Screener, TradingView, etc. Go to the scanner or screener section on these platforms and look for moving average crossover or death cross scanners. These tools automatically scan the market and list stocks where the 50-day moving average has crossed below the 200-day moving average.
If there is no ready-made death cross scanner, traders can create a custom scan by adding a query where the 50-day EMA crosses below the 200-day EMA to identify potential death cross signals.
How to Trade the Death Cross Strategy
There are five major steps to the death cross strategy. The steps include crossover identification, signal confirmation, entry, stop-loss, and profit target.
- Identifying the crossover: Look for the point where the 50-day moving average crosses below the 200-day moving average, forming a death cross. Ensure that crossover occurs after a declining price structure, making lower lows and lower highs.

- Confirm the Signal: Confirm the crossover by identifying a break of a key support level, increased trading volume, RSI falling below 50, or a pullback toward the moving averages followed by rejection.

- Entry: An aggressive trader can enter immediately after a death cross happens, whereas a conservative trader can enter after a pullback and rejection from 50 or 200-day moving averages.

- Stop loss: Place your stop loss near a recent resistance level or above the 200-day moving average.
- Profit Target: Consider taking profit near previous support, recent swing low, or 1:2 RR. Profit targets can also be trailed using a 50-day moving average.
By following the above steps, traders can use the Death Cross strategy to identify bearish trends, plan short trades, and manage risk more effectively in declining markets.
How to Use the Death Cross for Short Selling?
A death cross can be used to filter out weak stock suitable for short selling. Traders often scan for a stock forming a death cross, where stocks are more likely to remain under selling pressure, making them potential candidates for a short trade.
After filtering weak stocks using the death cross, traders typically look for pullbacks, resistance near moving averages, or support breakdowns to initiate short selling trades. This approach to short selling helps traders align with the prevailing downtrend and improve trade probability.
What is the Best Timeframe for Using Death Cross?
A higher timeframe likedaily and weekly is the best timeframe to use for a death cross because it helps to identify long-term trend reversals. The standard death cross uses a one-day period moving average, which naturally makes it more reliable for swing trading and long-term market analysis.
The weekly chart provides an even stronger signal but appears less frequently compared to the daily chart. In a lower timeframe, such as intraday charts, the signal tends to produce more false signals due to market noise.
How to Use the Death Cross Indicator?
The death cross indicator is useful to identify the potential long-term bearish trend by plotting it on a chart. This indicator can be plotted on any trading platforms that offer charts, such as Strike Money, TradingView, Investopedia, etc. There are five major steps to apply and use death cross indicators.
- Select the Asset and Timeframe: Open any preferred platform and choose the asset, such as a stock, index, or commodity, and select a daily or weekly chart.

- Apply Moving Averages: Open the chart, go to the indicator section, and search for the EMA cross indicator. Change the settings of EMA to 50-day and 200-day or add 50 EMA and 200 EMA individually.

- Identify the Death Cross: Look for the point where the 50 (short-term) EMA crosses below the 200 (long-term) EMA, indicating potential bearish momentum.

- Confirm the Trend: Use additional indicators like RSI, volume, or trendlines to reduce false signals.
- Plan Action: Decide whether to reduce exposure, take short positions, or set alerts for monitoring.
Always remember that the death cross is a lagging indicator, so it’s best used in combination with other tools and analysis to confirm trends and avoid false signals.
Death Cross Settings in Different Markets
Although 50 and 200 days remain the most widely used combination, traders adjust death cross settings based on the speed, volatility, and trading style of different markets. The death cross settings in different markets are mentioned below in the table.
| Market | Common Death Cross Settings | Reason |
| Stock Market | 50-day MA & 200-day MA | Standard setting used to identify long-term trend reversals in stocks and indices. |
| Forex Market | 20-day MA & 50-day MA | Forex markets move faster, so shorter averages help capture quicker trend shifts. |
| Cryptocurrency Market | 50-day MA & 100-day MA | High volatility requires slightly faster signals compared to traditional markets. |
| Commodities Market | 50-day MA & 200-day MA | Used to track long-term price trends in commodities like gold or crude oil. |
These settings may vary depending on the market conditions, trading timeframe, and trader’s strategy, so traders often adjust the moving average periods to better suit the asset they are trading, especially in trend trading. In trend trading, such customization helps align indicators with the prevailing market direction.
Why do Traders use Death Cross?
Traders typically use death crosses for four main reasons. The reasons are simplicity and visual clarity, bear market confirmation, help in risk management, and it being widely followed.
- Simplicity and visual clarity: Visually the death cross is easy to identify on charts, which makes it a simple tool for spotting potential trend reversals.
- Confirms loss of bullish momentum: The crossover suggests that buying pressure is fading and selling pressure may start dominating.
- Risk management signal: Many traders use the death cross as a warning sign to reduce their long positions, tighten stop-loss, or shift to defensive positions.
- Widely followed indicator: As the death cross is monitored by retail and large institutions, the signal often influences market sentiment and trading decisions.
Death Cross helps traders identify weakening market trends, manage risk, and adjust their strategies when bearish conditions start emerging.
Why does the Death Cross Sometimes Fail?
There are four main reasons for death cross failure. The reasons are its lagging nature, sideways market, and strong bull run.
- Lagging Nature: By the time crossover happens, a large part of the decline may have already happened, increasing the chance of a market rebound.
- Sideways Market: When a price moves within a narrow range, it frequently generates death cross signals without a clear trend.
- Strong Bull Market: During a strong bull market, temporary corrections often trigger death cross signals, but the market quickly resumes its upward trend.
The death cross is not always reliable on its own. Traders often combine it with other indicators, market context, and price action to avoid false signals and improve decision-making.
How Reliable is the Death Cross?
The death cross is considered a moderately reliable bearish signal, but it is not always accurate due to its lagging nature. Backtest results from Quantified Strategies on the S&P 500 show that the market often experiences weak performance for a short term after a death cross. However, over the long term, the market usually recovers and continues to generate positive returns.
The study also found that trading based on selling at the Death Cross and buying at the Golden Cross produced very low annual returns of around 0.4%, indicating that the signal works better as a risk-management or trend-confirmation tool rather than a standalone trading strategy.
How often does a Death Cross Occur?
A death cross occurs infrequently, roughly every 1-3 years on major indices like the S&P 500 or Nifty 50, because it requires significant change in a trend. Since 1950, the S&P 500 has seen approximately 34 death crosses, which is about once every 2.2 years, as per LSEG data. As a death cross signal requires significant change in trend, it usually appears during major corrections or bear markets.
How Long It Takes to Recover from Death Cross?
Recovery from a death cross typically takes 3-12 months on average for major indices like the S&P 500 or Nifty, although extreme bear markets can take longer, like the 2008 financial crash, which took more than 18 months to recover from.
The S&P 500 during the COVID death cross recovered +55% in 12 months via a V-rebound. In 2022, the market entered a bearish phase and fell about 12% over the next six months after the death cross. The decline continued until February 2023, when a golden cross appeared, signaling a potential recovery in the market.
How to Backtest the Death Cross Strategy
There are five major steps to backtest the death cross strategy. The steps include selecting the asset, applying the moving average cross, backtesting the data, and analyzing and optimizing.
- Select the Asset and Timeframe: Choose the asset, such as stocks or an index, with a timeframe like daily or weekly along with historical data.
- Apply the Moving Average Crossover: The commonly used moving averages in a death cross are the 50-day and 200-day moving averages.
- Define Entry and Exit Rules: Decide whether to enter immediately after the death cross or wait for a pullback to the 50-day moving average for a better entry. The exit can be planned when the price moves above a moving average or when a golden cross forms.
- Backtest: Backtesting of death cross can be done either manually by marking death cross on chart or automatically using backtesting software or programming languages.
- Analyze and Optimize: After backtesting, analyze the key metrics like win rate, average return, maximum drawdown, and risk-reward ratio to evaluate how the strategy performed. Adjust the moving average periods, filters, or entry and exit rules to see if the strategy performance improves across different market conditions.
Avoid over-optimizing the strategy during backtesting, as too many adjustments may make the results fit past data perfectly but perform poorly in real market conditions.
Is Death Cross a Lagging Indicator?
Yes, a death cross is a lagging indicator because it generates a signal using a moving average, which itself uses past price data. Therefore, the crossover only appears when weeks of prior declines have already pushed short-term averages lower.
According to research by TOI Indicators, 54% of the time, the market had already reached its bottom before the death cross appeared. Although the death crossover signal arrives late, it protects against the false breakout.
Is Death Cross Bullish or Bearish?
A death cross is a bearish signal in technical analysis suggesting that the recent prices are falling faster than the long-term trend, indicating weakening momentum. When the 50-day moving average drops below the 200-day moving average, the overall trend shifts downwards.
Is Death Cross the Opposite of Golden Cross?
Yes, the death cross is the exact opposite of the golden cross in technical analysis. A death cross occurs when the 50-day moving average crosses below the 200-day moving average, signaling a shift of sentiment from bullish to bearish. Conversely, a golden cross occurs when the 50-day moving average crosses above the 200-day moving average, signaling a shift of sentiment from bearish to bullish.
Difference between Death Cross & Golden Cross
The difference between death cross and golden cross is mentioned below in the table
| Feature | Death Cross | Golden Cross |
| Meaning | Bearish technical signal indicating potential downtrend | Bullish technical signal indicating potential uptrend |
| Moving Average Crossover | 50-day moving average crosses below the 200-day moving average | 50-day moving average crosses above the 200-day moving average |
| Market Sentiment | Negative or bearish sentiment | Positive or bullish sentiment |
| Typical Market Phase | Often appears during the start of a downtrend | Often appears during the start of an uptrend |
| Trading Approach | Traders may reduce exposure or take short positions | Traders may look for buying opportunities |
| Signal Type | Bearish trend reversal signal | Bullish trend reversal signal |
The Golden vs Death Cross concept highlights how the death cross signals potential bearish momentum, while the golden cross indicates possible bullish momentum. Traders use these signals within the Golden vs Death Cross framework to understand the overall market trend and align their trading decisions accordingly.


 Previous Article


![15 Investing.com Alternatives [Free+Paid] You Should Use in 2026](https://www.strike.money/wp-content/uploads/2026/04/Investing.com-Alternatives.jpg "15 Investing.com Alternatives [Free+Paid] You Should Use in 2026 56")
![15 TradeStation Alternatives [Free+Paid] You Should Use in 2026](https://www.strike.money/wp-content/uploads/2026/04/TradeStation-Alternatives.jpg "15 TradeStation Alternatives [Free+Paid] You Should Use in 2026 57")
![15 Chartink Alternatives [Free+Paid] You Should Use in 2026](https://www.strike.money/wp-content/uploads/2026/04/Chartlink-Alternatives.jpg "15 Chartink Alternatives [Free+Paid] You Should Use in 2026 58")
: Overview, 10 Types of Indicators, Settings for Different Markets 60")

 : Definition, Formula, calculation, Uses, Advantages Vs limitations 62")


: How We Used This 70/30 Indicator in 6 High Win-rate Strategies 65")


No Comments Yet.