Pullback trading is one of the most practical ways of trend trading without chasing the market. Pullback trading allows traders to position themselves in a more strategic way by waiting for price to get under better zones where risk is controlled and potential reward is high.
In real market conditions, price moves in waves instead of moving in a straight line, where these short-term corrections often create opportunities for disciplined traders. Understanding how pullbacks form and behave builds a strong foundation for identifying high-probability entries, which is why this concept is widely used across intraday, swing, and positional trading.
What is Pullback Trading?
Pullback trading is a trading approach where traders enter the trade on a temporary price move against the main trend, expecting the price to resume its main trend. Instead of catching a big move, traders wait for a short-term retracement to enter a trade at a better price in an ongoing trend.
In an uptrend, a pullback occurs when the price temporarily declines before continuing the uptrend. Traders use this decline to buy at a relatively lower price. In a downtrend, a pullback occurs when the price temporarily rises before continuing the downtrend. Traders use this temporary rise to sell at a relatively higher price.
What Causes Pullbacks in the Stock Market?
There are six major reasons that cause pullbacks in the stock market. The reasons are briefly discussed below.
- Profit Booking: After a strong price move, many traders start booking profits. When buyers start booking profits, it causes the price to fall temporarily, creating a pullback. Once profit-booking slows down, the dominant trend often resumes.
- Short-term Overbought and Oversold Condition: When the market moves too quickly in one direction, it makes the market overstretched. In this situation, traders often start booking profits or hesitate to enter new positions, which reduces momentum and causes pullback. An indicator like RSI is well known for identifying such conditions.
- Break of Important Levels: After a break of important levels, such as previous support, resistance, or moving averages, price often retraces back to these levels to confirm their strength. This pause or retest creates a temporary pullback before the trend continues.
- Institutional order execution: Large institutions like mutual funds and hedge funds often enter or exit positions gradually instead of entering all at once. Their large orders temporarily create a pause or reverse price movement, creating short-term pullbacks within the overall trend.
- Market Sentiment and News: Short-term news, economic announcements, or sudden changes in sentiment can temporarily move prices against the trend. This reaction temporarily creates market pullback until the market stabilizes and the primary trend resumes.
- Liquidity and Stop-Loss Trigger: When clusters of stop-loss orders are triggered near the key level, it temporarily moves price against the trend, creating a pullback.
Pullbacks are normal in any trend and usually temporary. Understanding their causes helps traders avoid confusion between a pullback and a real trend reversal.
How to Identify a Pullback?
There are four major steps to identify a pullback. The steps are identifying the primary trend, looking for a countertrend, confirming using an indicator, and trend resumption.
- Confirm the Main Trend: First identify the market trend by marking higher highs and higher lows or using moving averages. It is important to identify the trend because a pullback only makes sense inside a trend.

- Look for a Small Opposite Move: A pullback is a small opposite move against the main trend. Wait for the price to pull back 20-62% against the trend, often to Fibonacci levels (38.2%, 50%, or 61.8%), trendlines, or moving averages like the 20/50 EMA.
- Confirm Using Indicator: During pullback, momentum indicators often show weakness; for instance, during pullback, RSI falls from the overbought zone toward 40–50 in an uptrend, indicating a temporary pause. Usually volume also decreases during the pullback, indicating a lack of selling pressure.

- Trend Resumption: The trend resumes when the price starts moving in the direction of the main trend after forming a reversal chart or candlestick pattern, often with increased volume. This shows buyers/sellers are back in control.
A pullback is identified when price retraces to key levels on low momentum and low volume, often supported by MACD showing weakening momentum, and then resumes the main trend with strength and higher volume, with MACD confirming the continuation move.
Difference between a Pullback vs. a Reversal
The difference between pullback and reversal is mentioned below in the table.
| Basis | Pullback | Reversal |
| Meaning | Temporary pause against the trend | Complete change in trend direction |
| Trend | The trend remains intact | Trend changes (uptrend → downtrend or vice versa) |
| Price Move | Small, short-term move | A strong, sustained move in opposite direction |
| Structure | Does not break major highs/lows | Breaks key structure (higher lows/lower highs) |
| Volume | Usually low during pullback | Often high during reversal |
| Indicators (RSI/MACD) | Shows temporary weakness | Shows strong shift in momentum |
| Trading Approach | Opportunity to enter the trend | Signals exit or trend change |
Understanding the difference between a pullback and a reversal helps traders avoid wrong entries and exits, allowing them to stay aligned with the trend and make better trading decisions.
How to Trade Using Pullback Strategy [With Example]
There are five major steps to trade using a pullback strategy, which are briefly discussed below with a real-time example.
- Identify the Primary Trend: Identify the primary trend of the market by using price action, higher highs and higher lows, or moving averages. Pullback trading works best in a clear uptrend or a downtrend.

- Wait for the pullback: Wait for the price to temporarily move against the primary trend. In an uptrend, price declines slightly before continuing the uptrend, while in a downtrend, price rises briefly before continuing to fall.

- Look for key levels: During pullback, price often stops near key levels such as support, resistance, trendlines, or moving averages. Watch these levels closely because the price resumes its primary trend after testing them.

- Use an indicator for confirmation: Traders often use a momentum indicator like RSI to confirm the end of a pullback. When RSI becomes temporarily oversold in an uptrend, it suggests a possible end of a pullback in the uptrend. When RSI becomes temporarily overbought in a downtrend, it suggests a possible end of a pullback in the downtrend.

- Trade execution: Enter the trade in the direction of the primary trend after the end of the pullback is confirmed by candlestick patterns and indicators. Place a stop-loss slightly below the recent swing low in an uptrend or above the swing high in a downtrend, while targets are often set near the previous high, resistance level, or 1:2 RR.

The above step-by-step process provides a basic framework for trading pullbacks. Traders can further apply these same steps using different indicators and tools like trendlines and moving averages, Fibonacci levels, and breakout zones to refine their entries and improve trade accuracy.
Trendline Pullback Strategy
In this method, traders trade pullbacks using trendlines. Traders identify the uptrend by connecting the higher lows and the downtrend by connecting the lower highs using trendlines.

After identifying a trend, using trend lines, traders enter long positions when price pulls back to a trend line support (in an uptrend) and enter short positions when price pulls back to a trend line resistance (in a downtrend). These trend lines help define clear entry zones and improve trade timing.
Moving Average Pullback Strategy
This strategy uses moving averages to identify trend direction and dynamic support and resistance. In an uptrend where price is trading above a moving average, traders look for price to pull back toward the moving average and take support before entering a buy trade.

Conversely, in a downtrend, traders look for a price to pull back towards the moving average and face resistance before entering a sell trade. The most common moving averages used include 20-period, 50-period, and 200-period.
Fibonacci Pullback Trading Strategy
Traders use Fibonacci to identify the potential area where a pullback may end and the trend will continue in its original direction. The common Fibonacci levels where pullback tends to retrace include 38.2%, 50%, and 61.8%.

After drawing the Fibonacci Retracement from swing low to swing high (in an uptrend) or swing high to swing low (in a downtrend), traders wait for the price to retrace to these levels and look for confirmation signals to enter in the direction of the trend. Using Fibonacci Retracement helps identify high-probability entry zones within the trend.
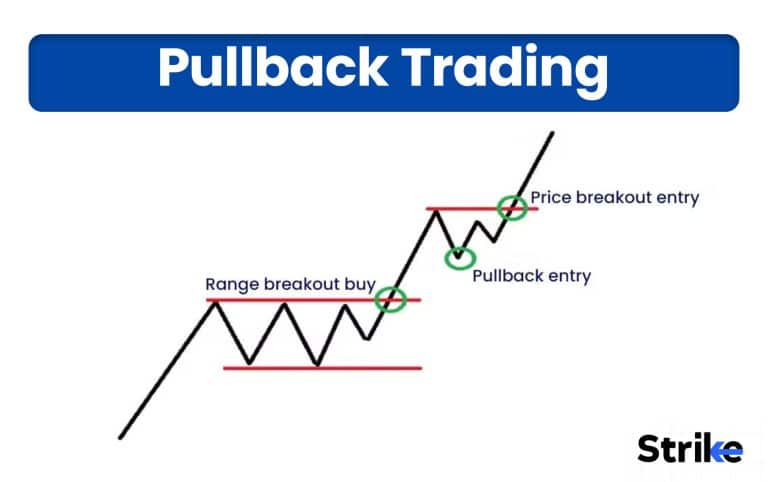
Breakout-Pullback Strategy
This strategy involves trading pullbacks after a breakout of resistance or support. Instead of entering immediately after a breakout, traders wait for the price to retrace to the level of the breakout for entry.

In breakout trading, traders enter a long position once the level holds as support after the break of resistance in an uptrend, whereas traders enter a short position once the level acts as resistance after the break of support in a downtrend. This approach to breakout trading helps traders capture momentum moves with better confirmation.
Which Timeframes Work Best for Pullbacks?
The best timeframe for pullback trading entirely depends on style of trending and holding period. However, many traders use multi-timeframe analysis to align short-term entries with long-term trends.
The suitable timeframes for trading pullbacks based on different trading styles are presented in the table below.
| Trading Style | Analysis Timeframe (Trend) | Execution Timeframe (Entry) | Typical Holding Period |
| Scalping | 15-minute or 1-hour | 1-minute or 5-minute | Seconds to minutes |
| Day Trading | 1-hour or 4-hour | 5-minute or 15-minute | Minutes to hours |
| Swing Trading | Daily or Weekly | 1-hour or 4-hour | Days to weeks |
| Positional Trading | Monthly | Weekly or Daily | Months to years |
This table shows how traders analyze the broader trend on higher timeframes and execute entries on lower timeframes, which helps improve pullback timing and trade accuracy in both intraday and swing trading strategies. Such alignment between timeframes is essential in intraday trading and effective swing trading strategies to enhance precision and consistency.
What are the Entry, Stoploss, Exit Rules for Pullback Trading
Entry, exit, and stop-loss rules are designed to focus on high-probability pullback setups within a confirmed trend, helping traders enter at optimal levels, control risk, and maximize potential returns.
- Entry Rules: Enter the trade only after the pullback shows signs of ending. This is usually confirmed by reversal candlestick patterns, chart patterns, support/resistance, and indicators (like price bouncing off the 20/50 EMA, Fibonacci 50%, or RSI bouncing from 40 to 50 in an uptrend). Use a lower timeframe, such as 15 min, for precise entry.
- Stop-loss Rules: Place your stop-loss just beyond the recent swing point. For an uptrend, place the stop loss below a recent swing low or support. For a downtrend, place the stop-loss above the recent swing high. You can also place your stop-loss based on volatility by using ATR (Average True Range). Use 1.5x or 2x the ATR away from your entry to avoid being “stopped out” by normal market noise.
- Exit Rules: Target prior swing points or key levels or use a 1:2 risk-to-reward ratio. You can also trail the target using an EMA like a 10-period or 20-period one. Exit partially once a 1:1 (50% position) target is achieved and exit fully once a trend reversal signal appears.
The key to pullback trading is entering after confirmation, protecting with a logical stop-loss, and exiting with a planned target while staying aligned with the main trend.
What are the Mistakes to Avoid While Trading Pullback?
There are four major mistakes to avoid while trading a pullback. The mistakes are entering before confirmation, confusion between reversals and pullback, trading against the trend, and trading in a sideways market.
- Entering Before Confirmation Signal: Entering a trade before a confirmation can be risky because the pullback may continue further. Wait for confirmation such as a reversal candlestick, a bounce from support, or momentum turning in the trend direction
- Confusing Reversals for Pullbacks: A pullback is the temporary price correction within a primary trend, whereas a reversal indicates a possible trend change. Misinterpreting a reversal as a pullback can lead to entering a trade in the wrong direction.
- Trading Against the Dominant Trend: Pullback trading works best when the trade is taken in the direction of the main trend. Trading against the trend increases the risk of losses.
- Trading Sideways Markets: Pullback strategies are less effective in sideways markets due to lack of clear trends. In such a condition, price keeps moving between support and resistance, making it difficult to identify the true pullback.
Avoiding these common mistakes helps traders improve accuracy, reduce losses, and trade pullbacks more effectively by staying disciplined and aligned with the trend.
What are the Best Indicators for Pullback Trading?
There are five commonly used indicators by traders to identify high-probability pullback entries within a trend. These indicators include moving average, RSI, MACD, Fibonacci, and volume, which help confirm whether the retracement is temporary or likely to continue.
Moving Averages (EMA or SMA): Moving averages help to identify the trend and act as dynamic support and resistance. In an uptrend, price trades above moving averages and pulls back towards the EMA, where it finds support before continuing higher. Conversely, in a downtrend, price trades below the moving average and pulls back towards the EMA, where it finds resistance before continuing lower.

The commonly used EMAs in pullback trading are the 20 EMA, 50 EMA, or 200 SMA depending on the timeframe.
Relative Strength Index: The Relative Strength Index (RSI) helps identify overbought and oversold conditions during a pullback. In an uptrend, when RSI drops from overbought levels (around 70) toward 40–50 and then starts rising again, it indicates a potential end of the pullback and continuation of the uptrend.

In a downtrend, when RSI rises toward 50–60 and then turns down, it signals a possible end of the pullback and continuation of the downtrend.
Moving Average Convergence Divergence (MACD): MACD helps confirm trend direction by giving bullish or bearish crossovers. During a pullback in an uptrend, traders wait for a MACD bullish crossover, which signals the potential end of the uptrend retracement.

Similarly, during a downtrend, traders wait for a MACD bearish crossover, which signals the potential end of the downtrend retracement.
Fibonacci Retracement: Fibonacci retracement helps to identify potential levels where pullback may end and the trend will continue in its original direction. The common Fibonacci levels where pullback tends to retrace include 38.2%, 50%, and 61.8%. Price often retraces up to these levels and continues its original trend.

Volume Indicator: Volume Indicator helps confirm the strength of the pullback. Typically, a genuine pullback occurs with a declining volume, while volume increases when the trend resumes. This suggests that the retracement is temporary and the main trend remains strong.

Traders often combine two or three indicators for better accuracy. For example, using EMA like the 20 EMA + RSI or combining EMA with Fibonacci levels and volume confirmation can help identify stronger pullback trading opportunities.
Is Pullback Trading Profitable for Beginners?
Yes, pullback trading is profitable for beginners, but only when it is executed with structure, patience, and proper risk control. This setup allows beginners to enter a trade at better prices instead of chasing the market, improving their risk-to-reward ratio. It also forces traders to trade in the direction of the major trend of the market, which increases their probability of winning.
Backtest results from quantifiedstrategies show that pullback trading has a win rate of 82% with an 8.3% annual return. This strategy stays in the market around 30% of the time, reducing overall risk and exposure while maintaining controlled drawdowns. This helps beginners to achieve steady, consistent gains with lower risk rather than maximizing returns.
How Long do Pullbacks Last?
The duration of a pullback varies depending on the market trend, volatility, and trading timeframe. Pullbacks can last anywhere from a few minutes during intraday trading to several weeks in longer-term trends.
The table below shows the typical duration of pullback based on trading timeframe and market context.
| Pullback Type | Typical Duration | Timeframe / Chart | Key Characteristics |
| Intraday Pullbacks | Minutes to hours | 5–15 minute charts | Quick dips that recover fast |
| Swing Pullbacks | 1–5 days | 4-hour or daily charts | Retracement to short-term support levels |
| Long-Term Pullbacks | 1–3 weeks (sometimes up to 47 days for 8–10% dips) | Daily or weekly charts | Gradual correction before trend continues |
Other factors influencing the duration of pullback include market volatility, the strength of the prevailing trend, and major news or economic events that affect investor sentiment.
What’s the Opposite of Pullback Trading?
The opposite of pullback trading is breakout trading. While pullback traders wait for price to retrace to enter at a better price, breakout traders focus on momentum and enter a trade immediately after price breaks resistance or support.
Both of these styles have their own pros and cons, which is briefly discussed below in the table.
| Pros and Cons of Pullback Trading | |
| Pros | Cons |
| Allows traders to enter at a better price within the trend | Pullbacks can sometimes turn into full reversals |
| Provides a favorable risk–reward ratio | Traders may miss strong trends if the price does not retrace |
| Helps avoid chasing overextended price moves | Requires patience and confirmation before entry |
| Pros and Cons of Breakout Trading | |
| Pros | Cons |
| Helps capture strong momentum moves early | False breakouts can lead to losses |
| Allows participation in major trend expansions | Entry price may be far from key support or resistance |
| Works well in trending and volatile markets | Requires volume or indicator confirmation |


 Previous Article


![15 Investing.com Alternatives [Free+Paid] You Should Use in 2026](https://www.strike.money/wp-content/uploads/2026/04/Investing.com-Alternatives.jpg "15 Investing.com Alternatives [Free+Paid] You Should Use in 2026 68")
![15 TradeStation Alternatives [Free+Paid] You Should Use in 2026](https://www.strike.money/wp-content/uploads/2026/04/TradeStation-Alternatives.jpg "15 TradeStation Alternatives [Free+Paid] You Should Use in 2026 69")
![15 Chartink Alternatives [Free+Paid] You Should Use in 2026](https://www.strike.money/wp-content/uploads/2026/04/Chartlink-Alternatives.jpg "15 Chartink Alternatives [Free+Paid] You Should Use in 2026 70")
: Overview, 10 Types of Indicators, Settings for Different Markets 72")

 : Definition, Formula, calculation, Uses, Advantages Vs limitations 74")


: How We Used This 70/30 Indicator in 6 High Win-rate Strategies 77")


No Comments Yet.