The Wyckoff Theory stands as one of the most significant methods to understand how markets move beneath the surface. The Wyckoff Theory helps traders to interpret the moves of institutional money through price and volume, instead of relying on indicators.
It focuses on studying how large players accumulate and distribute their positions, suggesting that every price move is intentional, not random. This method builds patience, clarity, and confidence, offering a structured way to align with the real forces driving the market.
What is the Wyckoff Theory?
The Wyckoff Theory is the technical analysis framework that helps traders and investors to understand market cycles, institutional behavior, and smart money activity. This method uses price action, volume, and supply-demand dynamics to identify the accumulation and distribution phases before the major trend.
Who Developed the Wyckoff Theory?
The Wyckoff Theory was developed by Richard Demille Wyckoff (1873–1934), a pioneering trader and instructor and among the first to develop the technical method of market analysis.
Wyckoff started his career as a stock runner on Wall Street and later became a well-known market commentator who founded “The Magazine of Wall Street.” He developed a systematic method of approaching market behavior by researching big operators such as J. P. Morgan and Jesse Livermore.
He used this study’s insight to create a cycle of price, volume, and market cycles, which are the roots of the current Wyckoff Theory.
Is the Wyckoff Theory Still Used Today?
Yes, a Wyckoff Theory is still used today by modern traders and investors. Despite being developed a century ago, its core concepts, such as price action, volume analysis, supply and demand, and understanding smart money behavior, remain highly relevant in today’s market.
Even with modern challenges like high-frequency and algorithmic trading, the underlying psychology and behavior remain the same because large players still need time to accumulate and distribute positions, creating recognizable price structures. Many modern traders use Wyckoff Theory along with tools like RSI and Fibonacci to refine their market understanding.
What are Wyckoff’s 3 Laws?
The Wyckoff Theory is built on the three foundational laws that explain how price moves in the market. These laws help in determining trend direction, stock selection, and optimal timing. The three Wyckoff laws are briefly discussed below.
Law of Supply and Demand
This law is most basic and helps in determining price direction. According to this law, price rises when demand exceeds supply and price falls when supply exceeds demand. Traders use price action and volume to identify this imbalance.
- When price increases with strong volume, it signals demand is in control (bullish).
- When price decreases with high volume, it signals supply is dominating (bearish).
When supply and demand are in equilibrium, price stays sideways.
Law of Cause and Effect
This law helps in understanding why big moves happen. According to this law, every big move happens because of earlier preparation, like accumulation or distribution.
- The Cause: It is the underlying reason that leads to a big move in the market, such as accumulation or distribution.
- The Effect: The resulting trending move that follows the cause.
The longer the cause (consolidation), the more significant the “effect” (the price move) will be.
Law of Effort vs Result
This law helps identify whether the trend is healthy or weak using volume and price. Volume shows the efforts by traders, whereas change in price shows the result of effort (volume).
- If volume and price are moving in sync, the trend is considered to be strong and expected to continue.
- If volume (effort) is high but the price movement (result) is low, it indicates institutional absorption and possible trend reversal.
If effort and result don’t match, something is wrong beneath the surface.
What are the 4 Wyckoff Phases?
According to Wyckoff, every market moves in a repeating cycle of four phases. The 4 Wyckoff phases are accumulation, markup, distribution, and markdown.

Accumulation Phase
This phase occurs after a prolonged downtrend where institutional investors quietly buy shares in bulk without driving the price and volume up significantly. During this phase, price moves sideways with increasing volume near the support level.
To accumulate bulk quantity, institutions often create false breakdowns to trap late sellers and capture final liquidity before the price turns.
Markup Phase
During the markup phase, the trend becomes visible after the institutions have accumulated enough. The price breaks out of resistance and starts forming higher highs and higher lows. Momentum builds, and public participation increases as more traders are entering the market.
Demand now dominates the supply, pushing prices higher. This is typically the most profitable phase for trend traders.
Distribution Phase
This phase occurs after a strong uptrend, where institutional investors begin to sell their holdings to the public. During this phase, price again starts moving sideways, often characterized by higher volatility and frequent fakeouts to the upside, where volume may remain high, but the price stops moving upward.
Markdown Phase
This is the final phase of the market where supply takes over demand and the market turns downward. The market breaks down from support and falls down by making lower highs and lower lows. This decline is often accelerated by panic selling by retail traders. The price keeps falling until it reaches a level attractive enough for a new accumulation phase.
What are Wyckoff Schematics?
Wyckoff schematics are visual templates or annotated diagrams of the Wyckoff Theory that explain the typical price action, volume behavior, and key events within accumulation and distribution trading ranges in the market. These schematics further divide four market phases into sub-phases, each representing a specific event.
There are two main types of Wyckoff schematics based on market intent and direction. The types are accumulation schematics and distribution schematics.
Accumulation Schematic
An accumulation schematic happens after a downtrend and shows how institutions are buying quietly before an uptrend. The key events happening in the accumulation schematic are briefly discussed below.

- Phase A: Selling climax halts the prior downtrend; an automatic rally follows.
- Phase B: Smart money absorbs supply in a range.
- Phase C: Spring tests lows.
- Phase D: sign of strength breaks resistance.
- Phase E: Markup begins.
These events end with the markup phase.
Distribution Schematic
A distribution schematic happens after an uptrend and shows how institutions are exiting quietly before a downtrend. The key events happening in the distribution schematic are briefly discussed below.

- Phase A: Buying climaxes the uptrend where the preliminary supply emerges.
- Phase B: Institutions distribute shares.
- Phase C: Upthrust tests high.
- Phase: D: The last point of supply fails.
- Phase E: Markdown ensues.
These events end with the markdown phase.
How to Read Wyckoff Patterns on Charts?
There are seven major steps to reading Wyckoff patterns on charts. The steps are briefly discussed below.
- Market context and trend identification: Before analyzing Wyckoff events, look for the trend of the market, whether it is an uptrend, downtrend, or sideways. This context helps determine whether the market is likely forming accumulation or distribution and prevents misreading key signals.
- Identify the trading range: The Wyckoff pattern forms in a trading range, where smart money is active. Spot the support and resistance where the market is moving within a range. If this trading range comes after a downtrend, consider it an accumulation phase. If the trading range comes after an uptrend, consider it as a distribution zone.
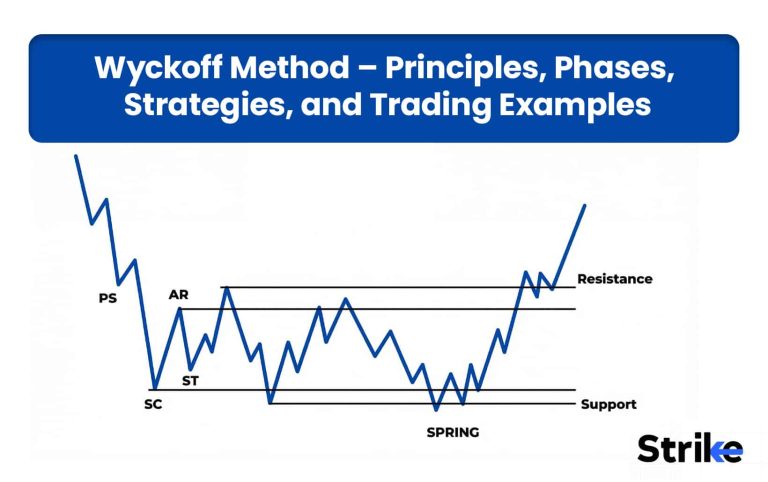
- Spot the key Wyckoff events: Spot the key Wyckoff events within the consolidation, which are mentioned below in the table.

| For Accumulation | |
| Event | What It Means |
| PS (Preliminary Support) | The first sign buyers are entering |
| SC (Selling Climax) | Panic selling, high volume |
| AR (Automatic Rally) | Sharp bounce after SC |
| ST (Secondary Test) | Retest of lows with less volume |
| Spring | Fake breakdown (liquidity grab) |
| SOS (Sign of Strength) | Strong breakout move |
| LPS (Last Point of Support) | Final pullback before trend |

| For Distribution | |
| Event | What It Means |
| PSY | Early selling pressure |
| BC (Buying Climax) | FOMO buying peak |
| AR | Drop after climax |
| ST | Weak retest of highs |
| Upthrust (UT/UTAD) | Fake breakout above resistance |
| SOW (Sign of Weakness) | The breakdown starts |
| LPSY | Weak pullback before fall |
- Confirmation using volume: Volume plays an important role in reading the Wyckoff pattern. Rising price with rising volume suggests high demand, whereas falling price with rising volume suggests strong supply. A rising price with low volume is generally considered a trap.
- Entry Logic: Take entries only after confirmation, not at the event. Enter after a spring on reclaim, after SOS on the LPS pullback, and after a UT on the breakdown retest. This improves accuracy and reduces risk.
By following these steps, traders can read Wyckoff patterns clearly across different types of charts and make more informed trading decisions. Understanding types of charts helps traders interpret these patterns with greater accuracy.
How to Trade Using Wyckoff Principles?
There are five major steps to trade using the Wyckoff principle. The steps include identifying the phase, confirming it with volume, entering on confirmation, and managing trade.
Read the phase
First, understand the position of the market in the cycle (accumulation, markup, distribution, markdown) to understand whether demand or supply is in control. Use a higher timeframe such as weekly or daily.

Confirm with volume
Check if the volume supports the move. A rising price with strong volume suggests strong demand, whereas a falling price with strong volume suggests strong supply.

Wait for entry confirmation
Avoid entering the trade immediately after identifying the phase of the market. Wait for the specific structural event, such as the spring for long trades and upthrust for short trades. These events shake out the weak hands before a major move.

Enter at the retest, not the event
After identifying the spring or upthrust, wait for the price to retest the Last Point of Support (LPS) on a long or the Last Point of Supply (LPSY) on a short. If it breaks down through the spring low, you were wrong about the phase.

Trade management
Place your stop-loss below the spring for a long trade and above the upthrust for a short trade. Use Wyckoff’s Point & Figure (P&F) method for target projection by measuring the size of accumulation or distribution ranges. The wider and longer the trading range, the bigger the subsequent move will be.
How to Differentiate Wyckoff Accumulation from Distribution?
The key difference between Wyckoff accumulation and distribution lies in context (trend before the range), the direction of the breakout, and how price, volume, and structure behave inside the trading range. The aspects that differentiate Wyckoff accumulation from distribution are mentioned below in the table.

| Aspect | Accumulation | Distribution |
| Market Context | After a downtrend | After an uptrend |
| Purpose | Smart money buying quietly | Smart money selling quietly |
| Trend Expectation | Bullish reversal (Markup) | Bearish reversal (Markdown) |
| Price Behavior | Sideways with support holding | Sideways with resistance holding |
| Volume Behavior | High volume on down moves (absorption) | High volume on up moves (selling pressure) |
| False Move | Fake breakdown (Spring) | Fake breakout (UTAD) |
| Key Event | Spring → sharp reversal up | UTAD → sharp reversal down |
| Demand vs Supply | Demand absorbing supply | Supply overpowering demand |
| Breakout Direction | Upward breakout | Downward breakdown |
| Trader Psychology | Weak hands panic-selling | Retail FOMO buying |
| Best Entry | After Spring or LPS | After UTAD or LPSY |
Recognizing accumulation vs. distribution helps you read smart money intent and avoid traps, allowing you to align early with the next major move.
What is Wyckoff Reaccumulation?
Wyckoff reaccumulation is a continuation pattern in the Wyckoff Theory that occurs during an ongoing trend and is widely used in trend trading. After a strong price rally, the market often enters a sideways consolidation phase where institutions absorb supply to increase their positions before pushing the price higher again, making it a key concept in trend trading for capturing the next leg of the uptrend.

What is the Wyckoff Composite Man?
The Wyckoff Composite Man is a foundational market theory conceptualized by Richard D. Wyckoff, which represents a hypothetical “smart money” entity controlling the market.
Richard D. Wyckoff says that traders should imagine that all the buying and selling in any market is orchestrated by a single, all-powerful professional operator, the Composite Man. This composite man is not a literal person; it is just a mental model for understanding why price and volume move the way they do.
This helps traders to study the market as if a single mind were behind every campaign for precise execution.
How Accurate is Wyckoff Analysis?
The Wyckoff Theory does not have a fixed accuracy percentage because it is based on interpretation rather than strict rules. Its real strength lies not in a high win rate but in its ability to identify major trends, false breakouts, and better risk-to-reward ratios.
A research paper on arXiv using AI models like LSTM and CNN indicates that these market structures are not random; they are repeatable patterns and can be effectively detected using data-driven models.
In fact, modern AI-based studies have demonstrated very high accuracy in identifying specific Wyckoff events, with some models achieving over 99% accuracy in detecting phases like the Secondary Test.
However, for traders, practical accuracy depends heavily on experience, correct phase identification, and market context.
Common Mistakes to When Using the Wyckoff Theory
There are five common mistakes to avoid while using the Wyckoff Theory. These five common mistakes are briefly discussed below.
- Forcing the Wyckoff Theory on every chart: Do not try to mark every consolidation as an accumulation and distribution zone, because some ranges are just normal consolidation. Before trading, check for SC-AR structure and institutional volume signatures first.
- Ignoring the overall market trend: Focusing only on a stock while ignoring the broader index or sector direction can reduce probability.
- Entering Too Early: Taking a trade in the middle of the range, such as phase B, without confirmation leads to false entries. Wait for confirmation signals like “spring,” “SOS,” or “breakdown” before entering.
- Misreading Accumulation vs Distribution: Traders often confuse accumulation with distribution, as they both appear as sideways consolidation. They both differ in context, accumulation forms after a decline (buying), while distribution forms after a rally (selling). Misreading it leads to wrong trades, so confirm with trend and volume.
- Ignoring Volume (Effort vs Result): Volume helps confirm whether the demand or supply is in control, because the price alone does not tell the full story. Always check if price movement is supported by volume.
Wyckoff is less about guessing; it is about waiting, confirming, and then acting with smart money.
Advantages and Limitations of the Wyckoff Theory
The advantages and limitations of the Wyckoff Theory are mentioned below in the table.
| Advantages | Limitations |
| Helps understand market structure and institutional activity | Subjective interpretation (different traders see different structures) |
| Identifies trends early through accumulation/distribution | Requires experience to read phases correctly |
| Reduces false breakouts using events like Spring and Upthrust | Time-consuming; requires patience |
| Works across multiple markets and timeframes | Less effective in choppy or news-driven markets |
| Offers better risk-reward through LPS/LPSY entries | No fixed buy/sell signals like indicators |
The Wyckoff Theory provides strong market insight and trading edge, but it requires experience and patience. It may not suit traders looking for quick or rule-based signals.
Books on Wyckoff Theory
The popular books written on the Wyckoff Theory from its original principles to modern-day trading applications. is mentioned below in the table.
| Book | Author | Publish Date | Summary |
| The Richard D. Wyckoff Theory of Trading in Stocks | Richard D. Wyckoff | 1937 | A complete course on Wyckoff principles, covering price action, market structure, and trading psychology. |
| Stock Market Technique | Richard D. Wyckoff | 1984 (compiled) | Collection of Wyckoff’s writings explaining market behavior, tape reading, and institutional activity. |
| Studies in Tape Reading | Richard D. Wyckoff | 1910 (original) | Focuses on interpreting price and volume to understand market intent and timing entries. |
| Trades About to Happen | David H. Weis | 2013 | A modern adaptation of Wyckoff, explaining real-time chart reading and trading decisions. |
| Wyckoff Theory Trading with Supply and Demand | Alex Rayan | 2020 | Simplified guide combining Wyckoff concepts with supply-demand trading for beginners. |
| The Wyckoff Theory Collection | Richard D. Wyckoff | 2025 (compiled edition) | Combines classic works like Studies in Tape Reading and investment strategies into one resource. |
These Stock Market Books build a strong foundation and practical edge in Wyckoff trading. The real value of Stock Market Books comes from applying these concepts consistently on charts.
Which is Better, Wyckoff or Smart Money Concept?
Neither the Wyckoff nor the smart money concept is objectively better, because they both aim to do the same thing, which is tracking institutional activity. The smart money concept itself evolved from the Wyckoff principle, rephrasing the accumulation and distribution phases as a liquidity grab and order blocks.
The core difference between Wyckoff and the smart money concept is that Wyckoff focuses on market structure, phases, and psychology. Whereas the smart money concept focuses on price patterns, liquidity, and order flow concepts.
Wyckoff Theory vs. Dow Theory vs Price Action
| Aspect | Richard Wyckoff Theory | Charles Dow Theory | Price Action |
| Core Idea | Markets move due to institutional accumulation & distribution | Markets move in trends | Price reflects everything |
| Focus | Smart money activity | Trend identification | Pure price movement |
| Key Elements | Price + Volume + Phases | Higher highs/lows, trend confirmation | Candles, S/R, structure |
| Market View | Manipulation by large players | Natural trend progression | Real-time behavior |
| Timeframe | Swing to positional | Positional / long-term | Intraday to swing |
| Entry Style | After events (Spring, LPS, breakout) | After trend confirmation | Breakouts, pullbacks, reversals |
| Signal Speed | Moderate (needs confirmation) | Slow (lagging) | Fast (leading) |
| Accuracy | High (if read correctly) | Reliable but late | Varies (depends on skill) |
| Best Use | Identifying big moves early | Defining overall trend | Precise entry & exit |
| Strength | Deep market understanding | Simplicity & reliability | Flexibility & speed |
| Limitation | Subjective, complex | Late signals | False signals in sideways markets |
| Ideal For | Advanced traders | Long-term investors | All traders (esp. intraday) |
Wyckoff shows what’s happening behind the scenes, Dow Theory gives the direction, and Price Action tells you when to act. Together, Dow Theory and Price Action complete the trading framework.


 Previous Article


![15 Investing.com Alternatives [Free+Paid] You Should Use in 2026](https://www.strike.money/wp-content/uploads/2026/04/Investing.com-Alternatives.jpg "15 Investing.com Alternatives [Free+Paid] You Should Use in 2026 48")
![15 TradeStation Alternatives [Free+Paid] You Should Use in 2026](https://www.strike.money/wp-content/uploads/2026/04/TradeStation-Alternatives.jpg "15 TradeStation Alternatives [Free+Paid] You Should Use in 2026 49")
![15 Chartink Alternatives [Free+Paid] You Should Use in 2026](https://www.strike.money/wp-content/uploads/2026/04/Chartlink-Alternatives.jpg "15 Chartink Alternatives [Free+Paid] You Should Use in 2026 50")
: Overview, 10 Types of Indicators, Settings for Different Markets 52")

 : Definition, Formula, calculation, Uses, Advantages Vs limitations 54")


: How We Used This 70/30 Indicator in 6 High Win-rate Strategies 57")


No Comments Yet.