Trading indicators are very crucial in technical analysis because they help turn complex market data into simple insights. Trading indicators are typically used by all types of traders to make informed decisions, especially when the market feels uncertain. Trading Indicators highlight trends and gauge how strong a price movement is. By offering clear signals based on rules, trading indicators help minimize emotional biases like fear and greed, allowing traders to stay more disciplined and consistent in their approach.
The Best Technical Trading Indicators Summary
Below is the quick summary table of the best trading indicators.
| Category | Indicators | Best For |
| Trend Indicators | MA, EMA, Super Trend, Ichimoku Cloud, ADX, Aroon, Parabolic SAR, Elliott Wave | Identifying trend direction, strength, reversals, stop-loss, and market cycles |
| Momentum Indicators | RSI, MACD, Stochastic Oscillator, CCI, TRIX, RMI | Measuring momentum, spotting overbought/oversold zones, and timing entries/exits |
| Volatility Indicators | Bollinger Bands, ATR, Standard Deviation, Donchian Channel | Measuring volatility, identifying breakouts, and setting dynamic stop-loss levels |
| Volume Indicators | OBV, Accumulation/Distribution, MFI, VWAP, EOM | Confirming trend strength, tracking buying/selling pressure, and analyzing volume flow |
| Support & Resistance Indicators | Fibonacci Retracement, Pivot Points | Identifying key support/resistance levels and intraday price zones |
What is a Trading Indicator?
A trading indicator is a mathematical calculation derived from price, volume, or open interest data of a security that helps traders identify trends, momentum, reversals, and volatility. Trading indicators transform the raw market data into visual signals like lines, histograms, or oscillators on a chart for better decision-making.
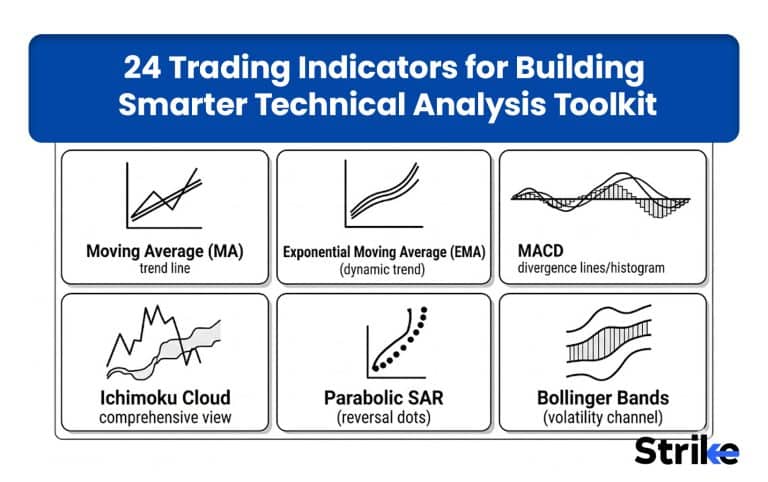
1. Moving Average (MA)
A moving average is a trend-following trading indicator that calculates the average price of the security over the period. This average price smooths out the price movement and eliminates the market noise, helping traders to identify the overall trend of the market.
Moving average is one of the oldest trading indicators, dating back to the early 20th century. With the rise of computers in the 1970s-80s, they became widely used, and advanced forms like EMA gained popularity.
The moving averages are calculated using the formula given below.
Where:
- P = Price (usually closing price)
- n = Number of periods
This trading indicator gets plotted as a single line on a price chart

- Price trading above a rising moving average indicates an uptrend
- Price trading below falling moving average, indicates a downtrend
- Price trading near flat moving average, indicates sideways market
| Moving Averages Trading Indicator Summary | |
| Primary Function | Smooths price data to identify trend direction. |
| Ideal For | Trending markets. |
| Best Timeframe to Use | 15 min to daily. |
| Type of Signal | Trend direction and crossovers. |
| Reliability | Moderate; improves with multiple MAs. |
| Leading/Lagging | Lagging. |
| Entry Point | Price crossing MA or MA crossover. |
| Price Target | Next support/resistance or trend continuation. |
| Stop Loss | Below/above MA or recent swing. |
2. Exponential Moving Average (EMA)
An exponential moving average is a type of moving average that gives more weight to recent prices, which makes it more responsive to a current market movement. The EMA trading indicator has evolved from the simple moving average during the mid-20th century and got popularized in the 1980s–1990s with the rise of computerized trading.
The exponential moving averages are using the formula given below.
The moving average gets plotted as a single line on the price chart, acting as support and resistance.

- Price trading above a rising exponential moving average indicates an uptrend
- Price trading below falling exponential moving average, indicates a downtrend
- Price trading near flat exponential moving average, indicates sideways market
| Exponential Moving Averages Indicator Summary | |
| Primary Function | Tracks trend with faster response to price |
| Ideal For | Fast-moving trending markets |
| Best Timeframe to Use | 5-min to Daily |
| Type of Signal | Pullbacks, crossovers, trend continuation |
| Reliability | High in trending markets |
| Leading/Lagging | Lagging (faster than SMA) |
| Entry Point | Pullback to EMA (20/50) |
| Price Target | Trend continuation zones |
| Stop Loss | Below EMA or recent swing |
3. Relative Strength Index (RSI)
RSI (Relative Strength Index) is a momentum oscillator that measures the magnitude and speed of the stock. This trading indicator helps traders to identify reversals, overbought/oversold conditions, and momentum strength. RSI was developed and introduced by J. Welles Wilder Jr. in 1978 in his book New Concepts in Technical Trading Systems.
The formula to calculate RSI is given below.
Where,
RS = relative strength
RSI gets plotted as a single line below the price chart and oscillates between 0 and 100.

- RSI value above 70 indicates a overbought zone
- RSI value below 30 indicates a oversold zone
- RSI oscillating between 30 and 70 generally indicates a sideways market.
| Relative Strength Index Indicator Summary | |
| Primary Function | Measures momentum and overbought/oversold levels |
| Ideal For | Trending and range markets |
| Best Timeframe to Use | 5-min to Daily |
| Type of Signal | Divergence, reversals, momentum shifts |
| Reliability | High with confirmation |
| Leading/Lagging | Leading |
| Entry Point | RSI reversal from 30/70 or 40–60 zone |
| Price Target | Previous highs/lows |
| Stop Loss | Beyond recent swing |
4. Moving Average Convergence Divergence (MACD)
MACD (Moving Average Convergence Divergence) is a momentum and trend-following trading indicator that helps in identifying trend direction, momentum shift, and entry/exit points by measuring the relationship between two exponential moving averages (12 EMA and 26 EMA) of the security.
The MACD indicator was developed by Gerald Appel in the late 1970s and gained widespread popularity due to the rise of computerized charting tools in the 1980s–1990s.
The MACD consists of three main components, mainly the MACD line, the signal line, and the histogram. The definition and formula for each component are mentioned below.
- MACD line: It is the main line of the indicator, which is plotted by subtracting the 26-period EMA from the 12-period EMA (12 EMA – 26 EMA).
- Signal Line: It is a 9-period EMA of a MACD line that acts as a trigger for buy and sell signals (9-period EMA of the MACD line).
- Histogram: It plots the convergence and divergence between the MACD line and signal line as bars above and below the zero line (MACD−Signal Line)

The MACD line crossing above the signal gives a bullish signal, while the MACD line crossing below the signal gives a bearish signal.
| Moving Average Convergence and Divergence (MACD) Indicator Summary | |
| Primary Function | Combines trend and momentum |
| Ideal For | Trending markets |
| Best Timeframe to Use | 15-min to Daily |
| Type of Signal | Crossovers, divergence, momentum shifts |
| Reliability | High in trends |
| Leading/Lagging | Lagging |
| Entry Point | MACD crossover with trend |
| Price Target | Trend continuation |
| Stop Loss | Recent swing level |
5. Bollinger Bands
The Bollinger Band is a volatility-based trading indicator that measures the market volatility using the +2 and -2 standard deviations of the 20-period moving average. It dynamically expands and contracts based on market volatility.
The Bollinger Band was developed and named by John Bollinger in the 1980s. Bollinger Band indicator gained popularity as traders needed a dynamic way to measure volatility instead of using fixed percentage bands.

The Bollinger Band consists of three main components, which are briefly discussed below.
- The upper band: +2 standard deviations of the 20-period moving average.
- The middle band: The 20-period moving average
- The lower band: -2 standard deviations of the 20-period moving average.
When price movements are small, volatility is low, and bands contract due to low volatility. When price movements are big, volatility increases, bands expand due to high volatility
The formula to calculate Bollinger Bands is given below.
Where:
- SMAₙ = Simple Moving Average (usually 20-period)
- σ = Standard deviation of price
- k = Multiplier (commonly 2)
Statistically, the price stays within the bands 95% of the time under normal distribution.
| Bollinger Bands Indicator Summary | |
| Primary Function | Measures volatility and identifies relative highs/lows |
| Ideal For | Volatile and range-bound markets |
| Best Timeframe to Use | 5-min to Daily |
| Type of Signal | Breakouts, reversions, squeezes |
| Reliability | High with confirmation |
| Leading/Lagging | Both |
| Entry Point | Reversal at bands or breakout |
| Price Target | Opposite band |
| Stop Loss | Outside band or candle |
6. On-Balance Volume (OBV)
On-Balance Volume (OBV) is volume-based trading indicator that measures the buying and selling pressure in a stock by adding cumulative volume on positive days and subtracting on negative days. This helps traders to confirm market trends and to spot divergence.
The OBV indicator was developed and introduced by Joseph Granville in the 1960s in his book Granville’s New Key to Stock Market Profits. This became one of the earliest indicators to focus on volume in predicting price movement.

The formula to calculate On-Balance Volume (OBV) is mentioned below.
Where:
- Vt = Volume of current period
- Pt = Current closing price
- Pt−1 = Previous closing price
OBV is plotted as a single continuous line that rises or falls based on volume flow.
- OBV moving along with price indicates a trending move.
- OBV moving opposite to price indicates divergence and a possible trend reversal.
| On-Balance Volume (OBV) Indicator Summary | |
| Primary Function | Tracks volume flow to confirm the trend. |
| Ideal For | All market conditions |
| Best Timeframe to Use | 15-min to Daily |
| Type of Signal | Divergence, trend confirmation |
| Reliability | High with price action |
| Leading/Lagging | Leading |
| Entry Point | OBV breakout/divergence |
| Price Target | Trend continuation |
| Stop Loss | Price structure based |
7. Average True Range (ATR)
Average True Range (ATR) is a volatility-based trading indicator that measures the average range of price moves over a specific period of time, typically 14 days. ATR does not tell the market direction but tells how much the market will move, helping traders to place stop-loss orders, size positions, and understand volatility contraction and expansion.
Average True Range (ATR) was developed by J. Welles Wilder Jr. and introduced in 1978 in his book New Concepts in Technical Trading Systems. This trading indicator was initially built for the commodity market.

The formula to calculate ATR is mentioned below.
Where:
- H = Current high
- L = Current low
- Cprev = Previous close
- n = Number of periods (commonly 14)
ATR is plotted as a single line below the price chart and focuses purely on volatility.
- Rising ATR indicates rising volatility
- Falling ATR indicates volatility
ATR does not show a bullish or bearish trend; it only indicates the strength of the price move.
| Average True Range (ATR) Indicator Summary | |
| Primary Function | Measures volatility |
| Ideal For | All markets |
| Best Timeframe to Use | Any timeframe |
| Type of Signal | Volatility expansion/contraction |
| Reliability | High for risk management |
| Leading/Lagging | Lagging |
| Entry Point | Not used directly |
| Price Target | Not applicable |
| Stop Loss | ATR-based SL (1.5x–2x ATR) |
8. Stochastic Oscillator
A stochastic oscillator is a momentum trading indicator that compares the closing price of a security with its recent price range to identify overbought and oversold zones, indicating a possible trend reversal.

The stochastic oscillator was developed by George Lane in the 1950s based on the idea that momentum changes before price. The Stochastic Oscillator consists of two lines (%K and %D) plotted between 0 and 100.
The formula to calculate the %K and %D lines is mentioned below.
Where:
- C = Current closing price
- Hn = Highest high over nnn periods
- Ln = Lowest low over nnn periods
- Standard setting = 14, 3, 3
- An oscillator below 20 and above 80 indicates oversold and overbought conditions.
- %K crossing above %D suggests a buy signal, while %K crossing below %D suggests a sell signal.
Traders also trade divergence using a stochastic oscillator.
| Stochastic Oscillator Indicator Summary | |
| Primary Function | Measures momentum within range |
| Ideal For | Range-bound markets |
| Best Timeframe to Use | 5-min to 1-hour |
| Type of Signal | Overbought/oversold, crossover |
| Reliability | Moderate |
| Leading/Lagging | Leading |
| Entry Point | 20/80 reversal |
| Price Target | Range highs/lows |
| Stop Loss | Beyond swing |
9. Fibonacci Retracement
Fibonacci retracement is a technical analysis tool that helps traders and investors to find potential support and resistance levels in a trending market. This trading indicator is based on the famous Fibonacci sequenceintroduced by Leonardo of Pisa in the 13th century. Later, this sequence was applied to financial markets.

The formula to calculate Fibonacci retracement levels is given below
Fibonacci retracement is drawn between a significant high and low, and horizontal levels are plotted based on Fibonacci ratios.
- 23.6% suggests shallow pullback
- 38.2% suggests healthy retracement
- 50% suggests psychological level
- 61.8% suggests golden ratio (strong support/resistance)
- 78.6% suggest deep retracement
Price pullbacks to these zones in an uptrend give potential buying opportunities, while retracing to these levels during a downtrend gives potential selling opportunities.
| Fibonacci Retracement Indicator Summary | |
| Primary Function | Identifies retracement levels |
| Ideal For | Trending markets |
| Best Timeframe to Use | 15-min to Daily |
| Type of Signal | Pullbacks, reversal zones |
| Reliability | High with confluence |
| Leading/Lagging | Leading |
| Entry Point | 38.2–61.8% zone |
| Price Target | Previous swing high/low |
| Stop Loss | Below 61.8% or swing |
10. Parabolic SAR
Parabolic SAR (Stop and Reverse) is a trend-following trading indicator that identities the trend direction and a potential reversal point. This trading indicator was developed by J. Welles Wilder Jr. in 1978, designed to capture trending market moves.

The parabolic SAR is calculated based on an extreme point (EP) and an acceleration factor (AF)
Where:
- SAR = Current stop and reverse value
- EP = Extreme Price (highest high in uptrend / lowest low in downtrend)
- AF = Acceleration Factor (starts at 0.02 and increases up to 0.2)
Parabolic SAR gets plotted on a price chart as a series of dots above and below the price.
- Price trading above the dots indicates an uptrend.
- Price trading below the dots indicates a downtrend.
- When price crosses the dots, it indicates trend reversal
| Parabolic SAR Indicator Summary | |
| Primary Function | Identifies trends and reversals |
| Ideal For | Strong trends |
| Best Timeframe to Use | 15-min to Daily |
| Type of Signal | Trend reversal, trailing SL |
| Reliability | Low in sideways markets |
| Leading/Lagging | Lagging |
| Entry Point | Dot flip |
| Price Target | Trend continuation |
| Stop Loss | SAR level |
11. Volume Weighted Average Price (VWAP)
VWAP (Volume Weighted Average Price) is an intraday trading indicator that calculates the average price of the security weighted by its trading volume. Unlike moving averages, this trading indicator shows the average price where most traders are buying and selling. VWAP indicator helps traders in trend identification, finding support and resistance, and entry zones.

VWAP emerged with rising algorithmic execution in the late 20th century. It gets plotted as a single line on the intraday chart, which is calculated by using the formula mentioned below.
- Price trading above VWAP indicates bullish sentiment
- Price trading below VWAP indicates bearish sentiment
It also acts as support and resistance just like moving averages.
| Volume-Weighted Average Price (VWAP) Indicator Summary | |
| Primary Function | Identifies fair value price |
| Ideal For | Intraday trading |
| Best Timeframe to Use | Intraday |
| Type of Signal | Mean reversion, trend bias |
| Reliability | High intraday |
| Leading/Lagging | Lagging |
| Entry Point | Pullback to VWAP |
| Price Target | Previous high/low |
| Stop Loss | Below/above VWAP |
12. Super Trend
SuperTrend is a trend-following trading indicator that helps to identify market trends and generates clear buy and sell signals. This trading indicator gets plotted as a line on the price chart and dynamically adjusts based on price volatility.

The Super Trend indicator was developed by Olivier Seban and gained popularity in modern trading due to its simplicity and effectiveness in finding market trends. It gets plotted on a chart as a single line that changes color based on trend.
The formula to calculate the Supertrend is mentioned below.
Where:
- H = High
- L = Low
- ATR = Average True Range
- Multiplier = Commonly 2 or 3
This trading indicator gets plotted on a chart as a single line on the price chart, changing position based on trend.
- Price trading above the green supertrend line indicates an uptrend.
- Price trading below the red supertrend line indicates a downtrend.
- When SuperTrend flips from red to green, it generates a buy signal.
- When SuperTrend flips from green to red, it generates a sell signal.
| Supertrend Indicator Summary | |
| Primary Function | Identifies trend using ATR |
| Ideal For | Trending markets |
| Best Timeframe to Use | 5-min to Daily |
| Type of Signal | Trend reversal, continuation |
| Reliability | High in trends |
| Leading/Lagging | Lagging |
| Entry Point | Break of Supertrend |
| Price Target | Trend continuation |
| Stop Loss | Supertrend line |
13. Accumulation/Distribution Line
The accumulation/distribution line is acumulative volume-based trading indicator that measures the inflow (accumulation) and outflow (distribution) of money in the market by combining price and volume.

The accumulation/distribution line was developed by Marc Chaikin in the early 1980s. This trading indicator was designed to improve on a simple volume indicator by combining the position of the closing price within the candle range.
The formula to calculate the accumulation/distribution line is mentioned below.
Where:
- C = Closing price
- H = High price
- L = Low price
- Volume = Total traded volume
It gets plotted below the price chart as a continuous cumulative line based on buying and selling pressure.
- When A/D line moves with the price, it indicates strong directional trend
- When the A/D line moves opposite to the price move, it suggests possible accumulation or distribution.
| Accumulation/Distribution Line (AD Line) Indicator Summary | |
| Primary Function | Tracks money flow |
| Ideal For | Trend confirmation |
| Best Timeframe to Use | 15-min to Daily |
| Type of Signal | Divergence, accumulation |
| Reliability | High |
| Leading/Lagging | Leading |
| Entry Point | Divergence confirmation |
| Price Target | Trend continuation |
| Stop Loss | Structure-based |
14. Ichimoku Cloud
The Ichimoku cloud is a comprehensive Japanese trading indicator that provides a complete view of trend, momentum, support/resistance, and potential future direction in a single chart. This trading indicator consists of multiple lines and a cloud that helps traders quickly understand the trend of the market.

Ichimoku Cloud was developed by Goichi Hosoda in the 1930s, but it was officially published in 1969 after decades of testing. It became widely used in Japanese markets and later gained global popularity.
The Ichimoku Cloud consists of five major components, which are briefly mentioned below.
- Tenkan-sen (Conversion Line): A fast-moving line showing short-term direction.
- Kijun-sen (Base Line): A slower line acting as support / resistance and trend base.
- Senkou Span A & B (Lagging Span A and B): They are plotted 26 periods ahead, acting as support and resistance.
- Kumo (Cloud): The area between spans A and B. A price above the cloud indicates a bullish market, and below the cloud indicates a bearish market.
- Chikou Span (Lagging Lines): Confirms trend strength based on past price.
The formula to calculate these components of the Ichimoku cloud is mentioned below.
| Ichimoku Cloud Indicator Summary | |
| Primary Function | Complete trend system |
| Ideal For | Trending markets |
| Best Timeframe to Use | 15-min to Daily |
| Type of Signal | Cloud breakout, crossover |
| Reliability | High |
| Leading/Lagging | Both |
| Entry Point | Above cloud breakout |
| Price Target | Trend continuation |
| Stop Loss | Below cloud |
15. Average Directional Index (ADX)
The Average Directional Index (ADX) indicator is a trend strength trading indicator that measures the strength of the trend regardless of its direction. This trading indicator helps traders to filter out strong trends from the choppy or sideways market.

ADX was developed by J. Welles Wilder Jr. in 1978 as part of the Directional Movement System, introduced in his book New Concepts in Technical Trading Systems.
ADX is made up of three main lines: the ADX line, +DI, and -DI.
- ADX Line (Main Line): It measures the strength of the trend. An ADX line below 20 suggests a weak or sideways trend, whereas an ADX line above 20 suggests a strong trend.
- +DI (Positive Directional Indicator): It measures bullish strength. If the +DI line is above the -DI line, it suggests bulls are in control.
- -DI (Negative Directional Indicator): It measures bearish strength. If the -DI line is above the +DI line, it suggests bulls are in control.
Rising +DI with rising ADX above 20 suggests a strong bullish trend, whereas rising -DI with rising ADX above 20 suggests a strong bearish trend.
The formula to calculate each line is mentioned below.
| Average Directional Index (ADX) Indicator Summary | |
| Primary Function | Measures trend strength |
| Ideal For | Trending markets |
| Best Timeframe to Use | 15-min to Daily |
| Type of Signal | Trend strength confirmation |
| Reliability | High |
| Leading/Lagging | Lagging |
| Entry Point | ADX above 25 |
| Price Target | Trend continuation |
| Stop Loss | Structure-based |
16. Aroon Indicator
The Aroon indicator is a trend identification trading indicator that measures how recently a stock has made a high or low to determine the trend of the market. This trading indicator helps traders to identify the strength or a potential start of the trend.

The Aroon indicator was developed by Tushar Chande in the mid-1990s and given the name “Aroon” from the Sanskrit language. The word “Aroon” means “dawn’s early light,” symbolizing the ability of an indicator to detect the beginning of a new trend.
The Aroon trading indicator has two main lines, which are Aroon Up (Bullish Strength) and Aroon Down (Bearish Strength).
- Aroon Up (Bullish Strength): Measures how recently the highs have occurred.
- Aroon Down (Bearish Strength): Measures how recently the lows have occurred.
Aroon Up near 100 and Aroon Down near zero suggest an uptrend, whereas Aroon Down near 100 and Aroon Up near zero suggest a downtrend.
The formula to calculate the Aroon indicator is mentioned below.
Where:
- n = Number of periods (commonly 14 or 25)
The formula to calculate Aroon Up and Aroon Down is mentioned below.
| Aroon Indicator Summary | |
| Primary Function | Identifies new trends |
| Ideal For | Early trend detection |
| Best Timeframe to Use | 15-min to Daily |
| Type of Signal | Crossovers |
| Reliability | Moderate |
| Leading/Lagging | Leading |
| Entry Point | Aroon crossover |
| Price Target | Trend continuation |
| Stop Loss | Swing-based |
17. Commodity Channel Index (CCI)
The Commodity Channel Index (CCI) is a momentum-based trading indicator that measures how far price is trading from its statistical average level. This trading indicator helps traders to identify overbought and oversold conditions and potential trend reversals or continuations.

The Commodity Channel Index (CCI) was developed by Donald Lambert in the early 1980s for commodity markets but later became widely used across stocks, indices, and forex.
The formula to calculate Commodity Channel Index (CCI) is given below.
Where:
- H = High
- L = Low
- C = Close
- SMA(TP) = Moving average of Typical Price
- Mean Deviation = Average deviation from SMA
- 0.015 = Constant used to normalize values
- Standard period = 14 or 20
CCI is plotted as a single line oscillating around zero, with +100 and -100 marking important ranges.
- CCI above +100 indicates overbought
- CCI below -100 indicates oversold
If CII stays above or below +100 or -100, it suggests a strong trend.
| Commodity Channel Indicator Summary | |
| Primary Function | Measures price deviation |
| Ideal For | Trending & range markets |
| Best Timeframe to Use | 5-min to Daily |
| Type of Signal | Overbought/oversold |
| Reliability | Moderate |
| Leading/Lagging | Leading |
| Entry Point | ±100 breakout |
| Price Target | Trend continuation |
| Stop Loss | Swing-based |
18. Money Flow Index (MFI)
The Money Flow Index (MFI), also known as “volume-weighted RSI,” is a volume-based momentum trading indicator that combines both price and volume to measure buying and selling pressure. This trading indicator tells traders overbought and oversold conditions with volume confirmation. MFI was developed by Gene Quong and Avrum Soudack in the late 1980s.

The MFI is calculated based on the formula given below.
Where:
- HHH = High
- LLL = Low
- CCC = Close
- Standard period = 14
Just like RSI, the Money Flow Index (MFI) also oscillates between 0 and 100, indicating overbought and oversold zones.
- A value above 80 suggests overbought conditions, indicating possible fall
- A value below 20 suggests oversold condition, indicating possible bounce
- Between 20 and 80 suggests normal zone
| Money Flow Index (MFI) Indicator Summary | |
| Primary Function | Measures buying and selling pressure using price and volume |
| Ideal For | Identifying overbought/oversold and volume-backed reversals |
| Best Timeframe to Use | 5-min to Daily |
| Type of Signal | Reversal & momentum shift |
| Reliability | Moderate to High (with confirmation) |
| Leading/Lagging | Leading |
| Entry Point | Buy near oversold (below 20) and sell near overbought (above 80) with confirmation |
| Price Target | Previous swing high/low or key support/resistance level |
| Stop Loss | Below recent low (buy) or above recent high (sell) |
19. Pivot Points
Pivot points are price-based levels calculated based on the previous day’s high, low, and close points. This level acts as potential support and resistance for the current trading session. Pivot point” has been in use since the 20th-century floor trading era on exchanges.

The pivot point consists of one central pivot line, multiple resistance lines above the pivot line, and multiple support lines below the pivot line.
- Pivot Line: It helps identify the bias of the market. Market trading above a pivot indicates an uptrend, while price trading below a pivot indicates a downtrend.
- Support Line: Acts as a potential buying zone. If a support pivot breaks, it indicates a further fall up to the next support pivot.
- Resistance Line: Acts as a potential selling zone. If a resistance pivot breaks, it indicates a further rise in price up to the next resistance pivot.
| Pivot Points Trading Indicator Summary | |
| Primary Function | Identifies support & resistance levels |
| Ideal For | Intraday & range-bound markets |
| Best Timeframe to Use | 5-min to Daily |
| Type of Signal | Reversal & breakout |
| Reliability | Moderate to High (with confirmation) |
| Leading/Lagging | Leading |
| Entry Point | Bounce from S/R or breakout above/below levels |
| Price Target | Next Pivot level (R1 → R2, S1 → S2) |
| Stop Loss | Below/above nearest Pivot level |
20. Donchian Channel
The Donchian Channel is a volatility-based scanner that marks the highest high and the lowest low of the price over a specific period to form a price channel. This trading indicator helps traders to find breakout, trend direction, and potential entry/exit points.

The Donchian Channel indicator was developed by Richard Donchian in the mid-20th century. This indicator later became the foundation for the famous turtle trading strategy.
The Donchian Channel consists of three main lines, which are briefly discussed below.
- Upper Band (Resistance): Highest high over the n periods. Price breaking above the upper band indicates a bullish breakout.
- Lower Band (Support): Lowest low over the last n periods. Price breaking below the lower band indicates a bearish breakout.
- Middle Band: Average of upper and middle bands. It helps in taking pullback entries.
The formula to calculate the Donchian Channel is mentioned below.
Where:
- n = Number of periods (commonly 20)
| Donchian Channel Indicator Summary | |
| Primary Function | Identifies breakout levels |
| Ideal For | Trending markets |
| Best Timeframe to Use | 15-min to Daily |
| Type of Signal | Breakouts |
| Reliability | High |
| Leading/Lagging | Lagging |
| Entry Point | Channel breakout |
| Price Target | Trend continuation |
| Stop Loss | Opposite band |
21. TRIX
TRIX (Triple Exponential Average) is a momentum oscillator that measures the rate of change of the triple-smoothed exponential moving average. Trading indicator helps traders to identify market trends and reversals by filtering out market noise. TRIX was developed by Jack Hutson in the 1980s to reduce false signals by applying a multilayer of smoothing.

The formula to calculate TRIX (Triple Exponential Average) is mentioned below.
Where:
- P = Price (usually closing price)
- EMA³ = Triple smoothed EMA
- TRIX measures the percentage change of EMA³
- Standard period = 14 or 15
TRIX is plotted as a single oscillating line around zero with a signal line (EMA of TRIX).
- TRIX crossing below the zero line suggests a sell signal, whereas crossing above suggests a buy signal.
- TRIX above the zero line suggests bullish momentum, whereas below zero suggests bearish momentum.
You can also trade divergence using TRIX indicator
| TRIX Indicator Summary | |
| Primary Function | Measures smoothed momentum |
| Ideal For | Trending markets |
| Best Timeframe to Use | 15-min to Daily |
| Type of Signal | Crossovers, divergence |
| Reliability | High |
| Leading/Lagging | Lagging |
| Entry Point | Signal crossover |
| Price Target | Trend continuation |
| Stop Loss | Swing-based |
22. Ease of Movement (EOM)
Ease of Movement is a volume-based oscillator that measures how easily a price moves relative to its volume. This trading indicator helps traders to identify whether the price is moving smoothly with low resistance or difficulty with high volume pressure.

Ease of Movement (EOM) was developed by Richard W. Arms Jr. in the 1970s and mainly focused on the relation between price movement and volume. The formula to calculate EOM is mentioned below.
EOM gets plotted as a single around a zero level, suggesting ease of price movement.
- A rising EOM line above the zero line indicates smooth upward momentum with low resistance.
- A falling EOM line below the zero line indicates smooth downward momentum with minimum support.
Traders also use EMO to identify divergence. Rising prices with falling or stable EOM indicates weak momentum, while falling prices with rising EOM indicate a weak fall.
| Ease of Momentum (EOM) Indicator Summary | |
| Primary Function | Measures ease of price movement |
| Ideal For | Volume analysis |
| Best Timeframe to Use | 15-min to Daily |
| Type of Signal | Divergence |
| Reliability | Moderate |
| Leading/Lagging | Leading |
| Entry Point | Zero line crossover |
| Price Target | Trend continuation |
| Stop Loss | Structure-based |
23. Elliott Wave
The Elliott wave is a technical concept based on price action that explains market movements as a repeated wave pattern driven by the natural cycle of investors’ psychology. This trading indicator helps traders to identify market direction, market cycles, and potential reversals.

The concept of Elliott Wave was developed by Ralph Nelson Elliott in the 1930s when he observed that the market moves in a repeated form of wave pattern influenced by human emotions like fear and greed.
He divided the market wave into two waves, the impulsive wave and a corrective wave.
- Impulsive Wave: This is the trending phase of the market marked by numbers 0, 1, 2, 3, 4, and 5.
- Corrective Wave: This is the corrective phase after the trending phase marked by alphabet A, B, and C.
These 5 impulsive waves and 3 corrective waves forms a one market cycle
| Elliott Wave Summary | |
| Primary Function | Identifies market cycles & trend structure |
| Ideal For | Trending markets |
| Best Timeframe to Use | 15-min to Weekly |
| Type of Signal | Trend continuation & reversal |
| Reliability | Moderate (depends on correct wave count) |
| Leading/Lagging | Leading |
| Entry Point | Start of Wave 3 or Wave C completion |
| Price Target | Wave 3 or Wave 5 projections (Fibonacci-based) |
| Stop Loss | Below Wave 2 (for buy) / Above Wave B (for sell) |
24. Rohit Momentum Indicator (RMI)
The Rohit Momentum Indicator (RMI) is a custom momentum trading indicator developed by Rohit Srivastava, designed to capture momentum shifts in the market without any noise. This indicator helps traders capture momentum by giving buy and sell signals.

The RMI consists of two main components, the RMI line and a signal line (9-period average of the RMI line).
- When the RMI line crosses above the signal line, it generates a bullish crossover, signaling bullish momentum.
- When the RMI line crosses below the RMI signaling, it generates a bearish crossover, signaling bearish momentum.
A bullish crossover is more reliable when it occurs below the zero line, whereas a bearish crossover is more reliable when it occurs above the zero line.
| Rohit Momentum Indicator (RMI) Indicator Summary | |
| Primary Function | Measures momentum with smoothing |
| Ideal For | Trend continuation |
| Best Timeframe to Use | 15-min to Daily |
| Type of Signal | Momentum shifts |
| Reliability | High |
| Leading/Lagging | Lagging |
| Entry Point | Crossover |
| Price Target | Trend continuation |
| Stop Loss | Crossover or Swing-based |
What is the Purpose of a Trading Indicator?
A purpose of a trading indicator is to translate the raw market data, such as price, volume, and time, into structured and visual forms to make more objective trading decisions. The six core purposes of trading indicators are briefly discussed below.
- Clarify trend and structure: Indicators like moving average, MACD, and SuperTrend highlight the market direction by smoothing price data. This helps traders to decide whether to trade with or against the prevailing trend.
- Measure the Momentum: Momentum indicators such as RSI or a stochastic measure the strength and reversals of the stocks.
- Time entry and exit: Indicators like RMI, Supertrend, and EMA cross help traders to identify entry and exit points by giving buy and sell signals.
- Quantify volatility and risk: Measure volatility with Bollinger Bands and ATR to place stops and targets.
- Remove Emotional Bias: Indicators bring discipline and consistency in trading by giving rule-based signals. It helps overcome panic buying, fear selling, and overtrading.
The purpose of a trading indicator is to help traders make clear, objective, and disciplined decisions in the market.
Are Trading Indicators Reliable?
Yes, trading indicators are reliable, but only when used with the right market context. As trading indicators derive their value from price and volume data of underlying securities, their reliability depends on how well they are matched with the current market conditions.
Trend-following indicators like moving averages or MACD are more reliable in trending markets, whereas oscillators such as RSI or stochastics are more reliable in sideways markets. Even though using indicators with the right market context, no indicators are 100% accurate.
The true strength of indicators comes when they are combined with price, volume, and risk management tools.
Do Indicators Work in All Market Conditions?
No, trading indicators do not work in all market conditions, because every indicator is mathematically designed for specific price behaviors; therefore, their effectiveness depends on the type of market.
Indicators like moving averages, Supertrend, or MACD work well in trending markets, identifying direction and capturing trends but fail in sideways or choppy markets. On the other hand, oscillators like RSI and Stochastic work better in sideways markets.
What are the Best Trading Indicators for Beginners?
The best indicators for beginners are those that are simple, reliable, and understandable in spotting trends, momentum, and entry and exit points. Moving Averages (MA), RSI, MACD, Volume, and Supertrend are some of the beginner-friendly indicators. These tools help build confidence without overwhelming new users.
Which Indicator is Best for Swing Trading?
Trading Indicators that capture medium-term momentum, trend strength, and key turning points, not tick-by-tick noise, are considered to be the best indicators for swing trading. These indicators are mentioned below in the table.
| Indicator | Category | Primary Use |
| RSI | Momentum | Identify pullbacks & reversal zones |
| MACD | Momentum | Confirm trend strength & crossovers |
| Fibonacci Retracement | Support/Resistance | Find precise entry levels in pullbacks |
Use RSI for timing, MACD for confirmation, and Fibonacci for entry zones to complete the swing trading framework.
Which Indicator is Best for Intraday Trading?
Indicators that give fast and reliable signals with minimum lag are considered to be the best indicators for intraday trading. These indicators are mentioned below in the table.
| Indicator | Category | Primary Use |
| MACD | Momentum | Trend + momentum confirmation |
| VWAP | Volume | Intraday bias & institutional levels |
| Supertrend | Trend | Clear buy/sell signals & trend direction |
| Bollinger Bands (BB) | Volatility | Breakout & volatility expansion |
| Volume | Volume | Confirm strength behind price moves |
To build a robust strategy with an Intraday Trading Indicator, use a mix of trend + momentum + volume to avoid duplicate signals and improve accuracy. This balanced approach ensures that your chosen Intraday Trading Indicator provides a reliable signal by confirming price movement across different market dimensions.
How Many Indicators should a Trader Use?
A trader should use at most 2-4 indicators to avoid overload and conflicting signals. Using more than 4 indicators does not give you more information; instead, it leads to “analysis paralysis,” where signals contradict and delay the trade.
A well-structured setup has a separate indicator each assigned to a distinct role.
| Category | Role (What it Tells You) | Indicators |
| Trend | Identifies the overall market direction (uptrend, downtrend, sideways) | Moving Averages (EMA/SMA), ADX |
| Momentum | Measures the speed and strength of price movement | RSI, MACD, Stochastic Oscillator |
| Volatility | Shows how much price is expanding or contracting | Bollinger Bands, ATR |
| Volume | Confirms participation behind the move (buying/selling pressure) | OBV, VWAP |
A single indicator used with deep understanding beats five indicators used superficially.
What’s the Difference Between Leading vs Lagging Indicators?
The differences between leading and lagging indicators are mentioned below in the table.
| Leading Indicators | Lagging Indicators |
| Predict future price movement before it happens | Confirm the trend after the price has already moved |
| Give early signals, helping traders enter trades sooner | Give delayed signals, helping traders enter with confirmation |
| Mainly used to spot reversals or pullbacks | Mainly used to identify and follow trends |
| Can generate more false signals due to early prediction | More reliable but may miss the initial part of the move |
| Work best in sideways or range-bound markets | Work best in trending markets |
| Help traders anticipate market direction | Help traders react to market direction |
| Faster in nature as they respond quickly to price changes | Slower in nature as they are based on past data |
| Examples: RSI, Stochastic Oscillator | Examples: Moving Averages, MACD, Supertrend |
Hence, within the realm of Leading or Lagging Indicators, leading tools tell you what could happen next, whereas lagging tools confirm what has already happened. Understanding the distinct roles of Leading or Lagging Indicators is crucial for traders to balance anticipation with confirmation in their strategy.
How to Set Up Trading Indicators on a Chart?
There are four main steps to set up trading indicators on a chart. The steps are mentioned and briefly discussed below.
- Select Trading Platform: Choose charting software like TradingView, MetaTrader, or any broker’s built-in charting tool.
- Launch the Chart: Launch the chart of assets you want to analyze on your preferred timeframe.
- Access the indicator menu: The indicator menu is usually located at the top of the chart toolbar. Click to open the indicator library to search for the indicator of your interest.
- Apply Indicator: Select and apply the indicator you want.
You can customize the indicator setting according to your preference and strategy.


 Previous Article


![15 Investing.com Alternatives [Free+Paid] You Should Use in 2026](https://www.strike.money/wp-content/uploads/2026/04/Investing.com-Alternatives.jpg "15 Investing.com Alternatives [Free+Paid] You Should Use in 2026 100")
![15 TradeStation Alternatives [Free+Paid] You Should Use in 2026](https://www.strike.money/wp-content/uploads/2026/04/TradeStation-Alternatives.jpg "15 TradeStation Alternatives [Free+Paid] You Should Use in 2026 101")
![15 Chartink Alternatives [Free+Paid] You Should Use in 2026](https://www.strike.money/wp-content/uploads/2026/04/Chartlink-Alternatives.jpg "15 Chartink Alternatives [Free+Paid] You Should Use in 2026 102")
: Overview, 10 Types of Indicators, Settings for Different Markets 104")

 : Definition, Formula, calculation, Uses, Advantages Vs limitations 106")


No Comments Yet.