On-Balance Volume (OBV) is a technical momentum indicator that uses volume flow to predict changes in trend. On-Balance Volume was developed by Joe Granville in 1963 and measures buying and selling pressure by focusing on volume. The OBV creates a running total of volume, weighting bullish and bearish days differently. When the closing price rises, the OBV increases by that day’s volume; when the close falls, it decreases.
To calculate OBV, traders determine whether the security closed higher or lower than the previous close. If the close was higher, the current volume is added to a running total. If the close was lower, the current volume is subtracted. This continues for each period to create a cumulative total. Periods with higher closes and volume saw additions, while lower closes led to subtractions. The OBV line can be interpreted on its own or relative to price. Divergences between price direction and OBV direction can potentially flag upcoming reversals.
Some benefits of OBV include its ability to evaluate actual supply and demand imbalances not seen on a price chart. Since it incorporates volume into trends, it strengthens the reliability of signals. Traders can compare the OBV line to the asset’s price to look for divergences, watch for major peaks or troughs as reversal indicators, or use it to confirm the direction of existing trends. Combined with price action, OBV provides a clear picture of overall market participation supporting price moves.
What is On-Balance-Volume?
On-Balance-Volume (OBV) is a technical trading momentum indicator that uses volume flow to predict changes in stock price. On-Balance-Volume was developed in the 1960s by Joe Granville and remains a popular indicator for traders today.
: Definition, How it Works, Calculations, and Trading 76")
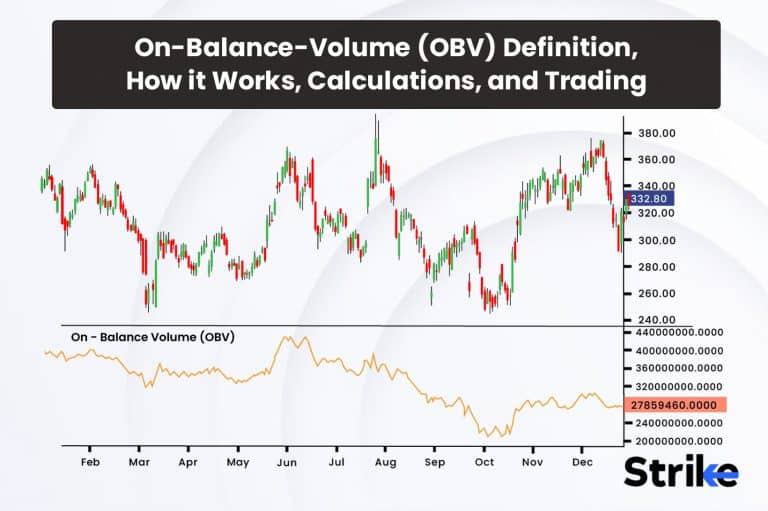
The basic premise behind OBV is that volume precedes price. In other words, OBV operates under the assumption that changes in volume tend to precede changes in stock price. Thus, OBV aims to identify when a stock is being accumulated (bought) or distributed (sold) by analyzing the relationship between price and volume. See the image.
: Definition, How it Works, Calculations, and Trading 77")
The OBV calculation is simple when the closing price is up from the previous close, that day’s volume is added to the running total OBV. The volume for that day is deducted from the running total OBV when the closing price is lower than the previous close. The OBV is not adjusted in the event that the closing price remains the same as it was at the prior close.
The theory behind OBV is that rising OBV indicates accumulation (buying) which signals bullish sentiment, while falling OBV signals distribution (selling) and bearish sentiment. Traders watch for divergences between OBV and price to predict reversals. For instance, negative divergence and weakening in the uptrend are indicated if price is heading higher while OBV is flat or declining.
Traders look for three key signals using OBV.
First, OBV rising along with price confirms an uptrend and signals bullish sentiment. This shows strong buying pressure behind the rally.
Second, OBV falling along with price confirms a downtrend and indicates bearish sentiment. This reflects heavy distribution going on during the decline.
Finally, divergence between OBV and price signals a potential trend reversal ahead. For example, OBV stagnating while price moves higher suggests underlying weakness. This bearish divergence between OBV and price often foreshadows a reversal lower. Similarly, OBV rising while price declines points to accumulation underway and a possible upside reversal. Divergence shows the conviction behind the trend is waning and a reversal sometimes is imminent.
Since OBV tracks positive and negative trading volume, it ignores the magnitude of price changes and only focuses on direction. For this reason, OBV works best on stocks with sustained moves versus stocks that are too volatile. OBV signals are also more significant on longer timeframes (weeks, months) versus very short-term periods.
Some traders will also plot a moving average of OBV to smooth out the line and look for crossover signals. As with any technical indicator, OBV should not be used in isolation but rather as part of a robust trading strategy that utilizes multiple technical and fundamental signals. It is useful to confirm price action and other indicators.
How does On-Balance-Volume (OBV) work?
On-Balance-Volume (OBV) works by tracking the cumulative positive and negative volume flow over time to determine if the volume is being accumulated (buying) or distributed (selling) and thereby signaling bullish or bearish trends and potential reversals. OBV aims to identify whether traders are accumulating (buying) or distributing (selling) a stock by analyzing what the volume is doing as the price moves up and down.
This cumulative total gives traders a smoothed reading of whether volume is flowing into (being accumulated) or out of (being distributed) the stock over time. Rising OBV indicates positive volume flow that signals bullish sentiment. Falling OBV signals negative volume flow and bearish sentiment.OBV essentially converts the absolute volume data into a relative form by determining whether volume on a given day was up-volume or down-volume. Up-volume days accumulate onto the running total, while down-volume days subtract from it.
This running total allows analysts to view the balance of volume as either positive or negative – hence the name On-Balance-Volume. Since OBV tracks positive and negative volume flow, the actual magnitude of price changes is ignored. Only the direction of the close compared to the prior close determines the impact on OBV. For this reason, OBV works best with sustained directional moves versus choppy, or volatile. price action. The signals are also more significant over longer time horizons (weeks, months) as compared to very short-term periods.
How does On-Balance-Volume differ from other types of Volume Oscillators?
On-Balance Volume differs from other Volume Oscillators because it focuses on the cumulative total of positive and negative volume flow over time rather than the raw volume data. While OBV shares similarities, its interpretation and signals vary compared to oscillators like Chaikin Money Flow, Volume Weighted Average Price, and the Accumulation/Distribution Line.
The main distinguishing factor is how OBV is calculated. OBV maintains a running total, adding or subtracting each period’s full volume based on price direction. This cumulative approach results in a smoother flowing line. Other volume oscillators use more complex formulas incorporating some form of smoothing average. For example, Chaikin Money Flow is a 21-period volume weighted average that divides each period’s volume by the sum of volume over that span. This normalization results in more fluctuation.
Since OBV just sums volume, it avoids volatility smoothing and remains sensitive to the latest volume changes. OBV also nets buying and selling volume into one indicator, rather than having separate lines. Due to its cumulative structure, OBV is useful for gauging sustained buying or selling pressure in a clear trend. Its steady slope reflects conviction, validating a trend’s strength. Sideways OBV warns of weakening momentum.
Oscillators like Chaikin Money Flow are less effective as trend confirmation tools. Their values are bound within a range rather than trend higher or lower over time. Normalisation also prevents sustained slopes. However, this makes oscillators better for identifying overbought/oversold levels. OBV divergences are more defined for spotting reversals. OBV clearly peaks or troughs on a sustained trend, setting up clear non-confirmation when price makes a new extreme.
With bounded oscillators, divergences are less visually apparent. Their values fluctuate up and down rather than display sustained momentum. Divergences sometimes emerge but generally need other indicators to confirm weakness. Due to its unbounded range, OBV is also useful for breakout strategies. Sustained OBV trends result in well-defined support and resistance levels. Breaking above resistance signals upside conviction, while breaking below support signals downside conviction.
Volume oscillators that stay range-bound have less clear breakout points. Their values fluctuate within an expected range rather than establish defined floor and ceiling levels. So breakout signals are less actionable. OBV’s signals are unique enough that traders often use OBV in conjunction with other volume oscillators. OBV provides the clean trend perspective while oscillators better capture short-term fluctuations. Together they provide comprehensive insights.
For example, OBV could confirm the overall trend while Chaikin Money Flow identifies overbought pullback points. OBV spotting supports break failures while Volume Weighted Average Price warns of bearish momentum shifts. OBV is considered more of a leading indicator, often shifting direction ahead of prices. The smoothing in other volume oscillators cause slight lags in their signals. OBV’s sensitivity allows it to react earlier to subtle buying/selling imbalances.
However, other volume oscillators avoid whipsaws better than OBV. Their smoothing helps filter out market noise and false signals. OBV whipsaw more often, generating poor timing signals. Integration with other indicators is recommended. OBV’s simple line chart offers easy visual trend analysis. Traders quickly assess the slope and spot sustained momentum or divergence. Other volume oscillators display less visual clarity, with more jagged ups and downs.
However, volume oscillators often confirm signals better when both lines are in sync. With OBV having just one line, traders must compare the price chart. Two-line oscillators allow more self-contained analysis.
What is the importance of On-Balance-Volume (OBV)?
The importance of On-Balance-Volume (OBV) is that it shows cumulative money flow in and out of security to help identify emerging trends or confirm existing ones in price movement. On-balance volume (OBV) plays an influential role in technical analysis by providing a powerful momentum indicator based on volume. OBV offers valuable insights into crowd psychology and changes in supply/demand that impact price movements.
One of the most important uses of OBV is confirming the strength or weakness of an existing price trend. As a trend unfolds, OBV provides clues about the conviction behind the move. Rising prices with rising OBV validates that buyers are in control and moving the market higher. Falling prices with falling OBV confirms sellers are in control, exerting downside pressure. OBV sloping steeply in the direction of the trend signals strong, sustained conviction driving prices. Sideways OBV during a price trend warns of waning enthusiasm and potential exhaustion. By analyzing OBV trends, traders gain confidence in the durability of price moves.
Divergences between OBV and price often foreshadow market reversals. As smart money begins unloading positions ahead of weakness, OBV will flatten out or move contrary to the price trend. This loss of confirmation signals potential exhaustion. For example, OBV flattening as prices continue higher alerts traders to muted buying enthusiasm. The negative divergence means fewer buyers are driving the uptrend, raising odds of a reversal. By spotting divergence, OBV helps traders prepare early for trend changes.
Surges in OBV often precede breakouts as enthusiasm builds ahead of the price move. OBV breaking out above a prior high indicates strong buying conviction that could power an upside breakout. OBV breaking down from a low signals heavy distribution fueling a downside break. Since OBV reacts faster than price, it will signal the increase in enthusiasm before the price makes its technical break. This gives traders an edge in positioning before the eventual breakout. OBV breakouts confirm high conviction behind new trends.
What is the Formula for On-Balance-Volume (OBV)?
The current period’s On-Balance Volume is the previous period’s On-Balance Volume plus the current period’s volume if the current close is higher than the previous close, minus the current period’s volume if the current close is lower than the previous close, or unchanged if the current close equals the previous close.
It is calculated using a simple formula that adds volume on up days and subtracts volume on down days.
The formula for calculating On-Balance Volume is as stated below.
OBV = Previous OBV + Current Period’s Volume if Close > Previous Close
OBV = Previous OBV – Current Period’s Volume if Close < Previous Close
OBV = Previous OBV if Close = Previous Close
Where,
Previous OBV = The OBV from the previous period
Current Period’s Volume = The volume for the current period
Close = The closing price for the current period
Previous Close = The closing price from the previous period
So in plain terms, the OBV adds the volume on days when the closing price is up and subtracts the volume when the closing price is down. The OBV stays the same in the event that the closing price is unchanged from the prior close.
The initial OBV value starts at zero. As each period’s volume is added or subtracted, a running total is calculated and plotted as a line on a chart. Rising OBV levels indicate increased buying pressure while falling OBV levels indicate increased selling pressure.
How to Calculate On-Balance-Volume (OBV)?
Calculate On-Balance Volume (OBV) by taking the previous period’s OBV and adding the current period’s volume if the current close is higher than the previous close, subtracting the current period’s volume if the current close is lower than the previous close, or leaving it unchanged if the current close equals the previous close. Calculating the On-Balance Volume indicator requires carefully following a sequence of steps. Begin by assembling the required data – you will need the closing price and trading volume for each period you wish to analyze. This could be daily, weekly or intraday time frames. Organize the data chronologically in a spreadsheet with separate columns for date, closing price, volume and OBV.
The calculation part stays a theoretical and mathematical concept as the OBV as an indicator is freely available on all the charting platforms like Strike.money, tradingview.
Review how OBV responds to price trends. Rising price with increasing OBV shows strong buying pressure. Falling price with decreasing OBV reflects solid selling pressure. Divergences such as OBV recording new highs while price fails to confirm indicates waning enthusiasm. Combine OBV signals with other indicators like momentum oscillators to clarify entry and exit points. Use long term OBV peaks and troughs to identify support and resistance.
How to use On-Balance-Volume (OBV) in Trading?
On-Balance-Volume (OBV) tracks trading volume and can be used to confirm price trends or signal potential reversals by comparing price action to volume flow. Analyse On-Balance Volume trends, momentum shifts, divergences with price, and volume surges on breakouts to gauge buying or selling pressure and identify profitable trade entry, exit and risk management strategies.
: Definition, How it Works, Calculations, and Trading 78")
1. Choose the appropriate timeframe and asset class to analyse with OBV
On-Balance Volume is a versatile indicator that is used across most liquid markets and timeframes. For active intraday trading, use OBV on short timeframes like 5-15 minute charts to catch quick price swings. Swing traders analyze OBV on 4-hour, daily or weekly charts to track longer term trends. OBV is applied to all the forms of capital markets. Below attached is an example of how OBV can be used on lower time frames like 15min. It gives crucial information that can be added as a clue in the trading plan.
: Definition, How it Works, Calculations, and Trading 79")
2. Identify areas of convergence/divergence between OBV and price
Analyzing how On-Balance Volume corresponds to price action provides clues about the strength and direction of the trend. An uptrend with consistent purchasing pressure is confirmed when OBV increases in step with the price reaching repeated new highs.
However, bearish divergence is signaled when OBV declines while the price continues rallying to new highs. This demonstrates that buying pressure is decreasing, signaling potential weakness ahead despite the higher prices. Comparing OBV directionality against the price trend reveals whether the trend has solid support or if a reversal is ahead. An example of how OBV can be used to observe convergence or complimentary signs is attached below.
: Definition, How it Works, Calculations, and Trading 80")
3. Look for OBV to lead or confirm price breaks and reversals
On-Balance Volume provides early clues about pending breakouts and breakdowns in price. Before a price breakout, rising OBV suggests developing momentum and suggests that a big move is probably coming. In contrast, it sometimes indicates an impending breakdown even before price begins to fall if OBV is continuously falling while price is range-bound.
The lead or lag relationship between OBV and price direction acts as an early indicator of whether a breakout will succeed or breakdown will occur. Analyzing OBV flows and momentum shifts provides advance notice of price reversals and the strength of continuation moves. The chart uploaded below is a 15min chart of Nifty 50. One can observe, a clean trend is defined by follow up higher high’s on OBV. The dip is used to enter long positions.
: Definition, How it Works, Calculations, and Trading 81")
4. Use OBV highs and lows to define support and resistance
The high and low points in On-Balance Volume define potential support and resistance levels. During an uptrend, when OBV reaches a peak, subsequent declines often see this area transforming into resistance, with price tending to stall and reverse around this prior volume high. Similarly, troughs and lows in OBV during downtrends frequently turn into support zones on the next upswing, as buyers return around the previous low volume area.
Analyzing historical OBV highs and lows provides insights into key reversal areas, and these prior maximums and minimums in volume should be monitored on counter-trend moves. The turning points in OBV highlight significant areas of supply and demand. An example of how long the position was taken with the help of OBV is attached below.
: Definition, How it Works, Calculations, and Trading 82")
5. Trade in the direction of OBV trends and momentum shifts
On-Balance Volume trends generate clear trade signals. Traders sometimes want to try to go long during a prolonged rally while OBV is increasing. This way, they sometimes profit from the positive rise and exit when OBV levels out or begins to decline. On the other hand, short bets sometimes open to profit from the downward move when OBV is in a sustained downtrend, covering when OBV bottoms out and starts to curve higher.
Trading in the direction of OBV trends allows you to capitalize on extended moves driven by an imbalance of buying or selling pressure. Shifts in OBV from uptrend to downtrend or vice versa help pinpoint entry and exit points. How the momentum shift can be spotted using the indicator can be seen in the image uploaded below.
: Definition, How it Works, Calculations, and Trading 83")
6. Combine OBV signals with other indicators for confirmation
Using On-Balance Volume in conjunction with other indicators provides more robust signals. OBV is combined with oscillators like RSI to help measure overbought or oversold conditions and spot divergences. Adding moving averages to the OBV chart helps determine the directional bias of the volume trends.
A rising OBV above its MA signals consistent buying pressure in an uptrend, while OBV falling below its MA indicates persistent selling pressure. Using OBV with price oscillators and moving averages provides perspective on the strength of the existing trend and the potential for reversals. Integrating OBV with tools like RSI and MAs creates a more complete analytical approach. How moving averages applied on OBV and RSI can create trading opportunities can be observed from the image uploaded below.
: Definition, How it Works, Calculations, and Trading 84")
7. Set appropriate stop losses based on recent OBV levels
On-Balance Volume levels inform appropriate stop loss placement. On long trades, placing stops just below key support levels on OBV helps limit downside risk if the uptrend reverses. The OBV support provides an indication of downside interest and potential turning points. For short trades, having upside stops above OBV resistance allows profits to accumulate during the downtrend while limiting risk if OBV breaks resistance. Setting stops based on OBV highs and lows helps define logical stop levels with volume-based confirmation instead of arbitrary price levels. OBV’s insight into support and resistance contributes to effective stop loss strategy.
8. Track OBV divergences and failures swings for reversal signals
One powerful signal to watch for is divergence between OBV and price, especially lower highs on OBV as price makes new highs. This bearish divergence signals that upside momentum is waning even as prices push higher. There is less purchasing demand driving price increases when OBV reaches lower highs when price rises above prior highs.
This hidden weakness often leads to a reversal, with price turning downwards soon after OBV diverges. Tracking OBV divergences, especially lower highs, provides an early warning of a potential impending correction. Price making lower highs and indicator making higher high’s is a sign of hidden bearish divergence. This is spotted in advance to a proper fall. Appropriate risk management should be incorporated to take trades.
: Definition, How it Works, Calculations, and Trading 85")
9. Analyze volume surges on breakouts for added conviction
When price is near the resistance or support, monitoring OBV during that time can be helpful. If before breakout or breakout, OBV rises or falls sharply, it may indicate strength of the breakout thereby confirming additionally if the breakout trade is supposed to be taken or not. Though confluences can be taken from other indicators and tools to further solidify a trading plan.
How can OBC be used to identify trends in the market?
OBV identifies trends in the market by using volume to confirm price moves, with major volume spikes on breakdowns and breakouts validating the strength and conviction behind emerging trends. OBV provides valuable information about the strength of a trend and signals potential reversals ahead of the price. Understanding how to analyze OBV helps traders spot opportunities and make more informed decisions.
One of the most valuable uses of On Balance Volume (OBV) is identifying upcoming trend reversals ahead of the price. OBV frequently tops or bottoms earlier than the price itself. A decreasing purchasing excitement is indicated when the OBV peaks and begins to decline while the price is still climbing. This divergence suggests the uptrend is running out of momentum and likely nearing exhaustion.
It indicates fresh accumulation, on the other hand, if OBV bottoms out and starts to rise as the price keeps dropping. The early increase in volume on up days signals a potential bullish reversal ahead. Savvy traders will set custom OBV divergence thresholds to trigger automated alerts for high-probability reversals. By spotting peaks and troughs in OBV ahead of price action, traders gain invaluable early warnings of trend reversals before they become obvious to the broader market. This helps time entries and exits at more optimal points.
On Balance Volume is useful for measuring the conviction behind price breakouts and breakdowns. A significant increase in OBV indicates that buyers are firmly committed to the rally when the price breaks out over a significant resistance level. Heavy buying volume fuels the move and confirms the strength of the emerging uptrend. Similarly, major volume surges accompanying downside breakdowns signal strong selling pressure that affirms the start of a new downtrend.
What is the best trading strategy for On-Balance-Volume (OBV)?
The most effective way to trade using OBV is to use it for confirming price action and identifying divergences that signal emerging trend shifts. OBV should not be used in isolation but rather in conjunction with other indicators and price analysis.
Use OBV to validate a trend identified using moving averages or chart patterns. Rising OBV confirms uptrends, falling OBV confirms downtrends. Price growth with a flat or declining OBV suggests waning momentum, which might lead to a trend reversal. Comparably, declining price combined with flat or rising OBV signals a potential shift in trend direction. OBV divergences occur when OBV and price are out of sync, signaling shifts in momentum.
A possible slump is indicated and diminishing enthusiasm is reflected if OBV peaks but price keeps rising. Consider exciting longs. A possible slump is indicated and diminishing enthusiasm is reflected if OBV peaks but price keeps rising. Prepare to enter longs. Divergences often precede trend reversals by several periods, so wait for confirmation before acting.
Analyze OBV on price breakouts above key resistance or breakdowns below support. Heavy OBV on breakouts confirms strong buying pressure. Weak OBV warns of false breaks. Use volume surges to differentiate between valid breakouts versus failed moves. In the chart below, critical analysis of OBV can help take trades based on the current trend and fake trades can be intentionally avoided.
: Definition, How it Works, Calculations, and Trading 87")
Rising OBV in uptrends shows momentum is expanding. Stay with the trend. Declining OBV in uptrends signals waning momentum and higher reversal risk. Consider exciting longs. Falling OBV in downtrends suggests acceleration. Maintain short positions. Flattening or rising OBV in downtrends reflects dissipating momentum. Take profits on shorts. A bearish divergence is indicated, for instance, if a stock’s price breaks out to new highs but OBV is unable to confirm with new highs. This warns that buying momentum is faltering. Traders sometimes look to close out long positions and prepare for a potential trend reversal. Using OBV with price action in this way greatly improves timing and risk management.
Which is the best time to trade using On-Balance-Volume (OBV)?
The best times to trade using On-Balance Volume (OBV) are when it diverges from price, breaks out of a range, or confirms price patterns and indicators.
Divergences between price and OBV are one of the most powerful trade signals. A bullish divergence forms when price makes a lower low but OBV makes a higher low. This divergence between price and volume suggests that selling pressure is waning and the downtrend could reverse. This bullish divergence signals it’s a good time to buy. A bearish divergence forms when price makes a higher high but OBV makes a lower high. The divergence signals that buying pressure is waning and the uptrend could reverse. This warns it’s a good time to sell or short the stock.
Traders look to buy on bullish divergences and sell on bearish divergences. The divergences indicate that volume is not confirming the price trend, which often leads to a trend reversal. Divergence signals a high probability reversal setup, making it one of the best times to trade with OBV.
OBV breaking out from a trading range signals a shift in sentiment that fuels a price breakout. The OBV indicates strong buying pressure if it is fluctuating inside a range and then breaks out to new highs. Because OBV has the potential to drive a bullish price breakthrough, now is an excellent moment to purchase. A breakdown of the OBV to new lows outside of its range indicates more selling pressure. This warns of a potential bearish price breakout and makes it a good time to sell or short the stock.
Traders look to buy when OBV breaks out to new highs and sell when it breaks down to new lows. The OBV breakout signals a surge in volume that drives the next major price move.
Traders also use OBV to confirm price chart patterns and indicators. The likelihood that a pattern such as a double bottom will lead to a bullish breakout increases if the OBV verifies the pattern with a higher low. Rising purchase volume is indicated by the OBV confirmation, which feeds the upward trend. This makes it a high probability to buy.
A breach of OBV support indicates that the trend is under distribution and about to break down if OBV is being used to validate upward-sloping trend lines or moving averages. OBV breakdowns confirm weakness and signal it’s time to sell. OBV discovers favorable entry points and enhances trading signals when it confirms or deviates from price patterns and indications.
Can On-Balance-Volume (OBV) work in conjunction with Moving Averages?
Yes, On-Balance-Volume (OBV) works well when used in conjunction with Moving Averages. OBV is a technical analysis indicator that measures buying and selling pressure by volume. It tracks the cumulative total volume on up days and down days across a time period. Moving Averages smooth out price action over a window of time to identify trends and potential areas of support or resistance. Using OBV with Moving Averages provides a more complete picture of market momentum and trends.
What are the advantages of On-Balance-Volume (OBV)?
OBV incorporates volume analysis to confirm price trends, signal potential reversals early, identify support/resistance levels, gauge trend strength and weakness, and provide simple trend-following signals.
1. Identifies Trend Strength and Weakness
One of the main benefits of OBV is it determines whether volume is flowing in the direction of the price trend or diverging. Rising OBV during an uptrend shows strong buying interest and upside conviction. This validates the strength of the trend. But in the middle of an upswing, a flat or declining OBV line indicates decreasing excitement and even trend fatigue. OBV helps discern fakeouts from genuine breakouts.
2. Signals Potential Trend Reversals
OBV provides early reversal warnings before price peaks or bottoms. This divergence suggests buyers are losing interest right as the uptrend is ending. An early reversal indication occurs when the OBV line falls below its uptrend line before the price does. The opposite occurs at bottoms, as above sometimes rise ahead of the next rally.
3. Incorporates Volume Analysis
Since OBV focuses on volume changes, it incorporates a key element missing from many indicators – volume! Volume reflects the true conviction behind a price move. Volume confirms price breakouts and breakdowns.
4. Simple to Use
Traders easily add OBV to their charting setups and integrate it into their broader analysis. No complex maths required!
5. Works on All Timeframes
OBV is applied to charts ranging from 1-minute to monthly. Intraday traders consult OBV to look for volume surges or divergences off intraday highs/lows. Swing traders use daily OBV to assess whether volume aligns with multi-week trends. OBV adapts to any trading timeframe.
6. Identifies Support and Resistance
OBV movements identify potential support or resistance levels. Zones where OBV repeatedly peaks or bottoms highlight areas of supply/demand. These price zones reflect areas of trading interest where reactions sometimes occur. Volume precedes price, so OBV pinpoints support/resistance.
7. Suitable With Other Indicators
OBV combines well with price-based indicators like moving averages. OBV sometimes confirms price indicator signals, or divergences sometimes signal early warnings. Since OBV focuses on volume, it adds a complementary dimension to technical toolkits. OBV works for chartists of all styles.
8. Confirms Breakouts and Breakdowns
Rising OBV on upside breakouts indicates strong buying interest and upside conviction. But without OBV confirmation, breakouts are questionable and prone to fail. Similarly, OBV confirms downside breakdowns if selling volume accelerates lower. OBV adds a volume layer to analyse the validity of price moves.
OBV delivers valuable volume analysis to complement price indicators. It serves as a simple yet powerful trend, momentum and volume analysis tool based on a straightforward calculation.
What are the disadvantages of On-Balance-Volume (OBV)?
OBs lagging nature, lack of clear signals, vulnerability to false signals and whipsaws, blindness to intrabar price action, and limited customization options are notable disadvantages.
1. Lagging Indicator
Like many technical indicators, OBV is based on past price action and thus tends to lag current price movements. There is often a delay between price moves and OBV signals. The lagging nature limits its effectiveness for very short-term traders. OBV does not capture imminent reversals fast enough at major tops and bottoms.
2. No Clear Trading Signals
OBV is not an oscillator with overbought or oversold levels that provide clear trading signals. It is a volume-based trend following tool. OBV requires visual interpretation of its pattern relative to price – it does not directly flash buy or sell signals. This subjectivity poses challenges.
3. Vulnerable to False Signals
OBV patterns are prone to false signals. For example, a temporary price spike on low volume could flip the OBV line lower incorrectly. Choppy market conditions sometimes cause the OBV line to whipsaw above/below its moving average producing false signals. Interpretation requires practice.
4. Flat Trading Ranges
OBV tends to move directionally in tight trading ranges lacking a clear trend. As price oscillates in a range, OBV just reflects that back and forth bounce. OBV works best in trending markets and sometimes struggles in range-bound conditions.
5. Ignores Intrabar Movements
OBV only accounts for the closing price each period relative to the close of the previous period. But much happens within each bar that OBV misses. For intraday traders especially, this simplistic construction is a notable limitation.
6. No Standard Parameter Settings
OBV has no set time periods or intervals to optimize like moving averages or stochastics. Traders cannot tweak OBV settings to adapt it to market conditions or their strategy. OBV lacks customization available with other indicators.
7. Difficult to Combine Signals
Since OBV analyzes volume, it is not as straightforward to use OBV together with pure price-based indicators. Traders must determine how to weigh OBV signals versus other technical indicators on their own. OBV does not blend easily into the indicator toolkit.
8. Limited Use Case
OBV is primarily just suited for trend identification; less useful for oscillating markets or precise entry/exit timing. It does not offer overbought/oversold guidance or help set price targets. OBV has a relatively confined use case compared to more flexible indicators.
Using OBV in combination with price-based indicators improves effectiveness. OBV is one useful tool that is best utilized as part of a broad trading approach.
Is On-Balance-Volume (OBV) a good indicator?
Yes, On-Balance Volume is a moderately used indicator that has a few advantages to it. Though it cannot be used in isolation, it can be used alongside multi time frame analysis, price action study and different indicators to generate a robust view. Appropriate risk management should be incorporated in a trading plan that can provide a high probability setup. OBV provides helpful trend confirmation and early reversal warnings to traders. Buying conviction and upward momentum are validated when OBV is growing in line with an uptrend. Furthermore, divergence between OBV and price often signals a reversal is looming.
Is On-Balance-Volume (OBV) an oscillator?
No, On-Balance Volume is not an oscillator. OBV is a volume-based trend following indicator rather than an oscillator with cyclical highs and lows. Oscillators like RSI, Stochastics and MACD fluctuate within a band of zero to 100 or -100 to 100. They utilize math formulas to convert price data into horizontal trading ranges. Readings above 70-80 signal overbought conditions, while levels below 30-20 indicate oversold.
Is OBV a lagging indicator?
Yes, On-Balance Volume is considered a lagging indicator. The core reason is that OBV is constructed based on past price action rather than predicting future moves. All technical indicators have some degree of lag since they analyze what has already occurred on the chart. But OBV has a more delayed reaction than leading indicators like moving averages.
What is the difference between On-Balance-Volume and Money Flow Index?
| OBV | MFI |
| OBV is a trend following indicator that tracks cumulative volume flow. | MFI is an oscillator that measures overbought/oversold levels. |
| OBV provides trend confirmation and potential reversal warnings based on the slope of the cumulative volume line. | MFI functions as an oscillator that fluctuates between 0-100. Readings above 80 signal overbought conditions, while levels below 20 indicate oversold conditions. |
| OBV has no bounded range but rather rises/falls with price. | MFI cycles up and down within a set 0-100 band. |
| OBV is typically considered a lagging indicator. | MFI uses smoothed calculations that make it more of a leading indicator in timing cycle turns. |
| OBV is best suited for swing trading time frames such as daily or weekly charts. | MFI adapts better to both short and longer-term timeframes, from intraday scalping to long-term investing. |
| OBV divergence signals are more infrequent and difficult to spot. | MFI divergences tend to be more pronounced at cycle turning points due to its mean-reverting nature |
OBV is a trend following indicator that tracks cumulative volume flow, while MFI is an oscillator that gauges overbought/oversold levels based on money flow calculations.
OBV simply tracks cumulative volume on up days and down days over a given period. Up volume adds to the running total, down volume subtracts. MFI uses a more complex calculation to measure the strength of money flow in and out of a security. MFI averages gains and losses based on open, high, low and close prices.
OBV provides trend confirmation and potential reversal warnings based on the slope of the cumulative volume line. Rising OBV confirms uptrends, falling OBV confirms downtrends. MFI functions as an oscillator that fluctuates between 0-100. Readings above 80 signal overbought conditions, while levels below 20 indicate oversold conditions.
OBV operates as a trend following indicator, with its slope showing the conviction behind a trend. MFI oscillates between overbought/oversold levels identifying cycle highs and lows. OBV has no bounded range but rather rises/falls with price. MFI cycles up and down within a set 0-100 band.
OBV is typically considered a lagging indicator since it reacts to volume that has already occurred. MFI uses smoothed calculations that make it more of a leading indicator in timing cycle turns. MFI will generally top or bottom ahead of the price.
OBV is best suited for swing trading time frames such as daily or weekly charts. It needs extended moves to display trending directionality. MFI adapts better to both short and longer-term timeframes, from intraday scalping to long-term investing.
For both OBV and MFI, divergences between the indicator and price sometimes signals potential reversals. However, MFI divergences tend to be more pronounced at cycle turning points due to its mean-reverting nature. OBV divergence signals are more sporadic.


 Previous Article


![15 Investing.com Alternatives [Free+Paid] You Should Use in 2026](https://www.strike.money/wp-content/uploads/2026/04/Investing.com-Alternatives.jpg "15 Investing.com Alternatives [Free+Paid] You Should Use in 2026 94")
![15 TradeStation Alternatives [Free+Paid] You Should Use in 2026](https://www.strike.money/wp-content/uploads/2026/04/TradeStation-Alternatives.jpg "15 TradeStation Alternatives [Free+Paid] You Should Use in 2026 95")
![15 Chartink Alternatives [Free+Paid] You Should Use in 2026](https://www.strike.money/wp-content/uploads/2026/04/Chartlink-Alternatives.jpg "15 Chartink Alternatives [Free+Paid] You Should Use in 2026 96")
: Overview, 10 Types of Indicators, Settings for Different Markets 97")


 : Definition, Formula, calculation, Uses, Advantages Vs limitations 100")


: How We Used This 70/30 Indicator in 6 High Win-rate Strategies 103")


No Comments Yet.