The put-call ratio is a popular sentiment indicator that analyses the total number of put options traded versus call options on a given day. A put option trades on the expectation that an asset will fall in price, while a call option trades on the expectation of a price rise. The put-call ratio aims to gauge market optimism or pessimism based on options demand. A high put-call ratio means more puts than calls were traded and implied a more bearish sentiment, while a low ratio is considered bullish.
To calculate the put-call ratio, traders simply divide the total put options traded by the total call options traded, usually at the end of each day. Ratios above 1 signal a higher number of puts being purchased. Over 0.70-0.80 is often seen as a bearish threshold, while under 0.50 is usually considered bullish. Charts of 10-day or 21-day moving averages of the ratio are also monitored to identify shifts in sentiment over a period of time.
Some advantages of the put-call ratio include its ability to act as a contrarian indicator. Excessively bullish or bearish readings have historically coincided with market tops and bottoms. It represents the sentiment of options traders, who tend to be more experienced market participants. The ratio’s signals typically precede price movement as emotions tend to change before prices. Monitoring divergences against the market direction and crossovers of moving averages can highlight low-risk entry areas against the prevailing sentiment.
What is the Put-Call Ratio?
The put-call ratio is a technical indicator that measures the trading volume of put options relative to call options to gauge sentiment in the options market. The put-call ratio shows the number of put options traded divided by the number of call options traded during a given period.

A higher put-call ratio indicates that more put options are being traded relative to call options, suggesting a bearish sentiment. This is because put options profit when a stock price falls, while call options profit when the stock rises. Traders sometimes bet on or hedge against a decline in the stock market when they purchase more puts than calls. A lower put-call ratio signals more call option trading compared to put options, reflecting bullish sentiment. This shows traders expect stock prices to rise. A low put-call ratio sometimes indicates overconfidence and an overheated market, which could lead to an impending correction.
There are three main put-call ratios that traders analyse to gauge market sentiment. The Total Put-Call Ratio aggregates the trading activity across all options markets. It provides a broad overview of sentiment, with readings above 0.7-0.8 implying bearishness and lower readings indicating bullishness. The Equity Put-Call Ratio specifically looks at options on individual stocks. High equity ratios signal pessimism towards the overall stock market.
Finally, the Index Put-Call Ratio focuses on put and call volumes for major market indexes like the S&P 500. High index put-call ratios reflect concerns about the market’s direction as a whole rather than individual equities. These three put-call ratios provide insight into sentiment among different segments of the options marketplace.
Technical analysts look at put-call ratio trends and extremely high or low levels to anticipate reversals. For example, a put-call ratio above 1.0 is seen as an oversold signal, while a ratio below 0.40 could indicate overbought conditions. However, the put-call ratio is open to interpretation and works best when combined with other indicators. For one, a high put-call ratio could show excessive pessimism that leads to a relief rally. Also, institutional investors sometimes purchase puts to hedge portfolio risk rather than speculate.
There are sophisticated variations of the basic put-call ratio that have emerged. These include using moving averages, equity-only ratios, open interest rather than volume, oscillators, adjusted ratios, composites, commitments of traders data, and zero-basis ratios. The goal of these variations is to filter out distortions, improve signal quality, isolate speculative activity, weigh relevant options more heavily, blend data for robustness, and provide a clearer picture of sentiment and expectations in the options market. By fine-tuning the basic formula, analysts gain more strategic insights into shifting psychology among options traders.
The put-call ratio provides an insightful contrarian indicator for assessing emotions and price trends in the options market. However, analysts recommend combining it with other technical and fundamental indicators to validate signals and avoid whipsaws. Careful analysis of put-call ratios allows traders to gauge market tops and bottoms, but raw ratios without context have limited benefits.
How Does Put-Call Ratio Work?
The put-call ratio works by dividing put option volume by call option volume over a specified period to gauge sentiment and positioning in the options market, with high readings indicating bearishness and low readings signalling bullishness. The put-call ratio is based on the trading activity between put options and call options during a specified period. Puts give the holder the right to sell the underlying asset, while calls give the holder the right to buy the asset. Traders buy puts when they expect prices to fall, and buy calls when they anticipate prices rising.

The mechanics behind the put-call ratio involve monitoring the volumes of put-and-call option contracts traded on exchanges. Higher put volumes indicate bearish sentiment, as traders pay premiums for downside protection or the ability to profit from declines. Higher call volumes show bullishness as traders bet on or hedge against rising prices.
The put-call ratio is calculated by taking the total number of put option contracts traded and dividing it by the total number of call option contracts traded. In the event that one million calls and 500,000 puts are traded in a single day, the put-call ratio equals 0.5 (500,000/1,000,000). A lower ratio indicates greater bullishness.
The three main types of put-call ratios tracked by traders and analysts are the Total Put-Call Ratio, the Equity Put-Call Ratio, and the Index Put-Call Ratio. The Total Ratio aggregates put and call volumes across all optionable securities to provide an overall snapshot of market sentiment. The Equity Ratio looks specifically at put and call activity for individual stocks to gauge sentiment towards equities. The Index Ratio focuses solely on major market indexes like the S&P 500 to reveal sentiment on the overall market direction rather than individual stocks. These three primary put-call ratios allow traders to assess sentiment among different segments of the options market.
The equity put-call ratio filters out noise from index options to hone in on sentiment towards stocks. The index ratio isolates sentiment on the overall market. The total ratio captures a broad overview. Raw put-call ratios have limitations, so analysts use processed versions to improve trading signals. These techniques include moving averages to smooth volatility, equity-only ratios to isolate stocks, open interest rather than volume to show accumulation, oscillators to clarify signals, adjusted ratios weighting active options, composites blending data, commitments of traders separating speculators, and zero-basis ratios focusing on speculative opening trades. By refining the raw ratios, analysts filter out noise, detect subtle shifts in sentiment, and generate higher-quality options trading signals.
The appeal of the put-call ratio is its contrarian interpretation. High put-call ratios suggest excessive pessimism that sometimes marks a bottom, while low ratios imply exhaustion of call buying that sometimes signals a top. This contrarian perspective lets traders fade and capitalise on overcrowded trades. However, the put-call ratio mechanism has nuances. For example, a high put-call ratio after a long downtrend sometimes confirms negative bias rather than mark capitulation. Also, high put activity sometimes reflects institutions hedging long stock portfolios rather than speculating.
What is the Importance of Put-Call Ratio?
The importance of the put-call ratio is that it acts as a contrarian indicator to identify extremes in investor sentiment that tend to mark major market turning points and provide trading opportunities. Marked extremes in the put-call ratio often mark inflexion points where trends are exhausted. High put-call ratios signal high pessimism levels that are unsustainable and due to reverse into bullishness. Low put-call ratios flag euphoria that may soon face disappointment. These extremes exhibit conditions where traders have become overly committed on one side of the market, creating an opportunity for the contrarian trader.
The ratio measures traders’ willingness to pay premiums for protection or upside speculation. Declining put-call ratios signal risk appetite is strong as market participants buy calls to capture the upside. Rising ratios show risk aversion as puts are purchased to hedge the downside. The put-call ratio helps gauge shifts in emotions and expectations driving markets.
When Do Traders Use Put-Call Ratio?
Traders use the put-call ratio to identify market bottoms and tops, confirm trend breaks, fade overcrowded trades, gauge positioning into major events, trade volatility, and find inflexion points across markets and time frames. The put-call ratio is used by traders across multiple asset classes and time frames. Swing traders look for medium-term turns in stocks using daily or weekly put-call ratios. Ratios falling under 0.60 sometimes signal upside exhaustion to sell or short a stock. Ratios rising above 0.90 sometimes flag capitulation to buy the dip. The 21-day moving average filters noise for a steadier indicator.
High put-call ratios near capitulation lows help identify climactic selling exhaustion. For example, put-call ratios on the S&P 500 above 1.2 reflect extreme bearishness, signalling a washout bottom. Traders wait for the first higher low to confirm the bottom before entering long positions.
As a trend confirmation tool, falling put-call ratios validate upside breakouts from trading ranges, while rising ratios confirm downside breakouts. This aligns traders with momentum. Contrarian traders fade the crowded trade when sentiment heavily tilts towards one side. For example, very low 10-day equity put-call ratios near 0.40 could mark euphoria to fade with put options or short positions.
Leading into earnings events, high put-call ratios indicate conservative positioning and downside protection. This flags the potential for a positive surprise and relief rally. Low put-call ratios show upbeat sentiment, making the stock vulnerable to disappointment. Rising put-call ratios signal increasing demand for volatility via put options. This could mean a volatility expansion trade using VIX calls or futures. Conversely, falling ratios warn of volatility complacency to fade with VIX puts or futures.
Oversold rallies are common when the put-call ratio spikes above 1.0 or its 21-day moving average in a falling market. The deeply oversold condition points to a temporary low and snapback rebound within the broader downtrend. Comparing put-call ratios across sectors reveals relative bullish or bearish positioning. Traders act on extremes, rotating into sectors, seeing excessive pessimism and exiting sectors showing optimism.
Around major events like FOMC meetings, high put-call ratios indicate conservative positioning and downside hedging. This leaves room for positive surprises and relief rallies. Low ratios flag unhedged euphoria and vulnerability. Major market bottoms produce high put-call ratio spikes over 1.2 or more. Oversold peaks over 1.0 in a falling market also flag potential reversal points. Major market tops see put-call ratio lows under 0.60, reflecting complacency.
What are the Advantages of Using the Put-Call Ratio as an Indicator?
The main advantages of using the put-call ratio as an indicator are that it provides contrarian signals at extremes smooths data into a reliable oscillator, universally applies across markets, improves timing, aids risk management, confirms trends, predicts volatility changes, and reveals overcrowded trades.
1.Contrarian Signal
The put-call ratio acts as a contrarian indicator that identifies capitulation bottoms and euphoric tops when sentiment becomes unsustainably extreme. This allows traders to fade crowd behaviour at major turning points.
2. Robust Leading Indicator
Put-call extremes tend to lead to price reversals rather than lag them. This gives traders an edge in identifying emerging trend changes.
3. Universal Application
The put-call ratio is applied across stocks, ETFs, indexes and commodities. It works on short-term day trading up to long-term analysis.
4. Versatile Uses
Traders use the ratio for spotting oversold bounces, event positioning, volatility trades, sector rotations, and more. It is not limited to overbought/oversold reversals.
5. Smooth Data Series
Moving averages of the ratio filter out noise and create a steady, reliable oscillator useful for clear signals.
6. Easy Calculation
The basic ratio calculation is simple and straightforward. Traders can easily track it themselves rather than rely on third-party tools.
7. Improves Timing
Major peaks and troughs are consistently marked by extremes in the put-call ratio. This generates a high probability of swing trade entry and exit points.
8. Risk Management
High put-call ratios indicate conservative positioning, defining lower-risk opportunities. Low ratios show euphoria and higher risk.
9. Trend Confirmation
Rising put-call ratios confirm bearish momentum. Falling ratios confirm bullish momentum. This provides robust trend trade signals.
10. Predicts Volatility Changes
Spikes in the ratio flag an uptick in volatility. Declining ratios predict decreasing volatility. This creates volatile trade opportunities.
11. Sentiment Insights
The ratio reveals whether traders are paying more for protection or upside speculation. This gauge shifts in fear, greed, and expectations.
12. Uncovers Overcrowded Trades
Extremely high or low put-call ratios expose overly crowded sentiment that is ready to reverse. This allows traders to profitably fade lopsided positioning.
13. Market Breadth Data
Comparing put-call ratios across indexes, stocks, and sectors shows the breadth of sentiment.
The put-call ratio, in its various forms, offers traders diverse advantages in identifying high-probability opportunities, planning risk management, confirming trends, anticipating volatility, and profiting from extremes in investor psychology. It is a robust standalone indicator but is even more powerful when integrated into a complete trading strategy.
What are the Disadvantages of Using the Put-Call Ratio as an Indicator?
The main disadvantages of using the put-call ratio as an indicator are that it sometimes produces noisy false signals, lacks defined overbought/oversold levels, provides lagging rather than leading signals, conflicts with momentum, is prone to volatility shocks, and requires confirming indicators to avoid whipsaws.
1.Noise in Raw Data
The daily put-call ratio oscillates rapidly and sometimes generates false signals. Smoothing with moving averages is required to filter the noise.
2. Not a Timing Indicator Alone
The ratio identifies potential turning points, but other indicators should confirm entries and exits.
3. No Clear Thresholds
There are no universally accepted overbought or oversold levels. Traders must determine extreme zones subjectively or through backtesting.
4. Lagging Confirmation
The put-call ratio tends to confirm turns rather than lead them. It should be used with leading indicators.
5. Conflicting Interpretation
High put-call ratios sometimes signal excessive pessimism and capitulation but also justify bearish momentum.
6. Vulnerable to Shocks
Sudden volatility spikes from news events generate extreme one-off readings that do not signal sustainable turns.
7. No Signal Direction
The indicator does not define market direction by itself. It must be combined with price action analysis.
8. Hard to Track Precisely
Exchanges do not fully report put and call volumes, so ratios rely on incomplete data.
9. Sophisticated Analysis Required
Using raw put-call ratios often fails. Success requires advanced interpretations and combinations.
10. No Insight on Magnitude
The indicator does not reveal how large a subsequent move sometimes is, only the likelihood of a reversal.
11. False Breakouts
The crowd is often right near major support and resistance levels when breakouts fail. This negates signals.
12. Unreliable in Ranges
The ratio tends to be seen during trading ranges, generating choppy whipsaws.
13. Weak Without Confirmation
On its own, the put-call ratio easily produces false signals. Confirmation from other indicators is required.
14. Ineffective for Timing Exits
The indicator is more useful for suggesting potential entry points rather than timing profitable exits.
15. Difficult to Implement for Individuals
Retail traders lack sufficient data to calculate precise put-call ratios consistently for reliable signals.
The put-call ratio has disadvantages, including raw data noise, opacity on turn magnitude, vulnerability to shocks, and lagging confirmation. It performs best when combined with price action, momentum indicators, moving average analysis, volume flows, and fundamentals to confirm signals. Experienced interpretation is required to avoid whipsaws.
How Does Put-Call Ratio Become a Bullish Trend?
The put-call ratio becomes a bullish trend indicator when it spikes to extreme highs during a market selloff, reflecting peak pessimism, and then decreases as that excessive put buying is unwound and call buying picks up when the selloff exhausts and the market rebounds.
A rising PCR is generally considered bearish, and a decreasing PCR is considered bullish. This is because a higher PCR shows more put volume relative to call volume, indicating that more traders are betting on lower prices. In contrast, a falling PCR shows less put volume relative to call volume, indicating more traders are expecting higher prices. However, the PCR also indicates a reversal from a bearish to a bullish trend once it reaches extremely high levels.
First, the PCR will rise sharply as the market declines and more traders buy puts to bet on further downside. The PCR sometimes rises to extremely high levels above 1.5 or even 2.0 if the selloff is capitulatory. This shows an extreme amount of put buying relative to call buying, indicating an overly bearish sentiment. At this point, the excessive put buying often represents a washout of weak hands and pessimistic traders during the selloff. With so many bearish put positions in place, the PCR is poised to fall sharply once the selloff exhausts itself.
As the market stabilises and reverses higher from its lows, the PCR will begin decreasing. With the market moving higher, put options become less valuable. Traders who bought puts start unwinding those positions, either by selling puts or buying calls to hedge. This dynamic causes the volume to decrease relative to call volume. The falling PCR in a potential reversal signifies that market sentiment is becoming less bearish and more optimistic for a rebound. As put positions get unwound, the PCR sometimes falls rapidly back below 1.0. This shows call volume picking up relative to put volume, reflecting the improvement in investor sentiment.
A PCR below 1.0 signifies more bullish expectations, as calls allow traders to benefit from the upside in the market. As the market uptrend gains momentum, the PCR falls to very low levels, around 0.5 or 0.6. This reflects heavy call buying as traders turn bullish and expect additional gains. Therefore, a spike to extreme highs in the PCR during a selloff, followed by a rapid decline, marks a bullish trend reversal. The extreme put buying represents a washing out of weak lungs. As the market rebounds, the PCR falls as those bearish puts get unwound and more optimistic call buying picks up. This bullish turn in the PCR reflects improving sentiment.
How Does Put-Call Ratio Become a Bearish Trend?
The put-call ratio becomes a bearish trend indicator when it remains at extremely low levels during an extended rally, reflecting peak complacency, and then rises as that excessive call buying is unwound and put volume picks up when the rally tops out and the market declines.
A rising PCR is generally considered bearish, while a decreasing PCR is considered bullish. This is because a higher PCR indicates greater put option trading volume compared to call volume, signalling that more traders are betting on lower prices. In contrast, a declining PCR reflects less put volume relative to call volume, suggesting traders expect prices to rise.
However, the PCR also signals a reversal from a bullish to a bearish trend when it falls to extremely low levels. First, as the market rallies, the PCR will decline as more traders buy calls to benefit from rising prices. In a euphoric advance, the PCR sometimes sinks to very low levels below 0.5, driven by heavy call buying and a lack of put positions. This reflects an overly bullish outlook, with excessive call buying indicating complacency. Eventually, the extreme optimism will reach an unsustainable peak. As the rally stalls, the low PCR levels start to rebound higher. With the market topping out, traders begin unwinding bullish call positions, causing call volume to decrease. Some start opening put trades to speculate on a downward move.
This increase in put volume relative to call volume causes the PCR to rise from its extremely depressed levels. The climbing PCR in a potential market top signifies that sentiment is becoming less bullish and more cautious. As optimism wanes, the PCR sometimes surges back above 1.0 and continues higher. A PCR climbing back above 1.0 indicates growing pessimism, as puts allow traders to benefit from market declines. As the downtrend accelerates, the PCR sometimes rises to extremes above 1.5 or 2.0, driven by heavy put buying and a lack of call positions. This reflects bearish expectations taking hold.
The PCR remaining at unsustainably low levels below 0.5 during an extended rally, followed by a spike higher, marks a trend reversal from bullish to bearish. The previously low PCR reflected excessive optimism and complacency. As the market tops out, the PCR rises as bullish calls are covered, and bearish puts are opened. This turn in the PCR shows sentiment worsening, and a bearish trend is likely underway.
How to Use Put-Call Ratio as Indicator for Trading?
The put-call ratio is used as an indicator for trading by identifying sentiment extremes to spot potential overbought or oversold conditions, looking for trend reversals when the ratio reaches peak or trough levels, and combining its signals with analysis of price action and other indicators to properly time entries and exits. The following are five key ways traders effectively utilise the put-call ratio.

1.Identify Overbought/Oversold Conditions
The PCR is used to gauge sentiment extremes and identify overbought or oversold conditions. Readings above 1.0 indicate bearish sentiment, while readings below 1.0 signal bullish sentiment.
During market declines, the PCR will rise as more puts are traded. A high PCR above 1.5 or 2.0 suggests an oversold market with investors excessively pessimistic. This signals a bottom.
In rallies, the PCR will fall as more calls are traded. A low PCR near 0.5 reflects an overbought market with investors who are very bullish, potentially signalling a top.
Traders use extreme PCR levels to enter counter-trend trades or take profits in the direction of the prevailing trend.
2. Spot Trend Reversals
The PCR is also useful for spotting trend reversals. A peak in the PCR above 1.5 after a downtrend marks capitulation and a bullish reversal. As the PCR falls back below 1.0, it confirms upside momentum.
Likewise, a trough below 0.5 after an uptrend signals exhaustion and a bearish reversal ahead. As the PCR rises back above 1.0, it confirms downside momentum.
Traders anticipate and enter trend reversals when the PCR reaches extreme levels and then starts moving in the opposite direction.
3. Compare With Price Action
It is important to combine PCR signals with analysis of price action and other indicators. A high PCR signalling oversold conditions will be more meaningful if it coincides with the market bouncing off support.
Similarly, a low PCR indicating overbought conditions should be validated with price resisting at key resistance levels and other indicators like RSI showing divergence.
Using the PCR with context from price and volume patterns will improve the timing of entries and exits.
4. Understand Limitations
The PCR works best for major trend reversals and identifying extremes in sentiment. Its signals are sometimes early, so they should not be used in isolation.
The PCR also stays at elevated or depressed levels for extended periods during strong bull or bear trends, respectively. Traders should utilise the indicator to gauge sentiment, not as a strict trading system.
5. Adjust Inputs for PCR
Traders tweak the PCR to focus on different option expirations. The standard PCR uses all options. But a PCR weighted to near-term options sometimes provide earlier signals on shifts in sentiment.
Some traders also adjust the formula to compare puts to call volume based on the money involved in the trades rather than raw volume. This seeks to give a more accurate picture of how bullish or bearish traders are.
The put-call ratio is a valuable sentiment indicator for determining investor psychology. By combining its signals with diligent price analysis, traders improve the timing of entries and exits. The PCR is most useful for confirming sentiment extremes and reversals rather than providing absolute buy/sell signals on its own. With the right context, it is a valuable part of a trader’s analytical toolkit.
What is the Best Strategy for Put-Call Ratio?
The best strategy for using the put-call ratio is to incorporate it as a supplementary indicator for confirming price action signals, focusing on extremes and directional changes in the ratio, and customising inputs across multiple time frames to gain an edge in identifying sentiment shifts and market reversals. The PCR is best used in conjunction with price action analysis.
For example, a high PCR reading above 1.5 on its own simply indicates bearish sentiment. However, a high PCR coupled with the market bouncing off a key support level is a much stronger reversal signal. Always confirm PCR signals against the prevailing price trends and levels.
Spotting divergence between the price and the PCR identifies changing momentum. Bullish momentum is flagging if the market is setting new highs, but the PCR is not breaking through new lows. This bearish PCR divergence sometimes suggests a top is forming. The opposite divergence signals a market bottom. The most valuable signals from the PCR occur at extremes. A PCR above 2.0 reflects intense pessimism, while a PCR below 0.5 reflects euphoria. These extreme readings are prone to reversion back to the mean and indicate major trend changes. Avoid acting on minor PCR movements and instead wait for extremes.
A key way PCR signals reversal is when its direction starts changing. For example, after a sustained uptrend, watch for the PCR to bottom out and start ticking higher. This shows bearish momentum gaining traction as the rally stalls.
The actual reversal will be confirmed when the PCR moves back above 1.0. Analyse the PCR across short, medium and long-term time frames. The weekly PCR helps identify lasting sentiment shifts, while the daily PCR provides near-term overbought/oversold readings. Also utilises a 21-day moving average of the PCR to smooth out daily fluctuations.
Traders modify the PCR calculation by weighing near-term options more heavily or analysing the dollars traded rather than raw volume. Adjusting these inputs provides a more nuanced sentiment reading and potentially earlier reversal signals.
How Does Open Interest Related to Put-Call Ratio?
The open interest provides additional context on the overall accumulation of put and call positions over time, complementing the put-call ratio’s analysis of immediate trading volume and sentiment in the options market. The put-call ratio (PCR) compares the trading volume of put options to call options to gauge market sentiment. Open interest provides additional context on the structure of the options market. Analysing open interest trends along with the PCR provides a more complete picture.
Open interest represents the total number of outstanding option contracts that have been opened but not yet closed by an offsetting trade or expiration. It reflects the scale of activity in the options market. For any put or call option, the open interest indicates the number of contracts that exist. Open interest increases when new option positions are created through opening trades. It decreases when existing positions are closed by offsetting trades.
The total put open interest and call open interest metrics show the breadth of activity on the put side and call side, respectively. Comparing put open interest vs call open interest reveals whether more traders currently hold bullish call positions or bearish put positions. While the PCR analyses volume traded, open interest measures the outstanding positions. Volume indicates how much current activity is taking place, and open interest represents the scale of prevailing positions held by options traders. High PCR readings mean greater put volume relative to call volume on a given day. However, the open interest indicates whether there are more significant put or call positions accumulated over time.
For example, heavy put trading sometimes spikes the PCR intraday. However, a persistently high call open interest indicates that overall, more traders are still long calls than puts. This provides helpful context alongside the PCR’s volume activity.
Traders gain valuable additional context by comparing PCR moves to trends in open interest. For example, a rising PCR coupled with increasing open interest shows downside momentum is intensifying with bearish positions accumulating. Meanwhile, a falling PCR, along with rising call open interest, indicates strengthening bullish momentum as more traders build call positions.
A spike in the PCR but steady put open interest suggests only short-term bearish betting versus a lasting shift in sentiment. A low PCR reading accompanied by falling call open interest signals bullish activity is fading as traders exit call positions rather than signalling sustainable optimism. Analysing the PCR and open interest trends in tandem provides clearer insights into whether shifts in sentiment are temporary or lasting.
How Can Volume be Used for Put-Call Equation?
The volume provides additional insights into market participation and intensity of put/call demand, giving context to put-call ratio signals based solely on the relative volume of puts versus calls traded.
The standard put-call ratio (PCR) calculation uses the daily trading volume of put and call options. Analysing volume trends provides additional insights into market sentiment when used in conjunction with the PCR. Volume represents the number of contracts traded during a specified time period. For options, daily volume indicates the total number of put and call contracts that exchanged hands on a trading day. Higher volume reflects more active trading and greater investor interest in the market. Lower volume suggests reduced participation and trading activity.
The conventional PCR simply compares put option volume to call option volume using the ratio as stated below.
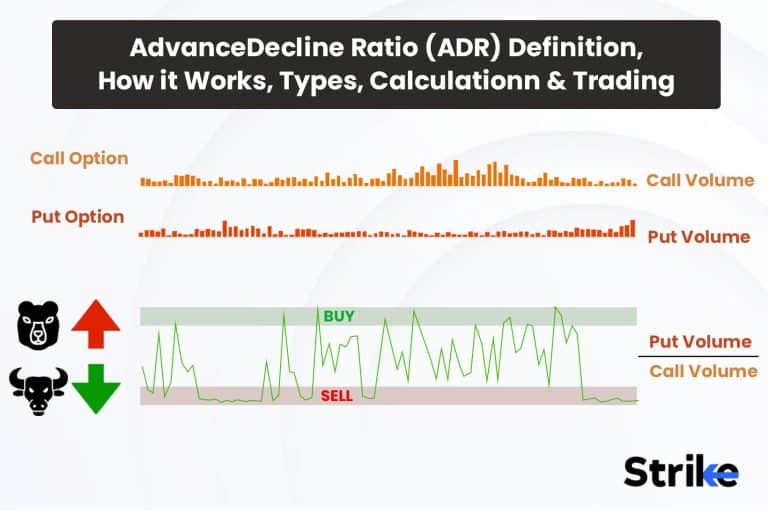
PCR = Put Volume / Call Volume
This gauges whether more put or call options are being traded on a given day. However, analysing the absolute levels of volume provides additional insights. For example, a rising PCR accompanied by increasing put option volume shows strong conviction behind bearish trades. But a rising PCR with declining volume suggests weaker bearishness. Moreover, a spike in PCR on high volume indicates intense downside momentum, while a PCR spike on low volume reflects limited capitulation.
Looking at volume trends alongside the put-call ratio offers valuable additional insights. For example, a high PCR reading coupled with increasing put option volume shows strong downside momentum is building. Meanwhile, a low PCR on rising call option volume reflects growing bullish enthusiasm.
A spike in PCR but on relatively low volume suggests only temporary pessimism rather than full capitulation selling. A sustained high PCR reading but with declining volume points to waning downside momentum as conviction fades. A low PCR that starts to fade on diminishing call option volume hints that bullish momentum is dissipating as well. Analysing PCR moves in the context of volume provides a much clearer picture of the intensity and participation behind the sentiment signals.
An increasing PCR coupled with rising put volume reflects far more intense bearishness than a PCR spike on declining volume. Utilising volume trends alongside the PCR creates a more robust indicator for assessing shifts in market sentiment and participation.
Is the 0.7 Put-Call Ratio Considered a Reasonable Basis for Evaluating Sentiment?
No, the 0.7 put-call ratio level is not considered a reasonable definitive threshold for evaluating overall market sentiment. While PCR readings below 0.7 suggest bullish sentiment, using any static PCR level as the sole basis for assessing sentiment or making trading decisions is not prudent. The put-call ratio fluctuates dynamically based on many factors. Sentiment extremes typically occur at much lower or higher PCR levels than 0.7. A PCR of 0.7 sometimes represents neutral sentiment in some cases but complacency in other instances if it has declined sharply from higher readings.
Rather than focusing on specific PCR values, it is more constructive to analyse the indicator’s trend, momentum, and extremity relative to its own history. For example, assessing whether the PCR is decreasing from an elevated level, tracing out a bottoming pattern, or registering a multi-week/month low provides far more actionable insights than comparing it to 0.7 alone.
Does the Put Option Get the Trader the Right to Sell an Asset at A Preset Price?
Yes, buying a put option gives the trader the right, but not the obligation, to sell the underlying asset at a preset strike price prior to the option’s expiration date. The put option allows the trader to benefit from a fall in the asset’s price. A trader obtains the short sale rights outlined in the put contract by paying a premium when they purchase a put option. This premium is the maximum the trader loses on the trade.
Does It Indicate a Bearish Market If the Traders are Buying More Puts than Calls?
Yes, it usually reflects bearish sentiment and expectations for the market when traders are purchasing more put options than call options. The put-call ratio (PCR) reflects greater demand for puts over calls, and signalling pessimism is taking hold. A rising PCR means that trading volume is outpacing call volume. Since puts gain value when prices fall, increased put buying relative to calls suggests traders expect further declines ahead. They are using more puts to bet on or protect against downward moves.
Is it Right to Use the Call Option to Buy an Asset at a Preset Price?
Yes, buying a call option gives the trader the right, but not the obligation, to buy the underlying asset at a preset strike price prior to the option’s expiration date. The call option allows the trader to benefit from a rise in the asset’s price. A trader obtains the conditional long position specified in the call contract by paying a premium when they purchases a call option. This premium is the maximum the trader loses on the trade. By owning the call, the trader gains upside exposure in case the asset’s market price rises above the strike price. Instead of buying the asset directly, the trader exercises the call option to purchase the asset at the lower strike level.


 Previous Article


![15 Investing.com Alternatives [Free+Paid] You Should Use in 2026](https://www.strike.money/wp-content/uploads/2026/04/Investing.com-Alternatives.jpg "15 Investing.com Alternatives [Free+Paid] You Should Use in 2026 40")
![15 TradeStation Alternatives [Free+Paid] You Should Use in 2026](https://www.strike.money/wp-content/uploads/2026/04/TradeStation-Alternatives.jpg "15 TradeStation Alternatives [Free+Paid] You Should Use in 2026 41")
![15 Chartink Alternatives [Free+Paid] You Should Use in 2026](https://www.strike.money/wp-content/uploads/2026/04/Chartlink-Alternatives.jpg "15 Chartink Alternatives [Free+Paid] You Should Use in 2026 42")
: Overview, 10 Types of Indicators, Settings for Different Markets 44")

 : Definition, Formula, calculation, Uses, Advantages Vs limitations 46")


No Comments Yet.