The advance/decline (A/D) ratio is a technical indicator used to determine if buyers are outnumbering sellers in the overall market. The advance/decline (A/D) ratio compares the number of advancing and declining stocks across an entire exchange each day. A rising A/D line implies buying pressure is dominant, while a falling line suggests sellers are gaining control.
The A/D ratio is calculated by taking the number of advancing stocks and dividing it by the number of declining stocks. This generates a simple numeric value that can be graphed as a line or smoothed with a moving average. There are also volume-weighted versions that factor each stock’s intraday trading volumes into the calculations. Daily, weekly and monthly A/D ratios are commonly examined.
Traders watch for divergences between the A/D line and market indexes as valid signals. A rising market coupled with a declining A/D line implies gains are weak and concentrated in fewer stocks – a potential warning sign. Peak ratios can also mark tops, while oversold bottoms present opportunities. The A/D provides a broad view of overall participation that complements individual stock analysis. It helps measure the health of bullish sentiment by measuring breadth of demand at all price levels.
The A/D ratio gives insight beyond price movements alone. Monitoring its trends and historically significant crossovers against major benchmarks provides context on underlying market structure shifts. It acts as a useful secondary confirmation tool in technical trading decisions.
What is Advance/Decline Ratio (ADR)?
Advance/Decline Ratio (ADR) is a technical analysis indicator that measures the number of advancing stocks versus the number of declining stocks over a given period. Advance/Decline Ratio (ADR) is calculated by dividing the number of advancing stocks by the number of declining stocks. The advance/decline ratio, often simply called the A/D ratio or A/D line, provides insight into the overall direction and strength of the broader market.
The A/D ratio is constructed using data on the number of advancing and declining stocks on a given exchange, most commonly the Nifty 50. An advancing stock is one whose price has gone up over the specified period, usually a single trading day. A declining stock has seen its price go down over that period. The raw advance/decline data is compiled each day for the Nifty 50 by the stock exchange itself.
The A/D ratio is then calculated by taking the number of advancing stocks and dividing it by the number of declining stocks. For instance, the A/D ratio would be 1,500/1,000 = 1.5 if 1,500 stocks increased and 1,000 stocks decreased on a particular day. Strength is implied when the advancer to decliner ratio is greater than 1. A ratio below 1 signals there were more decliners, pointing to weakness.
The advance/decline (A/D) ratio indicates market breadth and momentum. A ratio above 1 signals bullish breadth with more advancers than decliners. A ratio below 1 indicates bearish breadth with more decliners than advancers.
A higher A/D ratio means a larger number of stocks are participating in the upward move. This shows broad market strength across many stocks and sectors. Conversely, a low A/D ratio indicates the advance is narrow and concentrated in fewer stocks, with many stocks lagging behind.
The A/D ratio is seen as a broad market indicator of the overall health of stocks. It confirms or casts doubt on the sustainability and scope of a market move. A/D ratios below one, for instance, suggest that a smaller number of stocks are driving the rally and sometimes do not accurately reflect a general uptrend in the market when the Nifty 50 rises.
In addition to the raw A/D ratio, technical analysts also track the advance/decline line or cumulative A/D line. This plots a running cumulative total of the daily A/D ratios, showing the net shifts between advancers and decliners over time. The slope of this line measures the net breadth and conviction behind an advance or selloff. The chart uploaded below showcases the Advance Decline line for Nifty 50. One can observe, whenever the index touched high’s the advance decline line also touched highs. The line retraced when the broader market corrected.
: Definition, How it Works, Types, Calculation, and Trading 16")
How does the Advance/Decline Ratio (ADR) work?
The advance/decline ratio (ADR) works by tracking the number of advancing and declining stocks over a specified period to quantify the breadth of participation in a market move. The ratio acts as a technical indicator that provides insights into the internals of the market and measures the conviction behind a rally or selloff.
The ratio quantifies the raw market internals into an easy to interpret oscillator fluctuating above and below 1. Charting the daily ADR over time produces the advance/decline line, which provides a visualization of the ebb and flow between advancers and decliners.
A rising ADR and advance/decline line indicates upside momentum is broadening out across many stocks and sectors. This supports the sustainability of an uptrend. The ADR sometimes indicates waning participation and a possible trend reversal if it begins to make lower highs while the underlying index keeps rising.
On the other hand, a declining ADR coupled with a falling advance/decline line signals downside momentum is expanding amid deteriorating breadth. This warns of broader capitulation beneath the surface. The ADR indicates growing participation and signals a shift in trend if it bottoms and rises ahead of the main indexes.
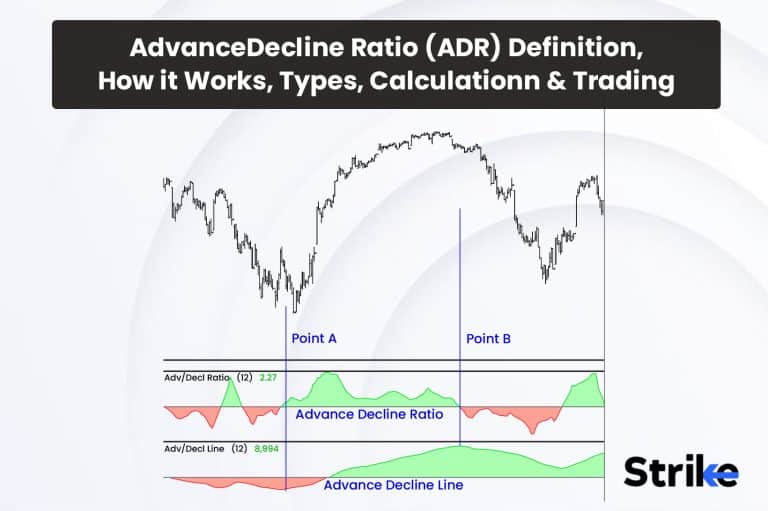
Traders keep close watch on the ADR when an index is approaching key support or resistance levels. A high ADR backing the breakout across a pivotal technical level shows conviction among market participants. But a faltering ADR warns that the move might fail at resistance as breadth narrows. In the chart uploaded below, one can observe how the price and AD line react to each other. The black horizontal drawn on indicator indicates 1. Observe how the AD line bounces from the 1 level respectively. On the left side, when it slipped below 1, markets corrected significantly towards downside. The AD line sustained and kept fluctuating between mark 1 to finally break above 1 to cause the price to start pushing ahead as shown in the chart below.
: Definition, How it Works, Types, Calculation, and Trading 17")
What is the importance of the Advance/Decline Ratio (ADR) in Technical Analysis?
The advance/decline ratio is important because it allows traders to gauge whether a market advance or selloff is being driven by many stocks across sectors or if it is narrow and concentrated. This helps determine the sustainability and overall health of a trend. A rally underpinned by strong breadth is more likely to continue than a rally lacking broad participation. Breadth Momentum, Divergence, and Confirmation are the three particularly significant technical analysis perspectives that the ADR offers.
The ADR quantifies the number of advancing stocks versus declining stocks into a simple bounded metric oscillating around 1. This captures the back-and-forth momentum between bullish and bearish breadth in the market internals. The higher the ADR, the stronger the upside momentum, and vice versa for low ADR readings. Tracking ADR trends helps traders identify building or waning momentum before price charts confirm.
What is the primary use of the Advance/Decline Ratio (ADR)?
The primary use of the advance/decline ratio (ADR) is determining overall market breadth and momentum. The ADR serves as a technical indicator that provides insights into the strength or weakness across a stock exchange, most commonly the NIFTY 50. The ADR allows traders to evaluate if an advance or sell-off in an index, like the, NIFTY 50 has broad participation or is being driven by a narrow group of stocks.
traders primarily leverage the ADR to evaluate the market’s internal momentum, assess participation, confirm price breaks, spot capitulation risks, and identify ranges.
What are the two types of Advance/Decline Ratio (ADR)s?
There are two main ADR metrics – the daily ADR ratio and the cumulative advance/decline line. The daily ADR examines the ratio of advancing to declining stocks each day to gauge momentum. The cumulative A/D line tracks the ongoing sum of daily ADRs to visualize the prevailing trend, smoothing out daily spikes while revealing the broader momentum. Traders analyze both the current day’s ADR as well as the advancing or declining cumulative line to assess results and calculate the ratio based on the trend.
1. By Examining the Results of The Advance/Decline Ratio (ADR)
Examining the ADR results provides insights into the strength or weakness across a stock exchange.
The ADR is calculated by dividing the number of advancing stocks by the number of declining stocks on a given exchange for a specified period, usually daily.
For instance, the ADR would be as follows if 350 stocks increased and 150 declined on a given day on the NYSE.
ADR = Advancing Stocks / Declining Stocks
= 350 / 150
= 2.33
An ADR above 1 indicates bullish breadth with more advancers than decliners. An ADR below 1 signals bearish breadth with more decliners.
Traders closely monitor metrics such as the absolute ratio level, volume for conviction, divergence from index trends, crossovers of the critical 1.0 threshold, smoothed moving average trend, and extremes indicating exhaustion when analyzing ADR results. Specifically, they focus on higher readings above 1 showing bullish momentum versus low sub-1 levels indicating bearish momentum. Crossovers above or below 1 highlight shifts in breadth bias. Divergence warns of reversals ahead when ADR and index trends disconnect.
The trend of moving averages reveals accelerating or declining breadth momentum over time. Extreme spikes above 2.0 or below 0.5 often mark trend exhaustions. Comparing volume also shows conviction, with rising volume confirming the momentum signaled by high ADR readings. Tracking these multiple factors provides a comprehensive overview of market internals.
The ADR quantifies the back and forth between bullish and bearish breadth. Rising ADR trends reflect widening upside participation. Declining ADR trends indicate downward momentum is expanding.
ADR crosses above 1.0 signal a bullish shift as advancers outpace decliners. This supports trend reversals from declines to new uptrends.
Conversely, ADR crosses below 1.0 flag a bearish shift in participation. This contributes to market tops and reversals from rallies to new downtrends.
The ADR differs from indexes as it measures internals across many stocks while indexes focus on major large-caps. The ADR sometimes diverges from indexes when internals shift before prices. Also, indexes have an upside bias over time but ADR oscillates based on participation. Finally, the ADR shows diffusion across sectors unlike indexes that summarize the overall market.
Analyzing ADR results provides traders with a valuable perspective into market psychology, momentum, and participation. It serves as a complementary tool to index price action for assessing the sustainability of trends.
2. Calculate the Advance/Decline Ratio (ADR) Based on A Trend
Calculating the ADR based on the trend provides insights into momentum and participation.
The ADR is calculated by dividing the number of advancing stocks by the declining stocks on a specified exchange for a set period, typically daily.
ADR = Advancing stocks / Declining stocks
An ADR above 1 indicates bullish breadth, while a reading below 1 signals bearish breadth.
The following should be carefully considered by traders when calculating the ADR based on the current trend: Divergence between ADR and index price trends suggests reversals ahead; rising and falling ADR patterns indicate momentum; overbought readings above 2 or oversold readings below 0.5 that indicate exhaustion points.
traders also watch for successive readings above 1 signaling expanding upside momentum in uptrends, sustained sub-1 levels showing accelerating downside momentum in downtrends, and volume trends confirming the momentum. Moving averages help smooth the ADR to reveal the prevailing trend’s strength or weakness. Tracking these dynamics provides crucial insights into market psychology and participation.
In uptrends, the ADR oscillates above 1.0 with periodic spikes above short-term moving averages, reflecting sustained bullish momentum. Traders look for the ADR to make higher highs confirming broadening participation.
In downtrends, the ADR remains depressed below 1.0 with frequent spikes below short-term moving averages. This shows bearish momentum expanding. Lower lows in the ADR confirm waning participation.
Unlike indexes which just reflect prices, the ADR provides insights into underlying momentum and participation trends. The ADR measures diffusion across many stocks while indexes are distorted by a few large stocks. Index uptrends continue even as ADRs decline pointing to waning momentum. ADR extremes signal overbought or oversold conditions leading to trend reversals despite ongoing price trends.
Calculating the advance/decline ratio based on existing trends provides traders an additional perspective on the market’s backbone and momentum. Examining divergence from index trends offers clues on pending reversals in market psychology.
How to Calculate the Advance/Decline Ratio (ADR)?
The advance/decline ratio (ADR) is calculated by dividing the number of advancing stocks by the number of declining stocks over a specified period. Follow the below mentioned steps to calculate the daily advance/decline ratio.
1. Identify the Market and Time Frame
First, determine which stock market exchange you want to analyze, such as the NIFTY 50 or BANKNIFTY INDICES. Also set the time period – the standard is to calculate a daily ADR based on each trading day. Intraday or weekly ADRs are also used.
2. Obtain Advancing and Declining Stock Data
Next, gather the number of advancing and declining stocks for the selected market and time period. Platforms like Strike.money provide daily advancing/declining data for major indexes. The image uploaded below reveals how strike.money scans and provides the advance decline numbers for major and minor indices on a day to day basis.
: Definition, How it Works, Types, Calculation, and Trading 18")
Alternatively, download a list of stocks and filter for those up or down each day.
3. Count the Number of Advancing Stocks
Analyze the data and count the total number of individual stocks that closed higher for the session. These are considered advancing stocks.
4. Count the Number of Declining Stocks
Similarly, count the total number of individual stocks that closed lower for the period. These are considered declining stocks.
5. Insert Data into ADR Formula
The standard formula to calculate the advance/decline ratio is:
ADR = Number of Advancing Stocks / Number of Declining Stocks
Plug the advancing and declining stock totals for the market and time period into the formula.
6. Calculate the Ratio
Divide the number of advancing stocks by the number of declining stocks to quantify the day’s ADR reading.
7. Analyze the ADR Results
An ADR above 1 indicates bullish breadth, while a reading below 1 signals bearish breadth. The higher the ratio, the more bullish the internals. Monitor ADR trends over time and compare to price action.
8. Smooth with Moving Averages
Plot the daily ADR on a chart and apply moving averages to identify the prevailing trend. The 50-day and 200-day simple moving averages are commonly used to analyze the smoothed ADR.
Following these steps allows you to calculate the advance/decline ratio for assessing market internals, breadth momentum, and participation. Comparing the ADR to price charts provides insights into the strength of trends and potential reversals. Consistently apply the formula to make meaningful comparisons over time.
How to interpret the Advance/Decline Ratio (ADR)?
In order to assess market breadth and participation, traders interpret the advance/decline ratio (ADR) by looking at its level, trends, extremes, volume, and relationship to price action.
Focus on the absolute ratio level relative to the key 1.0 threshold. Readings above 1.0 indicate bullish breadth with more advancers than decliners. The higher the reading, the stronger the upside participation. Readings below 1.0 signal bearish internals with more decliners than advancers. Lower readings under 0.5 often occur near market bottoms.
Analyze the ADR trend using moving averages. The 50-day and 200-day simple moving averages define the prevailing trend. The ADR crossing above its moving averages signals accelerating upside momentum. Crossing below turns the trends bearish and marks deteriorating breadth.
Watch for extremes and spikes in the ADR, especially readings above 2.0 or near 0. These signal overbought or oversold conditions respectively. Excessive bullish or bearish breadth reflects exhaustion that sometimes reverses trends.
Compare ADR peaks and troughs to identify support and resistance. These indicate key levels where advances or declines meet supply and demand. Trendlines also highlight changes in momentum.
Assess the ADR’s relationship to price trends. Weakness in the ADR while indexes make new highs reflects negative divergence. This bearish disconnect between internals and prices warns of a pending correction.
Look for ADR peaks and troughs to potentially precede reversals in the index. Broad internal weakness ahead of prices turning signals early signs of trend exhaustion. The ADR leads to price peaks or bottoms.
No single indicator provides the full picture. But tracking ADR trends over time, in the context of price action, provides valuable insights into overall market psychology and the likely sustainability of emerging trends.
The advance/decline ratio chart condenses the complex interplay between advancing and declining stocks into a bounded oscillator. Analyzing the ADR ratio levels, directional trends, volume-backed conviction, and divergence setups allows traders to assess internal momentum and recognize shifts in participation.
What are the advantages of the Advance/Decline Ratio (ADR)?
The Advance/Decline Ratio (ADR) is advantageous as it acts as a barometer for market breadth, confirms price trend divergences, distinguishes bull vs bear markets, gauges sector participation, and identifies sentiment extremes.
- Breath of Market Indicator
One of the main benefits of the ADR is that it provides a broad look at market breadth and participation. By analyzing the ratio of advancers to decliners across the entire market, the ADR acts as a barometer of overall market strength or weakness. An increasing ADR indicates that a larger percentage of stocks are rising as opposed to falling, which suggests that the market is moving broadly upward. Conversely, a falling ADR implies wider market weakness as more stocks decline than advance.
- Confirms Price Trends
The ADR is useful for confirming the direction of major indexes and price trends. The fact that both the NIFTY 50 and the ADR are rising and setting new highs indicates that the uptrend is robust and widespread. However, divergence between the ADR and major indexes sometimes signals a warning. A narrow rally and potential weakening of market momentum are indicated, for instance, if the NIFTY 50 makes a new high but the ADR is unable to reach a new peak.
The ADR sometimes continues rising or falling ahead of reversals in the overall market too. A declining ADR indicates a potentially impending market top and worsening market breadth when the NIFTY 50 continues to trend higher. The reverse is true at market bottoms when the ADR bottoms out and diverges positively before major indexes reverse into an uptrend.
- Determining Bull vs. Bear Markets
The ADR is a useful tool for distinguishing between bull and bear markets. In a healthy bull market, the ADR will be in a clear uptrend as the majority of stocks advance in a rising market. The ADR will generally reach higher highs and higher lows as breadth expands in bull runs. In contrast, bear markets are characterized by a steady decline in the ADR as more stocks fall than rise during prolonged downtrends. The severity of the bear market is determined by the extent of the ADR’s decline.
- Measure of Market Participation
The ADR highlights the degree of participation across various stock sectors and capitalization groups. Analyzing the ADR for small-cap, mid-cap and large-cap stocks shows which parts of the market are strongest. Comparing the ADR of leading stocks versus lagging stocks also reveals which segments are driving the rally. Strong momentum among small-cap growth and weakness in large-cap value names are indicated if the ADR for small-cap growth stocks is increasing quickly while that of large-cap value stocks is staying flat.
Additionally, investors screen for stocks with high relative strength that are outperforming the market based on rising ADRs. Stocks operating in sectors with strong participation and rising ADRs have momentum on their side. Monitoring ADR trends across different sectors provides insight into market leadership.
- Gauges Investor Sentiment
The ADR has potential benefits for contrarian investors and traders looking to gauge market sentiment. Sentiment is considered overly bullish when the NIFTY 50 and ADR are hitting excessive peaks. Sentiment sometimes becomes too bearish after a market decline when the ADR reaches extreme lows. These conditions signal potential contrarian entry points. The ADR might indicate a bottoming reversal point if it drops to historically low levels that signify widespread capitulation.
The ADR also identifies sentiment divergences. Bullish sentiment is waning even as prices rise if the NIFTY 50 is setting new highs but ADR peaks are falling. At temporary lows, huge spikes in the ADR flag overly bearish sentiment. Tracking investor emotions through ADR extremes uncovers sentiment-driven turning points.
Combining ADR signals with other technical indicators improves timing of long and short entries for investors seeking an edge in assessing broad market strength and weakness. The ADR has stood the test of time as a reliable technical tool for confirming price moves, identifying reversals, and detecting shifts between greed and fear in the market.
What are the disadvantages of the Advance/Decline Ratio (ADR)?
The Advance/Decline Ratio (ADR) has key limitations including lack of volume weighting, oversensitivity to small caps and volatility, no universal overbought/oversold thresholds, and daily resets that obscure developing multi-session trends.
- No Universal Thresholds
One of the biggest drawbacks of the ADR is that there are no absolute or universal overbought/oversold thresholds. The range of values for the ADR varies widely depending on market conditions. Readings that sometimes signal extremes in a bull or bear phase seem more mundane during periods of consolidation and contraction in participation. Traders must rely more on identifying relative highs and lows rather than fixed numeric cutoffs. The lack of defined extremes makes the indicator more subjective.
- No Volume Weighting
A key weakness of the ADR is that it treats all advancing and declining stocks equally, regardless of the volume traded. The underlying data for the ADR simply looks at the number of gainers versus losers, not taking into account volume transacted. So a low float stock that rises on miniscule volume has the same influence as a heavy-weight stock surging on huge volume. Not incorporating volume sometimes misconstrues the amount of conviction behind price movements.
- Prone to Noise and Volatility
Because the ADR incorporates broad-based signals across thousands of stocks, it is susceptible to intraday noise, volatility and erratic moves. The high-frequency inputs cause the ADR to swing rapidly from hour to hour, especially during volatile markets. Traders focusing on daily or weekly charts are less impacted, but those looking at intraday time frames face more whipsaws. The abundance of inputs makes the ADR better suited for identifying long-term trends rather than short-term oscillations.
- Skewed by Small Caps
Since the raw ADR tallies advancing and declining stocks equally, small capitalization stocks with limited liquidity skew the reading and produce false signals. For example, a rally in microcap stocks on low volume could send the ADR surging, even if large-cap indexes are weak. The outsized influence of penny stocks is a distortion risk, whereas market cap weighted indexes better represent broader trading activity and values.
- Reset Each Trading Session
The standard ADR measure resets at the beginning of each new trading session, giving an incomplete perspective. Investors are often interested in multi-session trends, but the ADR reading only spans a single day or week. Resets sometimes mask developing issues beneath the surface or exaggerate one-day anomalies. Traders prefer to analyse long-term ADR charts over multiple weeks to better identify enduring shifts in participation.
- No Distinction in Magnitude
The basic ADR treats all advancing and declining stocks equally. But in reality, the magnitude of price movements varies greatly. A stock gaining 0.5% has the same influence as a stock rising 5% even though their implications are quite different. Not delineating the magnitude of gains and losses fails to account for divergences in performance. Weighted readings based on percent changes would offer more insight.
- Difficult Analysis at Extremes
Analysis of the ADR becomes ambiguous at significant price extremes. As indexes hit major highs or lows, the ADR is prone to spike dramatically since the benchmark is resetting to a new reference point. It’s unclear whether these extreme highs or lows in the ADR are driven by sentiment, valuations or merely mathematical resets as the market shifts to a new range. The signal becomes fuzzier at historic tops or bottoms.
- Not a Market Timing Tool
The ADR is inefficient as a standalone tool for timing entries and exits. Analysis is best combined with price charts and other technical indicators to improve accuracy. Divergences between ADR and price trends are most telling. The ADR also offers little insight into duration of moves and tends to top or bottom well before the market reverses course. Traders should beware of over extrapolating timing signals from ADR extremes alone.
- Sector Trends Distortions
The overall ADR is skewed higher even though participation is decreasing in other sectors if a large sector, such as technology or energy, is showing strong internal momentum. For example, a big rally in FANG stocks could mask weakness developing under the surface in financial and transportation stocks. The aggregated ADR reading blends these signals together, whereas analyzing ADR by sector provides better insights.
- Vulnerable to Market Volatility
The ADR tends to spike during periods of high volatility regardless of bullish or bearish implications. Volatility increases the dispersion of returns across stocks, naturally inflating advancing and declining counts. But volatility-driven ADR moves sometimes briefly misrepresent conviction, especially if volatility subsequently subsides. Traders should account for volatility effects embedded within ADR trends.
The ADR is best coupled with other indicators when fine-tuning entry and exit timing rather than relied upon as a sole source of market insight. Despite drawbacks, the ADR remains an insightful macro gauge of investor participation and conviction across the stock market landscape.
How is the Advance/Decline Ratio (ADR) Used in Stock Market Trading?
The Advance/Decline Ratio (ADR) is used by traders to confirm market trend direction, identify sentiment extremes, characterize bull/bear markets, detect sector leadership rotations, screen momentum stocks, and spot potential topping or bottoming turning points.
One of the main applications of the ADR is to confirm the strength and direction of the current market trend. The ADR rising in tandem with the NIFTY 50’s uptrend, for instance, is compelling evidence that the bull move is broad-based and not driven solely by a few large-cap stocks. Traders look for the ADR to mirror the direction of major indexes to ensure the trend has wide participation across sectors and capitalizations. Divergence between the ADR and price trends signal underlying weakness and an impending trend reversal.
The ADR is used to determine overbought and oversold conditions driven by investor sentiment. Readings above 2.0 or 3.0 sometimes flag excessive bullishness, while readings below 0.7 or 0.5 sometimes indicate bearish capitulation. However, there are no fixed thresholds, so identifying relative sentiment extremes is more useful. A historically high level of ADR is a warning sign of potentially unsustainable euphoria and greed. Oversold spikes likely reflect peak fear and panic selling. Contrarians often look for extreme ADR readings to fade sentiment and bet on reversions.
Analyzing the trend of the ADR over long timeframes helps characterize bull and bear markets. Sustained rising ADR signals broad participation consistent with bull runs, while steadily falling ADR reflects bearish contraction in stocks advancing. The larger the ADR peaks and troughs, the stronger the bull or bear conviction. A bear market is in its early stages when the ADR exhibits a distinct downward trend, several months after the market index peaks. The ADR tends to top out before major market peaks as well.
Looking at ADR trends by sector provides insight into market leadership and rotations. Technology stocks indicate a bullish risk appetite that favours growth if their ADR figures are strong while utilities are flat or declining. Weakness in small-cap ADR versus large-cap ADR indicates a shift toward safety. Analysts use sector ADR trends to position in leading groups and avoid laggards. The ADR identifies which industry groups have the best momentum.
Traders will screen for stocks with strong relative strength and rising ADRs within their industry group or sector. Stocks outperforming peers that also exhibit positive ADR trends have robust underlying momentum. It combines absolute and relative price strength with broad technical confirmation. Conversely, falling ADR trends help avoid stocks within weakening industry groups prone to underperformance. The ADR provides useful inputs for momentum algorithms.
Extreme spikes in the ADR at market bottoms or sudden ADR collapses at bull market peaks aid in identifying major turning points. The rapid ADR spike off the 2009 bottom provided an early signal of the new bull trend, while the peak in the ADR months before the 2020 Covid crash reflected internal weakness. Traders take special note when ADR signals diverge from new highs or lows in price. However, the ADR is not a precise timing indicator and other measures like volume and volatility should be incorporated.
What is the best trading strategy for the Advance/Decline Ratio (ADR)?
The best ADR trading strategy is to use contrarian signals at sentiment extremes of euphoria or panic to fade the market, betting on imminent reversals and benefiting from the profitable mispricing at emotional tops and bottoms.
The ADR tends to spike at emotionally-driven extremes as greed and fear reach unsustainable levels that detach from fundamentals. Readings above 3.0 or below 0.5, especially lasting for multiple days, suggest distorted sentiment. These extremes indicate potential market mispricing as emotions overshoot rational valuations. Fading extremes aim to profit when prices reconnect with reality. The further the stretch, the more violent the snap back toward fair value.
The ADR frequently tops out months before the final bull market highs as internals weaken before prices peak. At bottoms, panic selling capitulates well before the ultimate low as late longs dump positions. This lagging nature of the ADR provides an early change in character signaling major turns ahead. Acting on initial ADR warnings provides superior timing.
Unlike other sentiment gauges based on opinions and surveys, the ADR has the benefit of objective raw data on actual market activity across thousands of stocks. It measures real revealed behavior, not just spoken sentiment. The quantified inputs remove subjectivity in identifying excesses. Seeing is believing when emotions stretch the limits.
The contrarian viewpoint is typically correct when emotions cause distortions. The crowd is often wrong at extremes. Fading the ADR allows you to take the counterposition when the masses get carried away in one direction. Avoiding consensus and groupthink provides an independent edge to help anchor rationality when others lose composure.
When is the best time to trade using the Advance/Decline Ratio (ADR)?
The most advantageous times to employ the Advance/Decline Ratio (ADR) in trading decisions are at major market turning points when the indicator reaches extremes signaling major tops or bottoms. Trading the ADR at sentiment peaks and troughs provides the highest-probability opportunities. The ADR tends to spike to unsustainable levels at bull market tops when euphoria kicks in and optimism detaches from fundamentals.
Readings surpassing 3.0 or more indicate upside exhaustion. At bear bottoms, the ADR sometimes plunges below 0.5 reflecting capitulation and peak despair. These extremes tend to mark major reversals. The further the stretch from the mean, the more prone prices are to snap back violently in the opposite direction.
Is the Advance/Decline Ratio (ADR) an Effective Indicator?
Yes, the Advance/Decline Ratio is an effective indicator when used to confirm market trends, gauge sentiment extremes, and complement other technical analysis tools as part of a prudent trading approach. The ADR provides unique insights into market internals that aids in profitable trading. The main merits of the ADR are its ability to measure the breadth and participation behind market moves. A rising ADR confirms that an uptrend has wide momentum across many stocks, not just a few heavyweight stocks. This helps determine the sustainability and conviction driving trends. Divergences between the ADR and major indexes signal underlying weakness as well.
Can the Advance/Decline Ratio (ADR) work well with Moving Averages?
Yes, the Advance/Decline Ratio combines well with moving averages to confirm market trends, identify potential extremes, define support/resistance levels, and improve timing of counter-trend trades. The ADR works well with MAs because they are both trend-following indicators that aim to capture directional momentum. A common way traders use moving averages is to identify the current market trend bias. The slope and relationship between shorter and longer term MAs reveals whether the prevailing tendency is upward or downward. Confirmatory evidence of the trend is provided when the ADR is in line with the MA signal.
What is a good Advance/Decline Ratio (ADR)?
There are no definitive “good” or “bad” levels for the Advance/Decline Ratio (ADR) – the most useful analysis focuses on relative extremes, trend direction, momentum, and divergence from price action. The most useful interpretation relies on identifying relative extremes and analysing trends rather than absolute figures.
In bull markets, consistently rising ADR reflects broad participation indicative of a healthy trend. Sustained ADR readings above 1.0 signal the majority of stocks are climbing which supports uptrend durability. Sudden spikes above 2.0 or 3.0 highlight short-term exuberance, while peaks above 4.0 are rarest of all reflecting euphoria. But there are no guarantees even high ADR is sustainable long-term.
In bear markets, ADR falling below 1.0 means declining stocks are outpacing advancers which confirms downside momentum. Readings nearer 0.5 indicate some pessimism, while drops below 0.3 signal severe bearish conviction. Spikes briefly into the 0.1-0.2 range would constitute capitulation selling exhaustion. However, ADR sometimes still trends lower after capitulation periods if bearish forces persist.
Does a ratio greater than 1 in the Advance/Decline Ratio (ADR) suggest a bullish trend?
Yes, it does generally indicate a bullish bias in the market as a whole when the Advance/Decline Ratio is continuously above 1. However, there are some caveats to this interpretation that require further analysis before concluding a bull trend is present or sustainable based solely on the ADR level. The main implication of an ADR above 1 is that the number of advancing stocks exceeds the number of declining stocks that trading day. This indicates buying interest is outpacing selling pressure which contributes to upward momentum. Bulls are in control of the market as a whole, especially if the ADR remains high above 1 for several weeks or months.
Can the Advance/Decline Ratio (ADR) be determined for NSE indices?
Yes, the Advance/Decline Ratio (ADR) is determined separately for the NSE indexes to gauge market breadth specific to these segments. The NSE ADR tracks the ratio between advancing and declining stocks on the NSE (National Stock Exchange) exchange each day. Since the NSE is more heavily weighted toward technology, internet and biotech stocks, its ADR provides a pulse on participation momentum in the growth and risk sectors. Sustained NIFTY 50 ADR readings above 1 signal bullish conviction in these groups.
Meanwhile the NIFTY 50 ADR does the same breadth analysis for stocks listed on the NSE. This broader large-cap oriented exchange is more representative of the overall market and economy. The NIFTY 50 ADR assesses sentiment across value stocks, financials, industrials and other mature sectors. The NIFTY 50 ADR often tops out ahead of market peaks as institutional money exits.


 Previous Article


![15 Investing.com Alternatives [Free+Paid] You Should Use in 2026](https://www.strike.money/wp-content/uploads/2026/04/Investing.com-Alternatives.jpg "15 Investing.com Alternatives [Free+Paid] You Should Use in 2026 22")
![15 TradeStation Alternatives [Free+Paid] You Should Use in 2026](https://www.strike.money/wp-content/uploads/2026/04/TradeStation-Alternatives.jpg "15 TradeStation Alternatives [Free+Paid] You Should Use in 2026 23")
![15 Chartink Alternatives [Free+Paid] You Should Use in 2026](https://www.strike.money/wp-content/uploads/2026/04/Chartlink-Alternatives.jpg "15 Chartink Alternatives [Free+Paid] You Should Use in 2026 24")
: Overview, 10 Types of Indicators, Settings for Different Markets 26")

 : Definition, Formula, calculation, Uses, Advantages Vs limitations 28")


No Comments Yet.