The Parabolic SAR (Stop And Reverse) is a technical indicator used to identify trend direction and spot potential reversals. The Parabolic SAR was developed by J. Wells Wilder in the late 1970s as part of his popular work on technical analysis. The Parabolic SAR functions by plotting “stop and reverse” points that parabolically trail behind the price spikes of an upward move or scoop up dust during a downward advance.
The Parabolic SAR is calculated on a chart by using previous highs and lows over time. It works by establishing a trailing stop-and-reverse point below the recent lows in an uptrend, or above the highs during a downtrend. Each period, the SAR value either stays the same or moves in the direction of the trend a predetermined increment higher or lower. A trend reversal is signaled when the SAR dots change direction, indicating that recent price action has penetrated significant support or resistance.
Some key benefits of the Parabolic SAR include its ability to filter out whipsaws and only signal reversals after strong momentum shifts. It can help traders identify potential trend changes early on. The moving average also plots moving dots that trail the asset price closely during strong trends but backs off more cautiously during range-bound periods. This makes the Parabolic SAR a versatile indicator for analyzing both trending and sideways markets. Its signals can provide valuable trading alerts when used in conjunction with other technical tools.
What is a Parabolic SAR?
Parabolic SAR (SAR stands for “stop and reverse”) is a technical indicator used in analyzing price trends and momentum in securities trading. Parabolic SAR was developed in the 1970s by J. Welles Wilder, who also created other popular trading tools like the Relative Strength Index (RSI) and Average True Range (ATR).
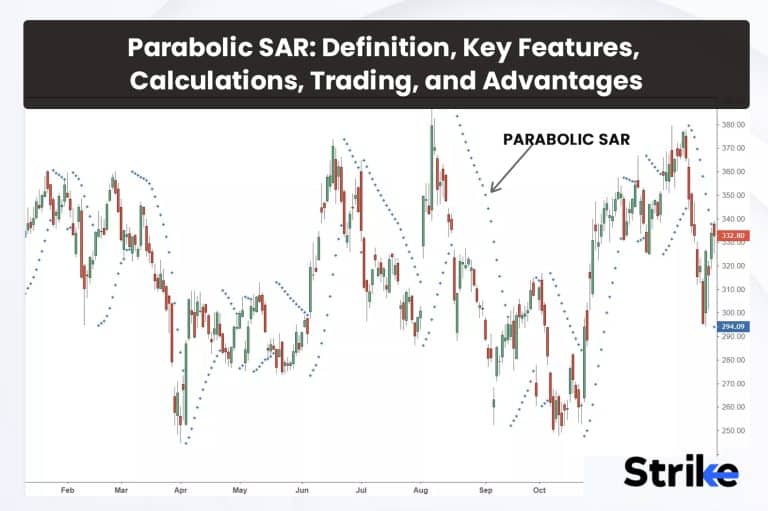
The Parabolic SAR indicator is shown on a price chart as a series of dots, either above or below the price bars. See the image.

The position of the dots indicates the direction of the prevailing trend. An uptrend is indicated when the dots are below the price bars. There is a downward trend indicated when the dots are over the price bars.
The SAR in Parabolic SAR stands for “stop and reverse.” This refers to the indicator’s purpose of identifying potential turning points in the trend. As the price is moving up in an uptrend, the SAR dots will start to appear below the price bars. The SAR indicator will continue to plot new dots further below as long as the uptrend is intact.
However, the SAR dots will begin to converge towards the price bars when the uptrend starts to get exhausted, show signs of weakness and potential change in the momentum. A “stop and reverse” signal is generated by the SAR dots moving all the way up and flipping to above the price bars, suggesting that the uptrend has stopped and maybe that a new decline has started.
The opposite occurs in a downtrend. The SAR dots will initially appear above the price bars, showing the existing downtrend. As the downtrend loses momentum and nears a potential turning point, the SAR dots will start dropping down closer to the prices. The downtrend has ended and a fresh upswing has begun when the dots finally flip below the price bars.
The Parabolic SAR indicator gets its “parabolic” name from the parabolic curve that is used to calculate the placement of the dots. As the price moves further in one direction, the SAR dots accelerate at an exponentially increasing rate in that direction. This creates the “parabolic” effect on the SAR dots’ movement.
The precise calculation behind the Parabolic SAR depends on several key factors. The SAR starting point is set to the lowest price reached at the start of an uptrend, or the highest price reached at the start of a downtrend. The SAR increment is the amount the SAR moves each period – it starts very small but increases exponentially as the trend extends. Each time the price reaches a new high (uptrend) or low (downtrend), that point becomes the new extreme point.
The acceleration factor governs how fast the SAR increment increases – a higher value means the SAR dots will move faster, with the default being 0.02. Finally, the maximum increment puts a cap on how large the SAR increment gets, preventing the dots from moving unreasonably fast. The default maximum increment is 0.2.
Based on these factors, the Parabolic SAR calculation steps through each period to identify the SAR value.
It starts with the initial SAR point set at the trend’s beginning. The increment is added to get the new potential SAR value for that period. It sets the SAR to the extreme point after assessing if the new SAR value has flipped to the other side, starting a “stop and reverse.”
Plotting of that dot on the chart indicates that the new SAR value has not switched. In the event that a new extreme point was achieved, that value serves as the starting point for the computation. The increment value is then increased (accelerated) based on the acceleration factor. This sequence repeats for the next period using the updated SAR and increment values. This allows the SAR indicator to accurately reflect trend momentum – the dots accelerate rapidly as the trend extends, but slow down and eventually reverse when the trend shows weakness, signaling a trend change.
Traders apply the Parabolic SAR indicator in a few common ways. It identifies the existing trend direction, with dots below the bars signaling an uptrend and dots above signaling a downtrend. Flipping of the SAR dots from one side of the price to the other helps spot trend reversals.
In an uptrend, traders often set a stop-loss slightly below the SAR dots to exit long positions if the trend starts to reverse, and vice versa for downtrends. Flipping SAR dots also mark good moments for entering positions aligned with the emerging trend.
Additionally, tracking the acceleration of the SAR dots shows accelerating or weakening momentum. The Parabolic SAR is most effective when prices are strongly trending. In choppy or ranging markets with no clear direction, the constant flipping of the SAR dots generates many false signals. Therefore, traders will often apply additional filters or indicators along with the SAR to improve signal accuracy.
How does a Parabolic SAR work?
The Parabolic SAR indicator works by using a parabolic curve to trail prices and pinpoint potential reversals in trend-momentum based on the acceleration and flipping of dots either above or below the price bars.

The SAR indicator appears on a chart as a series of dots, either above or below the price bars depending on the current trend direction. The dots will align below prices when the trend is up, and above prices when the trend is down.
The calculation behind the SAR depends on the interaction between two elements – the SAR price and the Extreme Point. The SAR price is the value projected by the indicator for a potential trend reversal. It starts at the lowest price when entering an uptrend, or highest price when entering a downtrend. From there, the SAR price moves incrementally in the direction of the trend with each new period.
In an uptrend, the SAR price will increase rapidly, accelerating upward towards the current Extreme Point. As long as the uptrend remains intact, the SAR will trail along below the price bars. The SAR price will, however, start to converge in the direction of the price bars if the upward momentum slows A dot reversal, which indicates a possible trend change from up to down, is triggered if the SAR price rises all the way to or beyond the Extreme Point.
This “Stop and Reverse” function gives the indicator its name and allows it to dynamically respond to shifts in trend momentum.

In the chart uploaded above, one can observe how the SAR dots respected the potential trend. The trend was bearish when the SAR dots were above the price and the moment it shifted its position, the new trend began to evolve and an uptrend was established. This is an example of how parabolic SAR can be used by traders to understand potential trading opportunities.
The acceleration of the Parabolic SAR’s movement is controlled by two key parameters – the SAR Step and Acceleration Factor (AF). The SAR Step determines the incremental jumps in the SAR price each period, starting very small but increasing exponentially with each new dot. The AF governs the speed at which the SAR Step increases, with a higher AF making the SAR price accelerate faster as the trend extends.
How to read a Parabolic SAR?
To read a Parabolic SAR, it starts with observing the position of these dots with respect to the candlesticks to identify the direction of the trend. Monitor the distance and acceleration of the dots to measure the strength and momentum of the trend, and watch for dot flips from one side of the price to the other as signals of potential trend reversals.

An upward trend is shown when the SAR dots are below the price bars. A downward trend is indicated when the dots flip to appear above the price bars. The exact positioning and flips of the SAR dots contain important information for traders. In the chart uploaded below, look how the flip of dots reacted to the momentum and direction of the trend towards downside. Potential candlestick patterns and confluences from other indicators could have gathered to solidify a view.

The most basic use of the SAR is identifying the current trend direction. During uptrends, the SAR dots will appear below the price bars. In downtrends, the dots will populate above the bars.
A glance at the SAR dots relative to the price action instantly shows if the trend is up or down. This helps traders orient the analysis and plan trades accordingly.
The distance between the SAR dots and price bars indicates the strength of the trend. Wider spacing shows a strong, healthy trend. As spacing narrows, it suggests the trend is weakening and sometimes ready to reverse. Look at an example attached below.
The flipping of SAR dots from one side of the price to the other signals a potential trend reversal. This “stop and reverse” function is the most important signal from the indicator.
During an uptrend, a SAR flip below the price bars to above them sometimes indicates that sellers are taking over from buyers. The opposite flip above to below occurs in downtrends when upside momentum emerges.
The Parabolic SAR’s dots do not move at a fixed rate. Their speed actually accelerates as a trend gains momentum. Faster acceleration reflects building strength, while decreasing acceleration warns of waning momentum.
Monitoring the rate of change in the SAR’s movement adds an extra dimension to identifying trends and reversals. Sudden changes in dot speed are often precursors to reversals. Beyond just dot flips, the SAR’s interaction with price levels provides additional insight. As the SAR dots approach key support or resistance areas, it signals those levels are being tested.
When the SAR dots move close to each other and the price, that actually is interpreted as a range bound market and the trading opportunities should be avoided in such cases.
The two key inputs that control the SAR’s sensitivity are the Acceleration Factor and Maximum Acceleration. Lowering these settings will slow down the speed and jumps in the SAR. This creates a smoother indicator less prone to whipsaws.
How is Parabolic SAR used in Technical Analysis?
The Parabolic SAR is used in technical analysis to identify trend direction, spot reversals, time entries, place stops, track momentum, assess trend strength, and measure volatility. The most basic use of Parabolic SAR is to quickly identify the direction of the existing price trend. Uptrends are indicated when the SAR dots are below the price bars, while downtrends are signaled when the dots are above the bars.
Strike.money is one of the scanners that has a specific scanner for Parabolic SAR. If a trader wishes to run a scan, one can use the scanner and find stocks based on the new signals generated based on Parabolic SAR. This way, analysis time can be saved and high probability trading setups can be identified. Here is an example of how a scanner looks like:

The scan was processed on a daily time frame and 2 stocks were displayed in the list that shows the most recent flip of SAR dots from being above the candles to below indicating potential trend reversal from bearish side to bullish side.
Strike.money offers traders to run scan for Hourly, Daily, Weekly and Monthly time frames and Bullish or bearish reversal can also be selected based on overall trend of the market.
Traders use the SAR’s position relative to the price action to determine if the market is in an upward or downward cycle. This helps traders orient the rest of their analysis appropriately based on the trend. The unique “stop and reverse” nature of the Parabolic SAR makes it highly useful for spotting potential turning points in the trend. The SAR dots are ending and an uptrend is about to turn into a decline when they move from below to above the price bars. The opposite is true when the SAR flips from above to below the price bars.
These flip signals act as an early warning for traders that the momentum driving the trend is waning and a reversal is imminent. This allows traders to tighten stops or close out existing positions before a reversal is confirmed.

The Parabolic SAR provides objective criteria for trade entry signals. Traders often use SAR flip breakouts in systematic and rules-based trading strategies. The acceleration function of the Parabolic SAR makes it useful for dynamically updating stop-loss levels to lock in profits and limit losses. As the SAR dots accelerate further from the price bars in an uptrend, trailing stops are moved higher alongside the SAR values. This follows the momentum of the trend.
New stop-losses are frequently positioned slightly above the flipped SAR dots to safeguard short trades when a reversal signal is provided and a downtrend develops. The SAR provides objective stop placement without emotional bias. The speed of the SAR dots reveals insights into the momentum behind trends. Faster dot movement shows momentum is accelerating, while slower movement indicates fading momentum. Observing changes in the SAR’s acceleration helps traders gauge shifts in supply and demand throughout a trend’s progression.
What are the key features of Parabolic SAR?
The key features of the Parabolic SAR indicator are its ability to identify trend direction, and spot reversals, provide customizable parameters, generate objective entry/exit signals, track momentum dynamically, place adaptive stops, evaluate trend strength, measure volatility, and visualize directly on the price chart.
The Parabolic SAR indicator clearly identifies the prevailing trend direction. During uptrends, the SAR dots appear below the price bars. In downtrends, the dots sit above the bars. This allows for quick visual recognition of the current trend bias on any timeframe chart. Traders orient their trading approach according to the SAR-defined trend direction.
The Parabolic SAR is designed to detect trend reversals through the “stop and reverse” flipping of the dots. During an upward trend, a flip of the SAR from below to above the price indicates possible weakness and a downturn. The opposite flip, from above to below, occurs when weakness emerges in a downtrend. These SAR flip signals mark opportune moments to close out existing trades or enter new counter-trend positions.
The Parabolic SAR dynamically tracks momentum by adjusting its speed in reaction to accelerating or decelerating trends. Faster SAR movement reflects strengthening momentum, while slowing SAR indicates fading momentum. This dynamic adjustment helps traders visually identify changes in the rate of trend progression.
What is the formula of a Parabolic SAR?
The SAR formula includes two components – the SAR value and the Extreme Point (EP).
The SAR value represents the actual dotted lines that appear on the chart below the price bars in an uptrend and above the bars in a downtrend. It is calculated as stated below.
SAR(current) = SAR(previous) + AF * [EP – SAR(previous)]
Where,
SAR(current) = The current SAR value
SAR(previous) = The SAR value in the previous period
AF = The Acceleration Factor
EP = The Extreme Point
The SAR value starts at the initial low or high when entering a trade. It then steps further away from the price at an accelerating rate as the trend extends.
The Extreme Point is the highest high or lowest low achieved by the price during the current trend. It is constantly updated to the most recent swing high/low. The EP anchors the SAR by providing a reference point for its trailing calculation. As the EP moves further from the price bars, it allows the SAR to accelerate at a faster rate.
The Acceleration Factor controls the speed at which the SAR values step away from the price. It begins at a minimum value and increases by an Increment value at each SAR step. The Increment determines the rate of AF acceleration. Larger Increment values cause quicker acceleration, smaller values slow the acceleration rate.
In order for the AF to gradually start following the new trend when it reverses and a new EP emerges, it is reset to minimal values.
This dynamic acceleration and deceleration in reaction to the trend is what gives the Parabolic SAR its adaptiveness. The values trail quickly during strong trends but react slowly when trends weaken and reversals approach.
How to Calculate a Parabolic SAR?
To calculate a Parabolic SAR, you first identify the initial Extreme Point high or low, enter the initial SAR value, increment the Acceleration Factor, find new Extreme Points, calculate new SAR values using the formula SAR(current) = SAR(previous) + AF * [EP – SAR(previous)], trail stop levels, and reset the AF on reversals. Calculating the Parabolic SAR involves a series of orderly steps to derive the trailing dot values for each period. Follow these instructions to manually generate SAR values.
1. Identify the Initial Extreme Point
The first step is to identify the Extreme Point (EP) that will anchor the initial SAR value. This is done by finding the lowest low for long trades or highest high for short trades at the beginning of the trend.
For an uptrend, take the lowest low over the observation periods leading up to trade entry. For downtrends, take the highest high.
2. Enter Initial SAR Value
Once the initial EP is found, the initial SAR value is entered. For long trades in an uptrend, this will be the EP low point. For short trades in a downtrend, it will be the EP high.
3. Calculate the AF Increment
The Acceleration Factor (AF) increments at each step to gradually accelerate the SAR values. Determine the increment amount based on the chosen parameters. Common increments are 0.02, 0.04 or 0.06.
4. Add Increment to AF
Starting with the AF minimum (e.g. 0.02), add the increment to increase the AF value (e.g. 0.02 + 0.04 = 0.06). The increment is added at each step.
5. Find the New Extreme Point
Look at the current period’s high/low price data. Should it surpass or fall short of the preceding EP, the new extreme marks the high/low point for this time. Otherwise the previous EP is still in force.
6. Calculate the New SAR Value
Use the SAR formula as stated below.
SAR(current) = SAR(previous) + AF * [EP – SAR(previous)]
This accelerates the SAR value by the AF increment towards the current EP.
7. Trail Stop Level
Set a stop order at the current SAR value if you want to follow the trend. As SAR accelerates, it will trail further from the price bars.
8. Reset AF on Reversal
Reset the AF to minimal levels to start slowing down the new SAR direction when the SAR flips above or below the price action.
9. Repeat the Process
Recalculate the SAR at each new period, repeating steps 5-8. The SAR will adaptively accelerate and decelerate based on new EPs.
10. Optimize Parameters
Adjust the starting AF, Increment and other inputs to optimize SAR sensitivity for different instruments and timeframes.
With some practice, these Parabolic SAR calculation steps will become intuitive. The unique mechanism of an anchoring EP, adaptable AF and definable parameters gives traders flexibility in applying SAR analysis. Once the basics are understood, SAR values are calculated manually or with charting tools to fit various trading objectives.
How to use Parabolic SAR in Trading?
Parabolic SAR is used in trading to identify trend direction, signal potential reversals for entries and exits, adaptively trail stops, analyze momentum changes, optimize input parameters, and make quick visual assessments of market bias and strength. The Parabolic SAR is a versatile trading tool that is used to identify favorable entries and exits, set stop-losses, manage trades, and analyze market direction. By incorporating SAR analysis into a trading plan, traders benefit from the indicator’s objective signals and adaptability to changing market conditions.

A key use of SAR is determining trend direction. In uptrends, SAR dots form below the price bars. In downtrends, the dots appear above the bars. Monitoring SAR placement relative to the price action quickly identifies the prevailing trend. Traders then trade in alignment with the SAR-defined trend bias using supportive strategies.
Flips in the SAR dots from one side of the price to the other signal potential trend reversals. Traders often use SAR flips as trade entry triggers in the direction of the new trend. For instance, traders receive buy signals when the SAR swings below the price during a fresh rally. An example is attached below.
SAR values effectively trail market swings and are used to place adaptive stop-loss orders. Stops are set just beyond the current dot’s position. As SAR accelerates away from the price bars, it drags the stop level with it to lock in gains from the trade.
The SAR’s speed gives clues on momentum. Faster dot movement represents strong trend momentum. Slowing dots indicate waning strength. Monitoring changes in SAR speed helps traders evaluate momentum.
Trading stops in line with trend reversals when the SAR flips back through the price bars. This prevents giving back gains as the trend fades. The SAR provides clear exit rules based on the market’s momentum shifts.
Adjusting the SAR input values fine-tunes the indicator’s sensitivity for specific securities and market conditions. Optimized parameters improve the accuracy of SAR trading signals.
The SAR plots directly on the price chart for an intuitive visual guide. Traders quickly assess the market’s bias, strength, reversals, volatility, and momentum from SAR behavior.
What trading strategy works well with Parabolic SAR Trading?
Trend-following strategies, breakout trading, reversal trading, momentum trading, volatility expansion trading, and pattern breakout systems work well with Parabolic SAR trading due to its adaptive signals that help confirm trend direction, reversals, volatility, and breakout validity. Its adaptive nature makes it well-suited for combining with rules-based trading strategies. Some approaches that integrate well with SAR trading signals include:
If a particular trend is already set in motion, the SAR dots can be used to confirm the trend to provide additional confirmation for all the trend based strategies. Maximizing trade participation in SAR-defined trends involves entering when the SAR dots flip in the direction of the trend and quitting when they flip back.
Reversal trading can be achieved by combining signals from different analysis. A proper candlestick pattern, presence of proper support and resistance and indications from other indicators including SAR dots can confirm the upcoming change in the momentum.
SAR flips above or below the price action signal potential trend reversals.

Momentum can be faster or slower. If a momentum of a script is faster, the SAR moves faster indicating stronger continuation in the momentum. Whereas a slower SAR indicates an exhaustion in the current trend. The width between the candlestick and SAR can provide information regarding the volatility, thus volatility based strategies can be utilized in such cases.
Chart patterns signal potential breakouts. SAR dots quickly accelerate when price breaks out of consolidated patterns like triangles, rectangles and flags. SAR signals help confirm valid breakouts for entering trades aligned with the new trend direction.
Which timeframe is best for Parabolic SAR?
The higher time frames actually go best with Parabolic SAR. As the lower time frame trading activity involves a lot of volatility and random price action, the possibilities of misleading signals may appear that may impact the overall analysis. Thus Higher time frames suits best.
Daily, weekly and monthly candle time frames are suited best for Parabolic SAR.The indications gathered from the SAR dots on Daily time frame supposedly can further assist in diving into lower time frame analysis to add further confirmation for a particular trade setup. Various tools and indicators can be used alongside to further solidify a trading plan.
How do traders use Parabolic SAR to identify trend reversals?
Traders use Parabolic SAR to identify trend reversals through signals like SAR dot flips above/below price, crossover of key levels, slowing SAR velocity, divergence with price momentum, and evaluating volatility context. One of the primary applications of the Parabolic SAR is spotting when upside or downside momentum is fading and the likelihood of a trend reversal is increasing. The SAR’s unique mechanism provides objective clues on when buyers or sellers are losing control and the tide is shifting direction.
The most clear-cut SAR reversal signal comes when the dots flip from one side of the price bars to the other. For instance, a flip of the SAR above the bars indicates weakness is beginning to emerge and the upside has been exhausted while an uptrend with the SAR below the price has been in place. Traders often interpret these flips as trade exit signals when trading in the prior trend’s direction. In the image uploaded below, one can notice how a short opportunity was generated when the price started to exhaust and the SAR dots flipped its position. Additionally, a bearish candlestick pattern acted as a strong signal for short setups. This way, traders can take information.

Some traders wait for confirmation of the reversal by requiring a SAR flip above or below a moving average line or other indicator threshold. This creates a crossover system with increased precision. The SAR dots flipping above a moving average crossover in an uptrend, for example, provides added confidence for exit signals.
Not only do the SAR flips mark potential reversals, but traders also monitor the speed of the dots ahead of the flip. Rapid SAR acceleration followed by an abrupt deceleration warns of loss of momentum just prior to the crossover. It reflects the struggle between buyers and sellers. Identifying this slowing velocity strengthens reversal entry signals in the new direction.
How can Parabolic SAR be used with other Indicators?
Parabolic SAR is used with indicators like moving averages, oscillators, volume tools, chart patterns, volatility metrics, candlestick patterns, and support/resistance levels to provide confirmation and improve robustness of trading signals. The Parabolic SAR is often most effective when paired with complementary indicators that provide additional perspective and confirmation of trading signals. Using the SAR alongside chart patterns, momentum oscillators, volume tools and volatility measures creates a more robust analytical framework.
Overlaying moving averages with SAR provides trend filters and potential reversal signals when the SAR dots cross above or below the averages. The 50-day and 200-day simple moving averages are commonly used as benchmarks.
Momentum oscillators like RSI, Stochastics and MACD measure overbought/oversold levels and divergence from price. Combining oscillator readings with SAR signals improves timing and confirmation of trend reversals. In the chart uploaded below, one can observe how well the Parabolic SAR works on a weekly time frame. The level of resistance was near and possible breakout could have been anticipated by the flip of SAR dots from above the bars to below the bars, the MACD indicator also gave a strong bullish signal confirming a setup towards upside.

Different time frame analysis, chart patterns, price action, candlestick patterns, indications from different indicators can be used alongside the indicator to act as strong signals.
Volatility indicators like Average True Range quantify volatility changes. Monitoring volatility levels provides context on the magnitude of SAR price swings and potential reversals.
Horizontal support and resistance levels indicate potential turning points. SAR dots accelerating above resistance or below support signal high probability reversals from key zones.
Does Parabolic SAR be used in conjunction with Fibonacci Retracement?
Yes, the Parabolic SAR indicator is used effectively in conjunction with Fibonacci retracement levels. Fibonacci retracements identify potential support and resistance zones where reversals sometimes occur. They do this by plotting percentage retracement levels of prior swings – usually key swing highs and lows. The SAR trails price action and accelerates when trends get underway and begin reversing.
By combining Fibonacci retracements with SAR signals, traders gain greater context for entries, exits and stop placement. For instance, the SAR dots rapidly speed below the price bars in the event of an upward reversal. This SAR flip adds more evidence that the swing low holds as resistance on a countertrend rebound if it lines up with a significant Fibonacci support level.
What is the success rate of Parabolic SAR?
The Parabolic SAR is a versatile indicator that provides effective trading signals when used properly. However, like any single indicator, its signals should not be relied on in isolation. Realistically determining SAR’s strengths and drawbacks is important. The dependency on SAR’s should be avoided and they should be used in higher time frames for better introspection of market data. Its success rate depends significantly on the broader trading approach.
What are the Advantages of Parabolic SAR?
The Parabolic SAR provides traders an adaptive, visual trend and momentum analysis tool with universal utility across diverse markets and timeframes, enabling objective decision-making for trend identification, reversal signals, dynamic stop-loss trailing, and momentum assessment.
- Versatile Analysis Applications
It clearly identifies uptrends and downtrends in the market, signaling potential reversals early on. The indicator provides objective entry and exit triggers for trades, and also trails prices in order to set adaptive stop-loss levels that protect profits. Additionally, the Parabolic SAR assesses changes in upside and downside momentum.
- Adaptive Formula
One of the main advantages of the Parabolic SAR indicator is its dynamic nature and rapid response to changing market conditions. The indicator is momentum-based, meaning it quickens its pace during the early stages of new trends, then slows down as those trends start to fade. This allows the indicator to closely trail prices during low volatility environments, while maintaining a looser trail during high volatility. The indicator’s sensitivity to momentum makes it a very useful tool for timing entries and exits.
- Universal Utility
The Parabolic SAR indicator is its effectiveness across diverse markets and instruments. The indicator is also applied equally well to forex, stocks, indices, commodities, and cryptocurrency trading. It also performs well for long-term position trading approaches, identifying major trend reversals early. This makes the Parabolic SAR valuable for discretionary traders across different asset classes, as well as for systematic and algorithmic trading strategies. Its versatility enables traders to apply a consistent approach across portfolios containing varied asset types. The wide applicability of the Parabolic SAR makes it a robust indicator that works reliably in most market environments.
- Risk Management Functionality
One of the most useful aspects of the Parabolic SAR indicator is its ability to logically place stop-losses and define exit rules for trades. As the indicator trails prices, it sets adaptive stop-loss levels that follow market swings. This removes emotion from trade management, as exits are determined by predefined rules based on SAR flips or crossovers. By trailing below profits during uptrends and above losses in downtrends, the SAR keeps losses contained while allowing profits to run.
- Versatile Timeframe Usage
The Parabolic SAR is an adaptable indicator that is used effectively on time frames ranging from 1-minute charts up to monthly charts. On lower time frames, the indicator’s smooth settings may help filter out false signals and whipsaws. But today’s intraday action is highly volatile, thus the dependency should be avoided. It works best on higher time frames. Meanwhile, long-term investors use a slower SAR to confirm new trends and major reversals. Across all time frames up to the monthly level, the Parabolic SAR provides valuable guidance for trend following.
The Parabolic SAR provides traders visual display and versatile utility across markets and timeframes offers a convenient overlay for enhancing most trading approaches. By combining SAR with sound risk management, traders boost their analytical edge.
What are the Disadvantages of Parabolic SAR?
The Parabolic SAR has potential limitations including lagging signals, whipsaws, repainting, lack of precise timing, vulnerability to volatility, and limited customization options.
- Lagging Signals
While useful, the Parabolic SAR does have some drawbacks to consider. A key limitation is that it tends to provide late reversal signals at major turning points in the market. This is because the indicator’s formula adapts to the existing trend, and lags at the start of new trends. As a lagging indicator, the Parabolic SAR is not well-suited for anticipating reversals in advance. Instead, it confirms reversals after they have begun, often providing tardy signals at important tops and bottoms. Using other confirming indicators is recommended to recognize trend reversals early enough.
- Subject to Whipsaws
In today’s era of capital markets, intraday and short term activity is highly volatile and contains al lot of stop loss hunting movement. Thus, the indicator may end up producing misleading signals that can be avoided easily. Thus, the sole dependence on the indicator on especially lower time frames can be avoided. And it should be hence combined with different time frame analysis, price action and other indicators and tools for better introspection of market activity. Finding the optimal responsiveness without meaningless noise is key to filtering out whipsaw signals on the Parabolic SAR.
- Repainting Issues
One problematic characteristic of the Parabolic SAR is that its unfixed historical values have the tendency to repaint. This means that SAR signals plotted on prior chart bars shift after the fact as new price data emerges. In the event that the indicator repaints, a SAR crossing that was seen yesterday could not be visible tomorrow. This repainting reduces the reliability of backtesting Parabolic SAR strategies, since prior signals are not fixed and sometimes disappear later. The unfixed nature of the historical Parabolic SAR values affects strategy reliability and requires caution when backtesting.
- No Trade Timing Precision
While useful for trend bias, traders should keep in mind the Parabolic SAR has limitations regarding precise timing and swing points. The indicator is best suited for directional bias rather than pinpointing specific entry and exit locations. As it lags price action, the Parabolic SAR will not identify exact price peaks or troughs in real-time.
The indicator trails behind pivots rather than forecasting them ahead of time. As such, traders should not expect the Parabolic SAR to reveal optimal trade location or precise timing by itself. Additional tools are necessary to complement the SAR signals with more precise entry and exit points. Used properly as a trend bias filter, the Parabolic SAR provides trading guidance but does not offer pinpoint accuracy for trade execution.
- Vulnerable to Volatility
The Parabolic SAR sometimes struggles during periods of extreme, rapid volatility in the markets. The indicator algorithm causes the SAR to accelerate and shoot far away from the current price during strong increases in volatility. This is intended to trail significant trend moves, but reduces the relevance of the SAR signals in the meantime. Until volatility stabilizes, the stretched SAR position continues to lag far behind prices.
- Limited Customization
The Parabolic SAR has relatively few input variables for traders to optimise. The main adjustments involve the acceleration factor, maximum SAR step, and starting SAR value. However, more advanced modifications are not possible to improve adaptability. For example, traders cannot alter the actual SAR formula itself based on their unique strategy rules or market conditions.
The basic settings do allow some sensitivity tuning, but overall the Parabolic SAR lacks advanced customization to match individual trading styles. Traders are limited to the standard optimization of the acceleration factor and step size. Relying solely on SAR without broader strategy integration and risk controls is not wise. Awareness of its disadvantages helps focus SAR usage on its strengths.
Is the Parabolic SAR accurate?
The accuracy of the Parabolic SAR indicator depends significantly on how it is used as part of an overall trading approach. On its own, SAR cannot provide perfectly accurate signals. However, with proper optimization and integration, SAR contributes to an edge.
The dynamic formula of SAR makes it flexible enough to adapt to evolving market conditions. It is capable of early trend identification and prompt reversal alarm generation when calibrated appropriately for a specific asset and period. The accuracy of these signals relies heavily on the selected input parameters. Extensive testing and optimization is required to match SAR’s sensitivity to different markets.


 Previous Article


![15 Investing.com Alternatives [Free+Paid] You Should Use in 2026](https://www.strike.money/wp-content/uploads/2026/04/Investing.com-Alternatives.jpg "15 Investing.com Alternatives [Free+Paid] You Should Use in 2026 106")
![15 TradeStation Alternatives [Free+Paid] You Should Use in 2026](https://www.strike.money/wp-content/uploads/2026/04/TradeStation-Alternatives.jpg "15 TradeStation Alternatives [Free+Paid] You Should Use in 2026 107")
![15 Chartink Alternatives [Free+Paid] You Should Use in 2026](https://www.strike.money/wp-content/uploads/2026/04/Chartlink-Alternatives.jpg "15 Chartink Alternatives [Free+Paid] You Should Use in 2026 108")
: Overview, 10 Types of Indicators, Settings for Different Markets 109")


 : Definition, Formula, calculation, Uses, Advantages Vs limitations 112")


No Comments Yet.