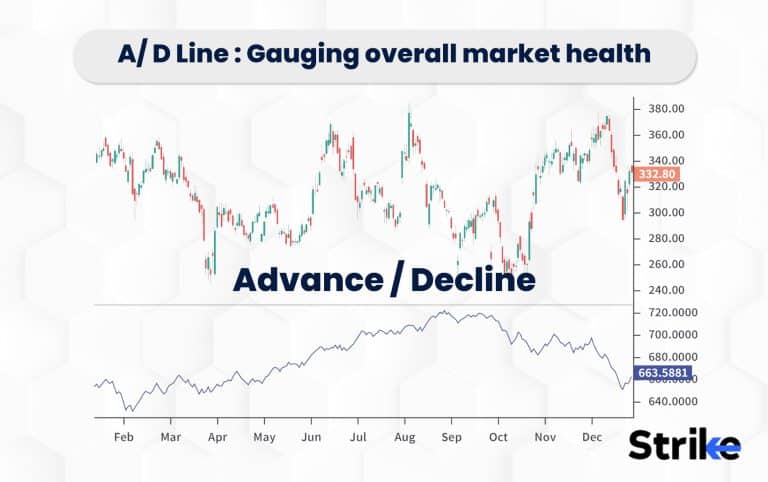
A/D Line the indicator of the market structure helps in gauging the market health. The A/DL decides the performance of the traders in the market structure. A/DL helps in gauging the bear and bull commitments to the market stability.
The accumulation / distribution line simply functions as an indicator. It can be abbreviated as A/D line. The A/D line uses price as a cumulative indicator to assess the stock distribution and accumulation. Stock flow and price volume divergences are depicted on an A/D Line. It can also be defined as a technical indicator or a monitoring tool used to evaluate the money flow in and out of the market. A rising A/D line helps confirm a rising price trend, while a falling A/D line helps confirm a price downtrend.
Stock accumulation and the A/D Line (Accumulation/Distribution Line) are related concepts in technical analysis that can help investors identify trends in a particular stock or market. Stock accumulation is the process of gradually increasing one’s holdings over time. Stock accumulation leads to purchasing shares of the stock at regular intervals or reinvesting dividends earned from owning the stock. The goal is to build a long-term investment portfolio and generate income/capital gains over time.
The strategy of stock accumulation is often associated with buy-and-hold investing, regardless of short-term fluctuations in their price. By accumulating shares over time, investors can potentially benefit from compounding returns and can reduce the impact of market volatility. Stock accumulation can influence the A/D Line by increasing the volume of shares traded on days when the price hikes. By gradually accumulating shares of a stock over time, there will be increased buying pressure, which can lead to a higher A/D Line. On the other hand, if investors are selling shares of a stock over time, this can decrease buying pressure and lead to a lower A/D Line.
The A/D calculation in a precise, simplified manner includes MMF Calculation, MFV Calculation, and A/D Line Calculation. Giving an insight to the process of A/D L indicator calculation, purpose, applications and much more is the prime objective of this article.
What is the Accumulation/Distribution Line?
The Accumulation/Distribution Line (A/D Line) is a technical indicator to evaluate the money flow into or out of a security or market. The Accumulation/distribution line is a cumulative indicator to access the stock distribution and accumulation. It uses volume and prices for the stock distribution and accumulation analysis. It can rise or fall depending on the market structure.

If the A/Dline rises, it confirms an uptrend. The sloping line indicates the price downtrend. The A/D Line is the sum of stock volume and the previous day’s A/DLine. The price movement of the stock or market during the trading day is then adjusted. It gives a clear picture of the market trends and potential security reversals. The Accumulation/Distribution Line is useful for traders to monitor the money flow and help identify potential trading opportunities.
History Of A/D Line
The Origin of the accumulation/distribution line dates back 1980s. Marc Chaikin developed this technical indicator. Chaikin created this indicator to help traders identify buying and selling pressure in a particular security.
Traders use the accumulation/distribution line to identify trends in the money flow into and out of a security. It also gives insights into potential divergences between price and volume that may signal a trend reversal. The A/D line can be closely related to the Chaikin Oscillator and the Chaikin Money Flow indicator.
A/D Line Working simplified
The A/D Line indicator identifies buying and selling pressure in the market. It helps traders make decisions about their trading strategies. The A/D Line focuses on the theory that when a security is experiencing sturdy buying pressure, its price should rise, its trading volume should increase and vice versa. Before explaining the working of the accumulation/ distribution line, the identification of accumulation and distribution needs to be studied. The identification methods are listed below:
Accumulation:
- Price is moving sideways after a downtrend
- Trading volume is increasing while the price remains relatively stable or is showing signs of upward momentum
- The Accumulation/Distribution Line is moving upward and shows a positive trend
- The Relative Strength Index (RSI) shows oversold conditions
Distribution:
- Price is consolidating or moving sideways after an uptrend
- Trading volume is increasing while the price remains relatively stable or is showing signs of downward momentum
- The Accumulation/Distribution Line is moving downward and shows a negative trend
- The RSI shows overbought conditions
Traders should use other technical indicators and analysis techniques to confirm potential accumulation or distribution patterns. Price action patterns help in accumulation and distribution identification. Identifying accumulation and distribution in the market requires a combination of technical analysis tools and market knowledge.
The A/D Line can be used to identify trends in the flow of money, as well as potential divergences between price and volume that may signal a trend reversal. Traders can use the A/D Line in a number of ways, including Confirming price trends, Trend reversal identification, Divergences
Purpose of an A/DL Indicator
The Accumulation/Distribution Line (A/D Line) is a technical analysis indicator measuring buying and selling pressure in a market. The purpose of the A/D Line is to identify this and use the information to make trading decisions.
The A/D Line analyzes price change and volume data to determine the strength of buying and selling pressure. When the buying market pressure is more, the A/D Line will increase. It indicates that more traders are buying the asset.
Conversely, when there is more selling pressure, the A/D Line will decrease, denoting that more traders are selling the asset. The A/D Line identifies potential trend reversals, trend strength confirmation, and buying or selling opportunities. Traders may also use the A/D Line with other technical indicators and analysis methods to make more informed trading decisions.
In summary, the purpose of the A/D Line is to provide insights into buying and selling pressure in a market and to use this information to make trading decisions.
Importance of an A/DL Indicator
The A/D Line indicator is a tool in technical analysis because it can provide valuable insights into the buying and selling pressure in a market. Here are a few key reasons why the A/D Line is the most important indicator for traders and analysts:
- Trend Identification: The A/D Line can be used to identify trends and the strength of those trends.
- Confirming Breakouts: The A/D Line helps with breakout confirmation, which occurs when the price moves above or below a level of support or resistance.
- Divergence: The A/D Line helps in the divergence study.
- Volume Analysis: The A/D Line depends on volume data, which can provide valuable insights into the behavior of market participants.
In short, the A/D Line is a crucial tool in technical analysis that can provide valuable insights into market dynamics. Traders and analysts can use the A/D Line to identify trends, confirm breakouts, identify divergence, and analyze volume data to make more informed trading decisions.
What is the Formula for Accumulation/Distribution Line indicator?
The formula for accumulation/distribution line indicator is denoted as,
MFM = [(CP – LP) – (HP – CP)] / (HP – LP)
where,
MFM – Money Flow Multiplier
CP – Closing Price
LP – Low Price
HP – High Price
Money Flow Volume = MFM × Period Volume
A/D = Previous A/D + CMFV
where,
CMFV – Current period money flow volume
How to Calculate the Accumulation/Distribution Line indicator?
The A/D calculation in a precise, simplified manner includes MMF Calculation, MFV Calculation, and A/D Line Calculation. The detailed steps are as follows:
- Calculate Money Flow Multiplier: The security closed higher or lower than the previous day’s close helps MMF Calculation.
If the security closes higher, the Money Flow Multiplier is equal to [(Close – Low) – (High – Close)] / (High – Low).
If the security closes lower, the Money Flow Multiplier is equal to [(Close – High) – (Low – Close)] / (High – Low).
- Calculate Money Flow Volume: Multiplying the Money Flow Multiplier by the day’s volume gives the money flow volume.
- Calculate Accumulation/Distribution Line: Adding the current day’s Money Flow Volume to the previous day’s A/D Line gives the A/D Line.
The resulting line represents the cumulative money flow into or out of the security over the specified period. Repeat this process for each subsequent trading day to calculate the ongoing A/D Line. The A/D Line is a line chart alongside the price chart of the analyzed security. Traders often look for divergences between the A/D Line and price, which can signal potential trend reversals or breakouts.
How to use the Accumulation/Distribution Line indicator in Technical Analysis?
The Accumulation/Distribution Line (ADL) is a technical analysis indicator that uses volume and price data to assess buying and selling pressure. The ADL is a cumulative indicator that accumulates volume based on whether prices close higher or lower than the previous period’s close.
Here are the steps to use the ADL indicator in technical analysis:
- Trendspotting: Like most technical indicators, the ADL is used to identify trends. When the ADL is trending upwards, it indicates that buying pressure is increasing, and vice versa when it is trending downwards.
- Divergence Observation: A divergence between the ADL and the price chart may signal a possible trend reversal.
- Confirm breakouts: When the ADL breaks out of range, it can signal a potential trend continuation or reversal.
- Use in conjunction with other indicators: The ADL can be used in conjunction with other technical indicators to confirm signals.
How to use Accumulation/Distribution Line Indicator in Stock Market Trading?
The terms and terminologies related to the A/DL indicator can be explained well by understanding the concepts of accumulation trading, distribution trading and stock market distribution.
Distribution trading is a type of trading that involves the distribution or sale of goods from manufacturers to retailers or end-users. Here the distributor acts as a middleman between the manufacturer and the end users, buying goods from the manufacturer at a lower price and then selling them to retailers or end-users at a higher price.
Distribution trading can involve a variety of products, including consumer goods, electronics, industrial supplies, and more. The goal is to provide a reliable and efficient supply chain for manufacturers and retailers, allowing them to focus on their core business while the distributor handles the logistics of getting products to market.
Accumulation trading is a strategy used in financial markets where an investor or trader attempts to accumulate a bulk position in a particular asset gradually over time, typically at a lower price than the market value. The basic idea behind accumulation trading is the accumulation of huge assets while keeping the market price low. Accumulation trading can be profitable if executed properly but requires patience and discipline. Accumulation trading is typically a longer-term strategy.
The Accumulation/Distribution Line (A/D Line) is a technical indicator to measure money flow into or out of a particular stock or market over time. Here are some steps on how to use the A/D Line Indicator in stock market trading:
- Understand how the A/D Line works: The A/D Line is calculated by adding the volume on days when the price of a stock goes up and subtracting the volume on days when the price goes down. Higher values indicate buying pressure, while lower values indicate selling pressure.
- Look for divergences: One way to use the A/D Line is to look for divergences between the indicator and the stock price. For example, if the stock price is making a new high and the A/D Line is not, this could indicate that the buying pressure is weakening and the stock price may soon reverse.
- Confirm trend changes: Another way to use the A/D Line is to confirm trend changes in the stock. If the A/D Line is rising while the stock price is falling, this could indicate that buying pressure is increasing, and a trend reversal is likely.
- Use other indicators: The A/D Line can be used in conjunction with other technical indicators to confirm signals or identify potential trading opportunities.
How to read the Accumulation/Distribution Line indicator chart?
The following steps help in analyzing the A/D Line.
- Ensure that you are using a trending chart.
- Check the default period.
- Use the default period.
- Buy when the A/D indicator moves higher and sell when it moves lower.
A better option is to use the A/D indicator in combination with other indicators, like the double exponential moving averages, RSI, MACD etc. The Accumulation and distribution indicator helps to find divergences. Rising price and falling A/D Line is a sign of divergence. Trend-following is a popular trading strategy where a trader buys a rising asset.
Benefits of the Accumulation/Distribution Line indicator
The Accumulation/Distribution Line (A/D Line) is a technical analysis indicator that attempts to gauge supply and demand in a particular market. Traders and analysts use it to determine the strength of a trend, potential reversals, and market divergence. Here are some of the benefits of using the A/D Line indicator:
- Identifying Potential Reversals: The A/D Line can be used to identify potential market reversals. If the A/D Line moves in the opposite direction of the trend, it indicates that the trend reverses. It signals traders who are looking to enter or exit a position.
- Market Divergence: The A/D Line helps to identify market divergence. If the price of an asset is moving higher, but the A/D Line is moving lower, it suggests a divergence between the price and the underlying supply and demand. It can be a warning sign that the trend may be losing momentum.
- Volume Confirmation: The A/D Line is often used in conjunction with volume indicators to confirm price movements.
Limitations of the Accumulation/Distribution Line indicator
The A/DL is just one tool that assesses strengths or weaknesses within a trend. The Accumulation/Distribution Line (A/D Line) indicator has its drawbacks apart from the benefits. The limitation to using the A/D Line are:
- Subjectivity: The A/D Line is a subjective indicator because it relies on volume data interpretation.
- Limited Market Applicability: The A/D Line is most useful in markets with a high level of volume and liquidity. In markets with lower liquidity, such as some small-cap stocks or thinly traded commodities, the A/D Line may not be as reliable due to the limited availability of volume data.
- False Signals: Like all technical indicators, the A/D Line is imperfect and can generate false signals.
- Lack of Price Information: The A/D Line only considers volume data and does not consider the price. The A/D Line may not provide a complete picture of market dynamics. It does not factor in price changes from one period to the next and focuses only on where the price closes within the current period’s range. Traders need to monitor the price chart and mark any potential anomalies, as they could affect how the indicator gets interpreted.
Use the A/D indicator in conjunction with price action analysis, chart patterns, or fundamental analysis to get a complete picture of what is moving the price of a stock.
What are examples of Accumulation/Distribution Line indicators?
The accumulation distribution indicator (ADI) is a momentum indicator that traders use in reversal predictions in a trend by identifying tops and bottoms. Traders determine whether there are mostly bulls (accumulating) or bears (distributing) in the market by identifying a divergence between the price and the indicator.
For example, if an asset is in an overall downtrend but the price has recently increased, this can signal that demand for the asset is starting to increase – the sellers are losing power and the buyers are starting to gain power. The ADI will start to head in the opposite direction, away from the price, suggesting a reversal may occur.
The chart below demonstrates the accumulation distribution indicator:
Is Accumulation/Distribution a leading indicator?
Accumulation/Distribution tracks the relationship between price and volume. A/DL acts as a leading indicator of price movements. It provides a measure of the commitments of bulls and bears to the market. It is used to detect divergences between volume and price action – signs that a trend is weakening.
Is Accumulation/Distribution a good indicator?
The accumulation distribution indicator is a good means to assess the volume force behind the pricing move. The A/DL indicator determines the buying and selling pressure of stock in the market and can offer insights about potential stock price changes based on the same.
A trader can estimate the trading position as per potential price movements. The A/D line also spots price-volume divergences, which helps traders confirm the trend’s strength and sustainability. Its effectiveness depends on several factors, including the market, specified time frame, and data interpretation.
In general, the A/D Line is a useful tool for traders and analysts to determine the strength of a trend, identify potential reversals, and confirm price movements. A/DL should not be used isolated but in conjunction with other technical indicators. The indicators and analysis methods cannot always guarantee profitable trading outcomes.
Technical analysis – A/DL collaboration helps in developing a comprehensive trading strategy. This strategy helps in money management and risk management studies. Its effectiveness depends on its use in conjunction with other indicators, analysis methods, and accurate data interpretation.
Difference between Accumulation/Distribution and On Balance Volume
Price and volume are used by both of these technical indicators, albeit in slightly different ways. The on-balance volume (OBV) finds application when the current closing price is higher or lower than the previous closure. The A/D indicator utilizes a multiplier depending on where the price closed within the period’s range. Because of this, the indicators’ methods of calculation and potential sources of information vary.

The A/D L indicator thus provides a complete picture of the market and guides the traders on how to invest in the fast-trendsetting world of stocks and securities.


 Previous Article


![15 Investing.com Alternatives [Free+Paid] You Should Use in 2026](https://www.strike.money/wp-content/uploads/2026/04/Investing.com-Alternatives.jpg "15 Investing.com Alternatives [Free+Paid] You Should Use in 2026 28")
![15 TradeStation Alternatives [Free+Paid] You Should Use in 2026](https://www.strike.money/wp-content/uploads/2026/04/TradeStation-Alternatives.jpg "15 TradeStation Alternatives [Free+Paid] You Should Use in 2026 29")
![15 Chartink Alternatives [Free+Paid] You Should Use in 2026](https://www.strike.money/wp-content/uploads/2026/04/Chartlink-Alternatives.jpg "15 Chartink Alternatives [Free+Paid] You Should Use in 2026 30")
: Overview, 10 Types of Indicators, Settings for Different Markets 32")

 : Definition, Formula, calculation, Uses, Advantages Vs limitations 34")


: How We Used This 70/30 Indicator in 6 High Win-rate Strategies 38")


No Comments Yet.