The head and shoulders candlestick pattern is one of the most reliable patterns used in technical analysis. The head and shoulders pattern indicates a trend reversal either from bullish to bearish or vice-versa. The head and shoulders pattern is formed during uptrends and the reversed head and shoulders pattern is formed during downtrends.
The pattern gets its name from the way the candlesticks are formed. The pattern is formed when the price of a stock hits a peak price and declines. This is considered as the first shoulder. The price will again rise and form another peak which is higher than the last peak. The price will again fall close to the lowest point of the first shoulder. This forms the head of the pattern. The price will rise for the third time and rise to a level close to the point of the first shoulder and fall thus completing the pattern.
The head and shoulders pattern also consist of a neckline. The neckline refers to the imaginary horizontal line formed from the lowest point of the first shoulder to the lowest point on the second shoulder. The neckline indicates the resistance price of the head and shoulder patterns. The troughs (lowest point) of the shoulders will always be above the neckline. The pattern is considered broken if the trough goes below the neckline.
The head and shoulders trading pattern requires the traders to wait till the pattern is complete. The pattern has chances of breaking in between its formation. The trader should act only when the pattern is complete and breaks the neckline. The trader is expected to plan the point of entry, exit, stop loss price and profit targets before the neckline is broken.
What does head and shoulders pattern mean?
The head and shoulders pattern is an indication of change in market sentiment from either bullish to bearish or vice-versa. The head and shoulders pattern can appear near both up trends and down trends.

The head and shoulders pattern consist of a left shoulder, a head and a right shoulder and an imaginary line drawn from the troughs of the first shoulder to the trough of the last shoulder. This line is called the neckline. The left shoulder is formed after the bulls dominate the market and push the prices above the initial trading range. The trade volume during the formation of the first shoulder is high. The bears dominate the stock after the first shoulder reaches its peak.
The dominance of the bears results in the sliding down of prices. This results in a short downtrend which ends near the neckline of the pattern. The bulls once again take charge and push the prices. The prices move way above the peak of the left shoulder that was previously formed. The rallying up of the prices above the peak of the shoulder results in the formation of the head.
The bears once again take control and result in a downtrend greater than the one before. The prices dip close to the neckline from the head. The right shoulder is formed when the prices rally up from the neckline. The prices will not reach close to the peak of the head. The downtrend after the right shoulder will break the neckline and continue to fall below it.
The head and shoulders pattern is easily identified by its three peaks. The pattern also consists of 4 characteristics that are noticeable. The 4 characteristics of the head and shoulders pattern are:
- Difference in volume: The most common characteristic of every head and shoulders pattern is the difference in the trade volume between the left and right shoulders. The left shoulder of the pattern always has a large trade volume as compared to the right. The difference in volume is caused by more and more traders joining in on the up trend in the left shoulder. The traders will start to lose confidence when they reach the right shoulder as they sense a trend reversal thus showing a lower trade volume.
- Neckline: The neckline refers to the line that acts as a level of resistance in the head and shoulders pattern. The neckline won’t always be a straight horizontal line. The neckline can tilt upward (for normal head and shoulders pattern) or downward (for inverse head and shoulders pattern). The greater the tilt in the neckline the greater will be the up trend/down trend after the break out. In order for a pattern to be considered a head and shoulders pattern the lowest point of the right shoulder must be below the highest point (peak) of the left shoulder in the situation where the neckline is tilted upwards.
- Measure of the trend: The head and shoulders pattern provides a signal for a downtrend. The components of the head and shoulders pattern can be used to measure the level of downtrend that will happen. The downtrend will be the same distance as the distance from the peak of the head to the neckline. Consider an example in which the distance from the peak of the head to the neckline represents a decrease of RS 20. The breakout that takes place after the pattern is completed will indicate a downtrend where the prices have fell RS 20 or a price close to that.
- Broadness of the shoulders: The head and shoulders pattern consist of two shoulders. The width of the peak of the shoulders mainly depends upon the time frame of which the peak of each shoulder is maintained. The width of the shoulder increases if the price reaches the peak of the shoulder and a downtrend does not follow right away. The greater the time taken for the downtrend to happen the greater will be the width.
The head and shoulders pattern thus consists of 4 characteristics that make it easier for traders to spot in day trade. The above-mentioned characteristics may not always appear for the head and shoulders pattern.
How do a head and shoulders pattern work?
The head and shoulder pattern is one of the most basic patterns in technical analysis and is used by both experienced and novice traders. The pattern consists of a three-peak candlestick pattern with the middle peak higher than the other two.
The head and shoulders pattern works on the principle of demand exhaustion. The bulls initially take control causing the price to rise. Security soon demands exhaustion causing the price to fall till a point. The bulls once again take control stronger than the first time pushing the prices up and forming new highs. The exhaustion sets in once again causing the prices to fall and touch the neckline. The bulls take control one more time to form the peak of the right shoulder before completely exhausting their demands and signaling in trend reversal and causing the prices to fall below the neckline.
The importance of the head and shoulders pattern lies in the fact that it indicates a trend reversal that can be measured approximately. The head and shoulders pattern clearly defines the area to set the profit targets and set risk levels. The pattern provides clear cut rules that are easy to follow for traders to book their profits.
The primary purpose of the head and shoulders pattern is to provide a signal of trend reversal. The two factors that help to ensure the trend reversal will take place are as follows.
- Volume : The volume of trade is one of the factors that help to indicate the trend reversal in the head and shoulders pattern. The trade volume refers to the number of shares being bought and sold at a particular point of time. The chances of trend reversal are high when the trade volumes decrease when the right shoulder is formed. The gradual decrease in the volume during the formation of the head and shoulders pattern indicates a trend reversal.
- Time period/frame : The rule of thumb in the head and shoulders pattern that needs to be followed for signaling trend reversal is that the up trend in the pattern should be twice as long as the distance between the shoulders of the pattern. The trader will witness a strong breakout if there is a wide gap between the uptrend and the shoulders.
The main purpose of the head and shoulders pattern is to spot the trend reversal in the market. The evidence of this trend reversal can be confirmed using the above-mentioned factors. The accuracy of the trend reversal can be predicted by using more and more technical tools.
The trend reversal indicated by the head and shoulders pattern is put to use by the traders. The main strategy involved in the head and shoulders pattern is to short the position of the security. The traders should Short the prices at the level in which the neckline is broken and keep stop losses as per their risk reward need. The greater the risk the trader is willing to take the lower the prices the trader can short sell.
How to identify a head and shoulders pattern ?
The head and shoulders pattern is one of the most easily identifiable patterns in day trade. The most striking feature of the pattern is its three-peaked shape. The three peaks look similar to two human shoulders and a head in the middle. The head and shoulders pattern also consist of a neckline. The pattern is identified as the head and shoulders pattern when all the four mentioned components are present and the pattern stays above the neckline.
The head and shoulders pattern is identified with its 4 components:
- The left shoulder :- The left shoulder of the head and shoulders pattern is formed when the buyers starts to take control and push the prices. The trade volume during the formation of the left shoulder also increases as the traders jump on to the uptrend that is taking place. The formation of the left shoulder is complete with the buyers temporarily exhausting themselves and the prices will be pushed down.
- The head :- The head of the head and shoulders pattern is formed after the left shoulder. The buyers take control and push the prices up to new highs (higher than the peak of the left shoulder). The pattern continues with the price reaching a new peak and continues to fall to form a new down trend. The prices will plummet to the point near the low of the left shoulder or slightly above the point. This completes the formation of the head of the pattern.
- The right shoulder :- The right shoulder of the pattern is formed when the buyers starts pushing the prices up one more time. The trade volume as compared to the left shoulder is low on the right shoulder as the traders start to sense the trend reversal that will take place. The price will begin to go up near the levels of the peak of the first shoulder and return down. The downtrend from the right shoulder will continue to take place and will go beyond the level of the usual low of both the shoulders. This indicates that the pattern has been completed.
- The neckline :- The neckline of the pattern consists of a horizontal line that acts as a resistance to the support during the formation of the pattern. The prices of the head and shoulders must stay above the neckline inorder for the pattern to be completed. The prices should break the neckline only when the right shoulder is formed. The neckline serves as the basis on which the downtrend can be measured. The downtrend which is formed after the right shoulder will be equal to the distance between the head and the neckline in the head and shoulders pattern.
The head and shoulders pattern can thus be identified using its four key components. The formation of the head and shoulders indicate trend reversal. With the help of more technical tools and other indicators the pattern will be easier to spot and can be used accordingly.
What does an inverse head and shoulders pattern look like ?
The inverse head and shoulders pattern appears during a downtrend and it signals a trend reversal from bearish to bullish. The inverse head and shoulders pattern is similar to the head and shoulders pattern and is easy to identify in day trading. It is considered as a sign of bullishness. The inverse head and shoulders pattern is the same as that of the head and shoulders pattern but of opposite nature.
The inverse head and shoulders pattern consist of three troughs and appears at times of a down trend. The pattern is formed when the price of a security starts to fall. The down trend takes the to new lows. From the lows the bulls take over and the prices of the security are pushed up which causes the first trough to be formed in the head and shoulders pattern.
The control of the bulls won’t last long as the prices reach a certain peak and start to fall. This fall initiates a down trend that creates a trough/ shoulder that is greater than the previous one. This trough is considered as the inverted head of the pattern. The pattern continues to form as the prices are once again pushed up by the bulls and reaches a peak closer to the one formed initially. The prices fall for one more time as the buyers temporarily exhaust their demands before the prices are pushed past the range within which it was traded during the formation of the pattern.
It is to note that each time the prices start to rise it will stay below a price range. An imaginary line that is drawn indicates that the price of the peaks were below this line. This line acts as resistance to the uptrend during the formation of the pattern. This line is referred to as the neckline of the head and shoulders pattern. The inverse head and shoulders pattern thus can be easily identified by its three trough shape.
The inverse head and shoulders pattern requires the traders to wait till the pattern is completed. The prices breach the neckline and continue to have an uptrend only when the third trough is formed. Only then it is considered as an inverse head and shoulders pattern. The inverse head and shoulders pattern is reliable as it is recurring and used by traders commonly. The accuracy of the pattern is directly proportional to the additional technical tools that are involved.
How to use head and shoulders pattern in stock market trading?
The head and shoulders pattern is one of the commonly used patterns in the stock market. It is favored by both experienced and beginner traders as it helps to estimate the target price and determine where to set up the stop loss once the pattern has been formed. The traders place a short position on the price when a head and shoulders pattern appear.
A short position refers to selling of the security that is not currently owned. The security can be sold at a higher price and when the prices decrease could be bought thus making a profit. The head and shoulders pattern indicate a trend reversal from bullish to bearish thus indicating a downtrend. The head and shoulders pattern not only gives the signal for a downtrend but also provides an approximate measure of how far the price of the security will fall. The price will fall the same distance as the distance between the head and the neckline of the pattern.
This is an approximate value. The vertical distance from the peak of the head to the neckline is measured from the neckline and below to approximate for the short position. For example if the distance from the peak of the head to the neckline of a head and shoulders pattern represent RS 50 then the downtrend that follows is expected to drag the price of the commodity down by approximately RS 50.
This is just an approximate minimum amount of which it could decline. The inverse head and shoulders pattern has the same concept. In the reverse head and shoulders pattern the prices will move upwards and this movement can be measured by the vertical distance between the inverse head that is formed and the neckline that is situated above it.
How to use head and shoulders pattern in technical analysis ?
The first and major rule of using the head and shoulders pattern in technical analysis is don’t jump the gun i.e., the trade should wait for the pattern to be completely formed. The pattern is said to be formed completely when the two shoulders and the head have been formed above the neckline and the peak of the head lies above the peaks of the shoulder.
The trader can take action once the pattern is fully formed. The next step in using the head and shoulders pattern in technical analysis is to plan the trade ahead of time. The trader should be quick in forming the target profits and must be ready to set the stop loss before the neckline is broken.
The neckline refers to the imaginary line of resistance that is drawn below the head and shoulders pattern. The head and shoulders pattern is said to be completed only when the head and shoulders are formed above the neckline and there is a breakout of price after the right shoulder has been completed. The neckline acts as the connection between the two lows of the head and shoulders pattern.
The neckline is a major component of the head and shoulders pattern as it helps to measure the level of breakout the prices will follow after the downtrend. The measurement is done by using the distance between the peak of the head and the neckline. It is said that the price will fall (after breakout) the same distance as the one from the peak of the head to the neckline.
Traders can locate the breakout point, place their target price levels and set up stop losses as per the neckline. The traders should watch for any variables that might take place and must be flexible. The changes might make it necessary for the traders to change the price at which the trader enters, exits, sets a target.
The trader can also adopt a strategy of waiting for the prices to move up slightly above the neckline (after the neckline has been broken) before entering into a short position. This is a risky strategy as the trader may lose the opportunity to enter into the conventional head and shoulders position for an alternate version that may not appear.
The trader must weigh in his/her risk reward strategy before entering into the position. A trader can short the position at a price which is of the same distance from the peak of the head to the neckline or even more with a trailing stop loss. The stop loss the trader is willing to place depends on the risk that he/she is willing to take for a greater reward
How to read head and shoulders pattern in candlestick charts?
The head and shoulders pattern is one of the easiest patterns to read in candlestick charts. The first step that involves reading the head and shoulders pattern is to identify it using its three headed peaks. The two shoulders and the head in the middle stand out in the chart. The next step in reading the head and shoulders pattern is to notice the neckline that is to be formed.

The neckline will depend on the trough prices of the left and right shoulders. The trader should also notice that the price movement taking place (after the pattern has started to form) should be above the neckline. Once the neckline is formed the next step is to identify the difference in the volume of the two shoulders.
When the head and shoulders patten is completed the left shoulder has a greater trade volume than the right one. The greater the volume in the left shoulder the greater will be the breakout that will initiate a downtrend. The next step in reading the head and shoulders pattern involves taking note of the time period that is involved. The time involved in forming the shoulders will hint on how strong the breakout will be.
All the above-mentioned steps must be taken into consideration for reading the head and shoulders pattern in a candlestick chart. It is to note that not all the conditions will be satisfied when the pattern is formed and the pattern may vary in a few characteristics due to the variable factors that exist in the market.
What are the advantages of the head and shoulders pattern ?
The head and shoulders pattern is one of the most commonly occurring patterns in day trade. The head and shoulders pattern is used by a wide variety of traders because of its 3 major advantages which are:
- Identification :- The easy identification of the head and shoulders pattern is one of the major advantages of the head and shoulders pattern. The three peaked pattern is recognizable by both experienced and novice traders. The traders can spot the formation of the pattern in an early stage and plan their strategy according to it.
- Time :- The head and shoulders pattern consist of three peaks, this itself is considered as an advantage because the formation of three peaks gives time for the trader to strategize a plan of action to be carried out. The head and shoulders pattern provide ample amount of time to plan whereas other patterns require the traders to act on it immediately.
- Defined movement :- The head and shoulders pattern indicate a trend reversal that is going to take place. The magnitude of the trend reversal that will take place can also be approximately measured. The vertical distance from the peak of the head to the neckline is the distance that the downtrend is said to travel after it breaks the neckline of the pattern. This approximate defined movement helps traders plan their entry and exit and helps to place the stop loss also.
The head and shoulders pattern is one of the easiest trade patterns to spot and take advantage of. The head and shoulders pattern is common not only in the equity market but also in other market sectors like foreign exchange and cryptocurrency markets. Its relevance in different market sections indicates how the trade pattern is widely used among traders.
What are the disadvantages of the head and shoulders pattern ?
There is no such thing as a perfect candlestick pattern in technical analysis. The head and shoulders candlestick pattern has its own disadvantages which makes it difficult to accurately predict the movement of the price of the security. The 2 major disadvantages of the head and shoulders pattern are :
- Distorted shape :- The head and shoulders pattern consist of 3 peaks but the major problem with it is that the peaks may not be formed as per the principles of the head and shoulders. The shape of the head and shoulders pattern may distort as per the market variables and traders have to stop to think whether he/she wants to enter into the trade or not.
- Accuracy :- The accuracy of the head and shoulders pattern will not be 100 percent accurate ( like all candlestick patterns). The pattern will not follow the general rule of thumb and can make exceptional cases like the breakout not going as far as the vertical distance of the peak of the head to the neckline, or sometimes not breaking the neckline at all.
The unpredictability of the market causes the disadvantages of the head and shoulders pattern. All candlestick patterns follow a degree of uncertainty because of the market variable involved.
What is an example of head and shoulders pattern ?

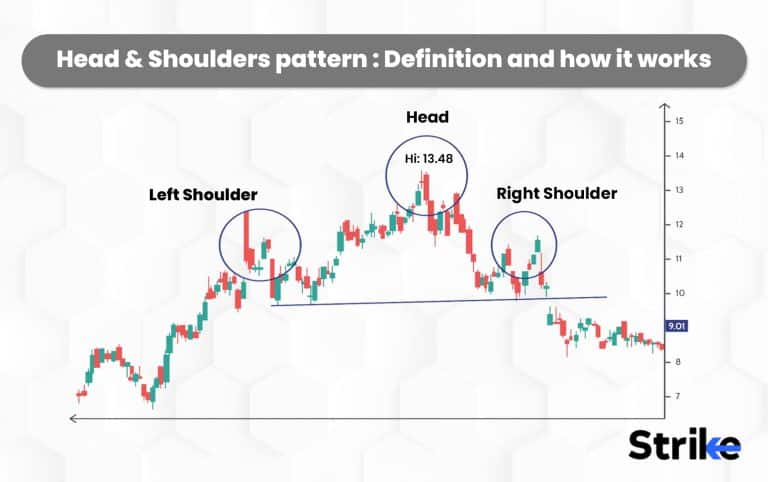
The above image depicts an example of a head and shoulders pattern. The pattern shows the security price rising from ranges of 8. The number on the right side denotes the price range in this example. The pattern starts off with a rise in price from 9. The bullish run of the pattern ends when the price reaches 12. The 12 range is considered as the peak of the left shoulder. The downtrend begins when the pattern is completed.
The pattern consists of both bullish and bearish candlesticks but the overall trend is a downward one. The price reaches a trough/ low near 9.01. This price range is considered as the neckline of the pattern. The pattern once again raises from the neckline range to form the head of the pattern. The price ranges to a high price of 13.48 from the neckline. The peak is not maintained for long and it falls back to the resistance price of 9.01. This downtrend completes the formation of the head of the pattern.
The pattern once again rises from the neckline to near the price range of 11.68. The right shoulder is completed and the prices fall. The fall in the price this time breaks the neckline price of 9.01 and continues to have a large downtrend. The prices tend to remain below the neckline for a short period of time.
What happens after a head and shoulders pattern ?
The head and shoulders pattern is a signal of trend reversal from bullish to bearish. A downtrend is formed when the pattern is completed by following the basic criteria. The market trend after breaking the neckline starts the trend reversal and follows a bearish trend. The price of the security tends to be below the neckline of the head and shoulders pattern and if it’s the inverse head and shoulder pattern the price tends to remain above the neckline.
The prices will remain below the neckline for a short period of time. The duration for which the price will remain below the neckline depends on the trader sentiment in the market. The strength of the breakout in which the bearish downtrend is formed is a factor for it. The strength of the breakout can be measured by how far the prices have fallen below the neckline of the head and shoulders pattern.
The bearish market sentiment is considered as strong if the prices fell a greater distance than the distance from the peak of the head to the neckline. The prices falling a greater distance also denotes that the price will take an ample amount of time before rising above the neckline price.
What invalidates a head and shoulders pattern ?
The head and shoulders pattern is one of the most lucrative patterns that can be spotted and are very reliable. The reliability of the pattern depends on the fact that the pattern must be completely formed. There are 3 conditions that makes the pattern invalid they are :
- Breaking the neckline :- The head and shoulders consist of 4 main components and the neckline is the integral one. It should be noted that the neckline of the pattern must not be broken before it is completed. The price ranges of the head and shoulders pattern must always stay above the neckline.
- Reverse movement after breakout :- Another situation that causes the head and shoulders pattern to turn invalid is the reverse movement of the price above the neckline price after the pattern has been completed. The buyers may push the prices above the neckline of the pattern after the pattern has been formed causing the downtrend not to form. This invalidates the pattern as market movement cannot be predicted.
- The vertical distance :- The vertical distance between the neckline and the peak of the head is measured to book profits after the break out happens. The pattern is considered invalid if the prices that experience a down trend do not fall the same distance as the distance from the peak of the head to the neckline or a distance close to this. If the pattern is not able to predict the magnitude of the downtrend movement the pattern is considered to be of no use to the traders. The pattern’s main purpose lies with the capability to measure the downtrend movement.
These are the 3 major situations where the head and shoulders pattern do not follow the basic criteria thus making it an invalid pattern.
Are head and shoulders bullish or bearish ?
The head and shoulders pattern provides a bearish outlook pattern. The normal head and shoulders pattern indicates a bearish downtrend that is upcoming. This head and shoulders pattern will begin from the end of an uptrend and it ends with a downtrend. The pattern will be in a price range till the neckline is broken. The head and shoulders pattern is thus bearish in its prediction about the market trend as it starts the pattern ends with demand exhaustion.
Is head and shoulders bottom bullish ?
Yes. The inverse head and shoulders pattern also referred to as the head and shoulders bottom provides a bullish outlook. The inverse head and shoulders pattern is similar to the conventional head and shoulders pattern but it is the opposite in nature.
The inverse head and shoulders pattern predicts a bullish up trend. The pattern starts to form from a bearish downtrend. The pattern will continue to be in a price range till the neckline is broken. The head and shoulders bottom is thus bullish as the pattern ends with sellers exhaustion and buyers taking control.
The head and shoulders pattern thus appears to predict both up trend and down trends in the market and can be considered both bearish and bullish depending on the type of head and shoulders pattern that is thus formed.


 Previous Article


![15 Investing.com Alternatives [Free+Paid] You Should Use in 2026](https://www.strike.money/wp-content/uploads/2026/04/Investing.com-Alternatives.jpg "15 Investing.com Alternatives [Free+Paid] You Should Use in 2026 40")
![15 TradeStation Alternatives [Free+Paid] You Should Use in 2026](https://www.strike.money/wp-content/uploads/2026/04/TradeStation-Alternatives.jpg "15 TradeStation Alternatives [Free+Paid] You Should Use in 2026 41")
![15 Chartink Alternatives [Free+Paid] You Should Use in 2026](https://www.strike.money/wp-content/uploads/2026/04/Chartlink-Alternatives.jpg "15 Chartink Alternatives [Free+Paid] You Should Use in 2026 42")


 : Definition, Formula, calculation, Uses, Advantages Vs limitations 46")


No Comments Yet.