Elliott Wave Theory, is one important method of technical analysis that finance traders use to analyze financial market cycles. The Elliot Wave theory was created in the 1930s by Ralph Nelson Elliott and is based on the premise that financial markets, as well as other collective human activities, move in repeated patterns or waves.
According to the hypothesis, these patterns can be detected and used to forecast future market behavior. The Elliott Wave Principle is based on five waves in the trend’s direction and three waves in the trend’s corrective or retracement. The theory specifies particular rules and recommendations for recognizing and categorizing certain wave patterns, such as wave direction, length, and momentum.
The Elliott Wave Theory is frequently utilized to make informed trading decisions in the stock, Forex (FX), and commodities markets.
What is the meaning of Elliot Wave Theory?
The Elliott Wave Theory is a technical analysis concept used to forecast financial market trends, particularly in the stock market. Elliot Wave Theory is a technical analysis approach that suggests that financial markets, such as stocks or currencies, move in a series of predictable and repetitive waves. These waves reflect the natural behavior of market participants, who alternate between optimism and pessimism as they react to various economic and financial events.
Trend analysis, support and resistance levels, and chart patterns are other technical analysis methods employed in the stock market. The Elliott Wave Theory’s accuracy in forecasting future price changes is a source of contention among traders and analysts. While certain supporters say that the theory can provide useful insights into market behavior, others challenge its dependability and efficacy.
What is the background History of Elliott Wave Theory?
Ralph Nelson Elliott created the Elliott Wave Theory in the 1930s. Elliott was a competent accountant who noted that stock market values moved in a definite pattern, which he referred to as “waves”. He developed his idea by combining complicated mathematics with market data. Below is an image of what these waves can look like.

Elliott’s discovery that market prices moved in repeating cycles inspired the Elliott Wave Theory. He saw that following a price fluctuation, the market will pause and consolidate before continuing in the opposite direction. Elliott felt that these cycles may be foreseen and utilized to forecast market prices in the future.
Elliott Wave Theory is predicated on the idea that markets move in cycles. The cycles are made up of five waves in the same direction as the main trend, followed by three corrective waves in the opposite direction. Elliott felt that market prices followed a predictable pattern, which can be utilized to forecast future market moves.
Traders and investors employ Elliott Wave Theory to anticipate probable market moves. Elliot Wave Theory is an essential component of technical analysis and is used to assist traders and investors in making more informed decisions. Traders and investors utilize Elliott Wave Theory to maximize profits and avoid losses by forecasting probable support and resistance levels.
How does Elliott Wave Theory function?
Elliott Wave Theory is a technical analysis concept that aims to anticipate stock price movements in the future. Ralph Nelson Elliott invented it in the early twentieth century. According to the hypothesis, stock prices follow recurrent wave patterns that may be forecast by evaluating previous price data.

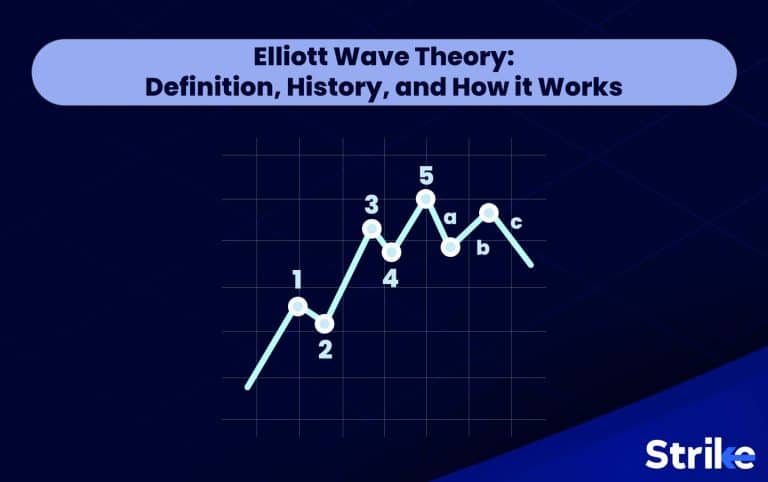
Stock prices move in a predictable pattern of impulse and corrective waves, with each wave serving a specific purpose, according to the idea. The impulse wave represents the market’s movement in the direction of the trend, whereas the corrective wave describes the market’s response against the trend. According to Elliott’s Wave Theory, the market moves in five waves in the direction of the trend, followed by three corrective waves. The five waves look like below.
Elliott Wave Theory is useful for stock traders and investors because it gives insight into market psychology, which can be utilized to create more accurate forecasts regarding the direction of stock prices in the future. Using this idea, traders predict if a trend is poised to reverse or continue and capitalize on present market circumstances.
How to trade using Elliott Wave Theory in the Stock Market?
Elliott Wave Theory uses the observation that stock prices often move in repetitive cycles. Traders look for a pattern of five consecutive waves, with the third wave being the longest and strongest. The theory predicts that after the completion of this 5-wave sequence, prices will reverse direction. For example, see the graph below.

Take Reliance Industries as an example in the stock market of how to trade utilizing the Elliott Wave Theory. Reliance Industries is a significant Indian company that operates in nearly every sector of the Indian economy. We can see from the price movement of this company that it has moved in a 5-wave pattern during the last several months.
The third wave, which is usually the longest and most powerful, has been particularly evident. As a result, traders should consider that a fourth wave is likely to begin and that the price may soon move in the other direction. Traders potentially profit from this price reversal by entering a trade in the opposite direction of the third wave.
How often do Traders use the Elliott Wave Theory for Analyzing Stock Market Prices?
Elliot Wave Theory, despite its antiquity, is still frequently utilized today, particularly by technical analysts. It is regarded to be especially efficient when combined with other indicators like candlesticks and volume charts.
Experienced traders frequently depend on this idea to make educated judgments when entering and departing the market. Furthermore, Elliot Wave Theory is used to generate price objectives with reasonable accuracy, making it a valuable tool for investors.
What are the Five Wave Patterns (Motive) of Elliott Wave Theory?
There are five wave patterns for Elliot Wave Theory. They have named waves one to five. Look at the below graph to see how the waves look.
- Wave 1
Wave 1 begins the accumulation phase and the formation of the five-wave pattern. Wave 1 can be difficult to identify as it often looks as a short pullback against the previous trend. Compared to other waves, Wave 1 is highly uncertain. This is why traders confirm the establishment of Wave1 after the formation of Wave 2.
- Wave 2
Wave 2 marks the bottom of a five-wave structure. Wave 2 is comparatively shorter than Wave 1 as it must not go below the bottom of it. The pattern is considered as flawed if Wave 2 breaks below Wave 1. Wave 2 is a retracement of Wave 1. It goes against the direction of Wave 1.
- Wave 3
Wave 3 is the longest and strongest wave in a five-wave structure. Wave 3 is an extension of Wave 1. Traders often try to catch this wave as it offers an explosive price move. This wave represents the confidence of market participants in the newly established trend. Compared to other waves, Wave 3 is easy to spot because of its length.
- Wave 4
Wave 4 is the final retracement of a five-way structure. Wave 4 is comparatively weaker than Wave 2. This is why, Wave 3 and Wave 4 together often look like a wage or a flag and pole chart pattern. On the other hand, if Wave 4 goes below the bottom of Wave 3, then the five-wave pattern is considered as flawed.
- Wave 5
Wave 5 is the final wave of a five-wave structure. Wave 5 marks the end of the newly established trend and indicates that a correction is pending in the market. This wave is typically the weakest wave in a five-wave structure. Generally, traders and investors start booking their profits as the Wave 5 is the final impulse move of the existing trend.
What are the Three Wave Patterns (Corrective) of Elliot Wave Theory?
Three-wave patterns or Elliott Wave corrective patterns usually occur after the completion of the five-wave pattern. The three-wave pattern is a move that is against the established trend. The three waves in the three-wave pattern are –
- Wave A
Wave A is the first corrective wave. Wave A is a sharp retracement of Wave 5 as it moves against the established trend and confirms a price correction. As the move is strong and sharp, traders can identify Wave A with ease.
- Wave B
Wave B is the second corrective wave. Wave B forms in the direction of the previously established trend as the market participants try in resuming the trend. It must not go above the high of Wave A. The corrective wave pattern is flawed and the price can continue to go in the direction of the existing trend, if it breaks the high of Wave A.
- Wave C
Wave C is the third corrective wave. Wave C resumes the correction and breaks below the low of Wave B. The length of this wave is generally higher than the length of Wave B. Wave C officially marks the correction of the previous five-wave structure.
Which Elliot Wave is the strongest?
Wave 3 is the strongest wave amongst all Elliot wave patterns. Wave 3 is often driven by the optimism and confidence that market participants show in the existing trend. Due to its length, Wave 3 is also easier to spot.
Which Elliot Wave is the weakest?
Wave 5 is the weakest wave amongst all Elliot wave patterns. Wave 5 marks the top of the Elliot wave’s five-wave pattern. Investors and traders look to book their profits in this wave.
How to Calculate Elliot Wave Theory?
Calculating Elliot waves can get tricky as the reading of these waves is largely subjective. Elliott wave theory is also largely criticized due to this factor. But as you practice with these waves, your eyes get used to identifying these waves. Here are 3 tips that will help you in identifying Elliot waves –
- Trend identification –
The first and foremost step in calculating the waves is to first identify the main trend. This step will be much easier for you if you are used to reading charts. On the other hand, try reading the chart and understand the uptrend and downtrend structure in the chart if you are a beginner.
- Mark the Elliot waves –
Now that you have successfully identified the trend, it is time for you to mark the waves with the help of the rules and guidelines of Elliott wave theory. Remember, the more you practice, the better you will get at accurately identifying the motive waves.
3. Use another technical indicator –
Using another technical indicator will enhance your edge. Traders often use technical indicators such as RSI (Relative strength index) and Fibonacci retracement to further predict the top and bottom of a pattern.
What are the Elliot Wave Theory Rules and Guidelines?
Elliott wave theory’s rules and guidelines ease the identification of waves for a trader. Elliott wave theory consists of 5 simple rules and guidelines –
- Motive waves or impulse waves are a five-wave pattern. It should always have 5 waves that are known as Wave 1, 2, 3, 4, and 5 respectively.
- Corrective wave is a three-wave pattern. It should always have 3 waves that are also known as Wave A, B, and C.
- In a five-wave structure, Wave 2 should never go below the low of Wave 1. The pattern is considered to be incorrect if wave 2 violates the bottom of wave 1.
- In motive waves, wave 3 can never be shorter than wave 1 and wave 5.
- In a five-wave structure, wave 4 cannot go below the low of wave 3.
How to use Elliot Wave Theory in Technical Analysis?
Elliott wave theory is a technical analysis tool that is mostly used to forecast price movements. Elliott wave theory analyzes the collective market behavior and predicts price movements based on the repetitive nature of the market. Here are 2 things you can follow to further enhance the Elliott wave theory in technical analysis –
- Use the Elliot wave theory with other technical indicators –
Using the Elliot wave theory with other technical indicators will certainly improve your chances of correctly predicting a potential top or bottom. Traders use RSI (Relative strength index) and look for a bullish or bearish RSI divergence at the end of a bullish or bearish Five-wave pattern. Traders also use Fibonacci retracement and extension to predict the potential top or bottom of a five-wave pattern.
- Look for reversal candlestick patterns at the end of a five-wave pattern –
Reversal candlestick patterns play a very crucial role when it comes to reading a price chart. For example, an evening star at the end of a bullish five-wave pattern will add double confirmation to the fact that a potential correction is pending and it is the right time to book profits and vice versa.
What is an example of Elliot Wave Theory?
Examples of Elliott wave theory can be seen in every price chart. Following is an example of the Elliot wave theory on a Nifty 50 chart –
As you can see in the above image, this is an example of the Elliot wave theory on a daily chart. The above example fulfills every rule and guideline of the Elliott wave theory. For example –
- Wave 2 has not violated Wave 1’s low
- Wave 3 is the longest and strongest wave in this five-wave structure
- Wave 4 has not violated Wave 3’s low
What is the relation between Elliot Wave Theory and Fibonacci?
Elliot waves and Fibonacci tools are used by traders to identify the potential support and resistance of a price chart. Elliott wave theory and Fibonacci tools are often used together.
Fibonacci retracement is used in the Elliot wave theory to identify the potential retracement levels of the waves. Fibonacci ratios like 0.38%, 0.50% and 0.618% are given much significance. Whereas, Fibonacci extension is used to further predict the extent to which a wave can go. Ratios like 1.27%, 1.414% and 1.618% are given much importance.
What do the Critics say about Elliott wave theory?
Elliott wave theory has been a subject of controversy ever since it was founded. Following are the 3 most common things that critics argue when it comes to the Elliot wave theory –
- Elliott wave theory is too subjective –
Elliott wave theory requires a trader to analyze the chart carefully and mark the waves which he thinks are correct. Critics claim that two traders looking at the same chart can end up marking different waves. This leads to confusion and can also lead to faulty analysis of the price chart.
- Elliott wave theory is hard to understand –
Elliott wave theory is the practice of identifying waves and predicting future price movement. Critics argue that identifying the waves effectively can get too complex and confusing for a beginner and even an experienced trader.
- Elliott wave theory cannot adapt to the nature of the market –
As the market is constantly changing and evolving, critics argue that the ideology behind the Elliott wave theory says that the market moves in predictable waves. This can prove to be incorrect as every price movement is unique and is affected by various market factors.
What is the advantage of Elliot Wave Theory?
Elliott wave theory has been a subject of controversy for a long time but it does have its advantages. Following are the 3 major advantages of the Elliot wave theory –
- Universal adaptation –
Motive and corrective waves can be seen on every stock, commodity, currency price chart. The Elliott wave theory offers many opportunities across all types of markets.
- Identifies the main trend –
Elliott wave theory helps a trader in identifying the main trend of the market. Elliott wave theory can help a trader in predicting a pending correction in the market as well. This helps a trader in taking his trading related decisions.
- Enhances a trader’s edge when used with other indicators –
Elliott wave theory can be used with other technical indicators. Traders use indicators like RSI and Fibonacci to effectively predict the potential support and resistance on a price chart.
What is the limitation of Elliot Wave Theory?
The limitations of Elliott wave theory are the main reason why it faces much criticism. Following are the 3 limitations of the Elliot wave theory –
- Elliott wave theory is highly subjective –
Elliott wave theory requires a trader to mark the waves according to his own individual perception about the current market data. This can result in confusion as other traders can interpret the same data differently and mark the waves in a completely different way.
- Elliott wave theory is difficult to understand –
As a beginner trader, identifying and marking Elliot waves correctly can get very difficult. This results in faulty analysis of the price chart.
- Elliott wave theory believes that market moves can be predicted –
The stock market is constantly changing and is affected by various other factors constantly. Sometimes, prices can move drastically because of the latest news in the market and it may not move according to its past market data.
Is the Elliot Wave Theory accurate?
No, Elliott wave theory cannot be accurate at all times. The accuracy of the Elliot wave theory depends on factors like liquidity, market situation, the ability of a trader to mark Elliot waves correctly, etc.
At the same time, it is also important for traders to understand that no technical tool can be accurate 100% of the time. There is no holy-grail strategy when it comes to the stock market.
Is Elliot Wave bullish or bearish?
Elliot waves can be both bullish or bearish. Elliott wave theory can help a trader predict the market’s potential top as well as the bottom. During an uptrend, a trader can mark the five-wave pattern in a downward to upward fashion. Similarly, during a downtrend, a trader can mark the five-wave pattern in an upward to downward fashion.
Is Elliot Wave good for trading?
Yes, Elliot waves can prove to be good for trading. Elliot waves are beneficial as it helps a trader in identifying a potential entry and exit point. Elliott wave theory is also used to identify major trends and potential corrections in the market.
But it should also be noted that like all other technical indicators, Analysis based on Elliot wave theory will not work every time.
Is it hard to learn Elliot Wave theory?
Yes, Elliott wave theory can get hard to learn. Learning Elliot wave theory gets difficult due to the fact that it involves identifying and marking complex market patterns. It takes time for a trader’s eyes to get used to identifying Elliot waves.
It should also be noted that as you spend time practicing on a chart, you will be able to identify and mark Elliot waves successfully.
Can you also use Elliot Wave Theory in Fundamental Analysis?
No, you cannot use Elliot wave theory in fundamental analysis. Elliot wave is a technical analysis tool which predicts the future price movement based on the previous market data.
However, you can use Elliott wave theory along with fundamental analysis. For example, if a company has declared bad earnings and their stock chart has just completed a five-wave structure, then it is most likely that the company’s stock will correct and in this case, you can take a short position with conviction.
Which is more accurate, Elliot Waves or Candlestick Pattern?
It is difficult to compare the accuracy of Elliot waves and candlestick patterns. The accuracy of Elliot waves and Candlestick patterns depends on factors like liquidity, market situation, a trader’s skill etc.
However, traders can use both of these tools together to enhance their edge in the markets as both tools are used for identifying the potential tops and bottoms within a price chart.


![15 Investing.com Alternatives [Free+Paid] You Should Use in 2026](https://www.strike.money/wp-content/uploads/2026/04/Investing.com-Alternatives.jpg "15 Investing.com Alternatives [Free+Paid] You Should Use in 2026 28")
![15 TradeStation Alternatives [Free+Paid] You Should Use in 2026](https://www.strike.money/wp-content/uploads/2026/04/TradeStation-Alternatives.jpg "15 TradeStation Alternatives [Free+Paid] You Should Use in 2026 29")
![15 Chartink Alternatives [Free+Paid] You Should Use in 2026](https://www.strike.money/wp-content/uploads/2026/04/Chartlink-Alternatives.jpg "15 Chartink Alternatives [Free+Paid] You Should Use in 2026 30")
: Overview, 10 Types of Indicators, Settings for Different Markets 32")

 : Definition, Formula, calculation, Uses, Advantages Vs limitations 34")


No Comments Yet.