The Average Directional Index (ADX) is a technical indicator used by traders to measure the strength and momentum of trends. ADX measures this strength irrespective of the direction and traders use it to spot potential market reversals as well as determine how strong current trends are for specific scripts.
On a scale of 0 to 100, readings below 20 indicate a weak trend while 40 or above indicate stronger ones. The higher an ADX reading, the stronger is a trend.
The ADX is an important indicator for traders as it measures trend strength. The ADX tells traders whether or not entering trades following that direction is worthwhile based on how strong or weak a trend is. Strong trends often continue for extended periods; falling ADX levels signal a weakening of trends, indicating a reversal. The ADX below 20 signals the end of that particular trend while it also confirms other indicators like MACD or RSI for stronger trading signals.
The ADX indicator is applied virtually to every market including stocks, forex, commodities and indexes. It can be applied on all the time frames.
In this video, we will learn how ADX helps in your trading.
The ADX helps traders identify high probability trading opportunities with high potential returns in trending markets.
What is Average Directional Index (ADX)?
The Average Directional Index (ADX), created by J. Welles Wilder in 1978, measures the strength of market trends regardless of their direction.
Higher ADX values indicate stronger trends while lower ones suggest non-trending markets or weak ones. ADX doesn’t give any information regarding which direction a trend takes; only its intensity.
: Definition, How it Works, Importance, Calculation, and Trading 91")
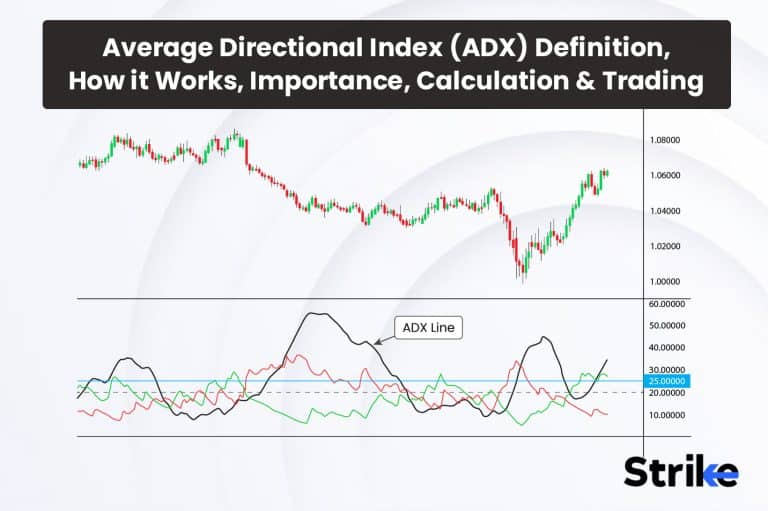
In the image uploaded above, one can observe how the ADX indicator is applied on the candlestick chart.
The ADX uses two sub-indicator lines;
+ DI ( Plus Directional indicator) (Blue color)
– DI (Minus Directional indicator) (Orange color)
ADX line (Red color)
ADX is computed by applying a moving average (typically exponential) to the absolute difference between +DI and -DI values, divided by their sum. This results in an ADX value between 0 and 100 that serves as an index measure.
How does the Average Directional Index (ADX) Indicator work?
The Average Directional Index (ADX) indicator works by measuring the strength and momentum of a trend, regardless of whether it is up or down.
The ADX uses two subordinate indicators – the Plus Directional Indicator (+DI) and Minus Directional Indicator (-DI).
The +DI measures upward price momentum and trend strength.
The -DI measures downward price momentum and trend strength.
The ADX takes the absolute values of the +DI and -DI, removing the trend direction. It then creates a moving average to smooth out their values. The result is the single ADX line which oscillates between 0 and 100.
How important is the Average Directional Index (ADX) in Technical Analysis?
The Average Directional Index (ADX) is important in technical analysis because it measures the strength and momentum of any trend to help determine opportunities within any market.
The ADX provides traders with an objective method for identifying when trends are strong enough for trading by measuring rising or falling momentum.
Strong trends tend to continue, making the ADX useful in finding opportunities to trade against it and when trends slow or reverse unexpectedly. Conversely, it also warns traders whenever those trends become less dominant and are possibly ready to change direction suddenly. Early detection and identification are essential components to ensure trading success and the ADX offers valuable analysis of trend quality and potential inflection points.
The ADX does have some restrictions, but when used effectively, it significantly enhances a trading strategy. It works across markets and timeframes, and its applications span every trading style.
The ADX contributes significantly to sound risk management practices. By measuring trend strength, it aids traders in avoiding trading weak or reversing trends where losses are greater, and indicates potential trend changes before they occur, allowing traders to exit positions.
Effective risk management is vital to successful trading. The ADX is also used to confirm signals from other indicators, like price action, momentum oscillators and moving averages. Multiple analysis techniques agree on a signal opportunity, which increases traders’ confidence level significantly.
How to Calculate ADX?
To calculate, one has to know of the six-step process.
- Calculate the +DI
Current High – Previous High / Previous High – Previous Low * 100
- Calculate the -DI
Current Low – Previous Low / Previous High – Previous Low * 100
- Take the absolute values of +DI and -DI
- Add the +DI and -DI values
- Divide the sum by 2 to get DX
- Take a 14-period (or your choice) MA of DX to get the final ADX value
Let us take a detailed look at each step below.
Calculate the Plus Directional Indicator (+DI)
The +DI measures upward price momentum.
Formula: +DI = (Current High – Previous High) / (Previous High – Previous Low) * 100
For example:
Current High = Rs. 50
Previous High = Rs. 45
Previous Low = Rs. 40
+DI = (Rs. 50 – Rs. 45) / (Rs. 45 – Rs. 40) * 100 = 10/5 * 100 = 200
Calculate the Minus Directional Indicator (-DI)
The -DI measures downward price momentum.
Formula: -DI = (Current Low – Previous Low) / (Previous High – Previous Low) * 100
For example:
Current Low = Rs. 35
Previous Low = Rs. 38
Previous High = Rs. 45
Previous Low = Rs. 40
-DI = (Rs. 35 – Rs. 38) / (Rs. 45 – Rs. 40) * 100 = -3/5 * 100 = -60
Take the absolute values of +DI and -DI
This removes the trend direction and leaves the magnitude of momentum.
+DI = 200
-DI = -60
Absolute +DI = +200
Absolute -DI = +60
Add the +DI and -DI values
This sums the total upward and downward momentum.
+DI = +200
-DI = +60
+DI + -DI = +200 + +60 = +260
Divide the sum by 2: This calculates the average momentum and results in the DX value.
(+DI + -DI) / 2 = 260 / 2 = 130 = DX
Take an X-period moving average of DX to smooth the values
This results in the final ADX value. A 14-period moving average is commonly used.
14-period MA of 130 = ADX = 24
But how do you gauge the ADX value you just got?
The ADX value ranges from 0 to 100. Readings below 20 indicate a weak trend, readings above 40 indicate a strong trend and readings over 50 indicate an extremely strong trend. As the ADX rises, it signifies that momentum and trend strength are increasing. As the ADX falls, it signifies decreasing momentum and trend strength.
How to trade using the Average Directional Index (ADX)
The primary consideration to trade using the ADX is the ADX value. Let us look at three examples to understand this better. The ADX is rising above 40 indicates a strong trend. Traders look for entries in the direction of the trend. For example: in the chart uploaded below ADX (red line) rising above 40 (marked black line) is indicating a strong trend. The trader, in this case, looks for buy signals from other indicators like price action to enter long positions. As the ADX continues rising or stays above 40, it confirms the trend is strengthening, so the trader stays positioned for further gains. The ADX begins falling when the trader exits to lock in profits.
: Definition, How it Works, Importance, Calculation, and Trading 92")
The ADX below 25 signifies a weak trend. Traders fade the existing trend expecting a reversal. For example: in the chart uploaded below ADX (Red line). ADX declines to 15 signaling a weak downtrend. The trader longs anticipating an uptrend reversal which is spotted by the purple box on the candlestick chart. Consider the price action confirmed with a reversal candlestick pattern, the trader adds to the position on trend confirmation. The failure of the reversal immediately indicates the weak trend with the ADX suggesting the eventual loss of momentum. The rising ADX or ADX at a high level begins to fall and warns that trend momentum is slowing and a reversal is to occur. Traders look for price action reversal patterns to indicate the trend change.
: Definition, How it Works, Importance, Calculation, and Trading 93")
For example: ADX rises to 45 signaling a strong uptrend. The trader buys to ride the trend. ADX then begins falling over the next few periods. The trader exits the uptrend position and tightens their stop loss. Price forms a bearish engulfing pattern, signaling the uptrend reversal. As ADX falls below 20, in the chart uploaded below, the trader shorts to profit from the new downtrend. ADX provides an early reversal warning to exit the uptrend, forming an appropriate candlestick pattern and enter the downtrend.
: Definition, How it Works, Importance, Calculation, and Trading 94")
What trading strategy is best for Average Directional Index (ADX)?
Trend trading, reversal trading and breakout trading are three major strategies traders use with ADX.
Trend Trading Strategy uses the ADX to determine when trends are strong enough to trade. Let us look at an example to understand this.
ADX has 2-3 extreme levels in which, if a stock is crossing above or below these levels, potential trend confirmation on short term and long term perspectives can be generated. ADX has extreme usefulness in confirming if the trend is strong or not.
As these indicators are available on all the trading platforms, it is quite cumbersome to scan every stock and check if they are above a certain level or not. The next step is analysis of those scanned stock to further qualify them into a quality setup and further initiate a trade plan and execution.
Strike.money is one of the finest scanners available for Indian Stock Markets. If you run a scanner named ADX scanner under technical scanners, it will display the list of all the stocks that are fulfilling the conditions of an ADX level that provides important information. Strike.money has 4 critical conditions in their scanner; like;
- +DI line crossing above -DI line.
- -DI line crossing above +DI line.
- ADX crossing above [ 25 level, 50 level, 75 level ]
- ADX crossing below [ 25 level, 50 level, 75 level ]
We’ll see two examples:
+DI line crossing above -DI line:-
: Definition, How it Works, Importance, Calculation, and Trading 95")
In the example above, Strike.money scanned the list of stocks from ALL BASKET (All the listed stocks) and displayed all the stocks that are fulfilling the condition or criteria like +DI line crossing -DI line.
When +DI Line crosses -DI line, it is considered that a potential bullish trend may emerge and trade opportunities can be generated on a long side. Traders may take this insight and deep dive into lower time frame analysis to further initiate a trade plan and place proper trades.
In the chart above, look at the purple box on the ADX indicator below the candlestick chart. The intersection represents the last time the +DI line crosses the -DI line and one can observe how a trend emerged on a bullish side. Traders could have found long opportunities in a lower time frame.
After a long time, the stock’s ADX indicator is giving a signal of +DI line crossing -DI line. This way, a bullish opportunity can be found by analyzing the stock with other indicators and price action analysis on different time frames to postulate a trading plan.
ADX levels above 25:-
Risky and short term traders on Daily time frames often check ADX levels above 25, if it sustains above 25, it is considered a strong trend for short term perspectives and traders try to find potential high probability trading setups on lower time frames like 15m, 5m and even 3min
Example is attached in an example below:
: Definition, How it Works, Importance, Calculation, and Trading 96")
Strike.money ran a scan for the F & O basket selected and provided a list of 3 F&O stocks that are showing their respective ADX above 25 level. Example shows DABUR. The last time ADX rose above level 25, stock rose sharply, and even when it slipped below 25, the stock continued to trend upwards slowly before losing the strength. After a long time, ADX for DABUR has crossed above 25 level indicating a potential trend that can stay established. Traders can therefore deep dive into lower time frames and find potential trade opportunities.
Risk averse traders who trade on a long term basis can find trading opportunities when ADX of the respective stock crosses level 40-50. Highest extreme is 75. Strike.money provides the scan for ADX crossing above and below level 25, 50, 75.
Reversal Trading Strategy uses ADX to spot trend reversals early.
Few traders also find ADX above 35 level to provide crucial opportunities on a short term basis.
Traders expect ADX to bounce from 15 level. Thus, traders find reversal trade setups from when the ADX goes below 15. This strategy allows you to capture profits from trend reversals.
Traders are advised not to be solely dependent on ADX. As this is a mere indicator that should be used alongside price action methods and other indicators to solidify robust trading opportunities. It fails to work in markets when they are in consolidation or a highly volatile phase.
Breakout Trading Strategy uses ADX to determine when breakouts have enough trend support to be valid.
For example, if a stock has been consolidating in a tight range, fakeouts and false trading signals can be avoided by using ADX alongside.
For a confirmed breakout, ADX above 35 – 40 is recommended. If a proper breakout has occurred with suitable candlestick patterns, signals from other indicators and ADX above 35-40 can increase the confidence of the trader to further confirm the trade signal and postulate trading plan accordingly.
: Definition, How it Works, Importance, Calculation, and Trading 97")
The chart uploaded above clearly distinguishes between a real breakout and a fake out.
When the breakout on price occurred with the ADX above 35, it respectively gave an upside where as when the ADX kept staying below 35 level, the breakout failed, highlighted in the purple box and a false breakout was identified and a trade was avoided.
If the breakout occurs but ADX oscillates around 20, the traders consider the breakout weak and may avoid the setup. This strategy allows you to avoid false breakouts by only participating once ADX confirms the trend is strong enough.
When is the best time frame for trading Average Directional Index (ADX)?
The best time frame for trading ADX is on higher time frames like Daily, weekly and monthly. Traders are advised to understand that ADX is not a sole indicator that is worth depending on entirely. It is a classic indicator that can be used alongside other indicators and price action methods to solidify a trading plan to gather stronger confluences to confirm a trading setup. Daily charts with ADX are excellent for intraday trading strategies and capturing short to medium-term trends.
Traders often check for crucial ADX levels for stocks on Daily time frame and use this knowledge to deep dive into lower time frames to analyze further and postulate a high probability trading setup.
For swing trading or position trading, the weekly chart with ADX is an ideal combination. Weekly ADX analysis is used to monitor longer-term trends in all markets.
When is the best time period for trading Average Directional Index (ADX)?
The best time period for trading ADX is 14-period length. Though, the ADX indicator is used on any timeframe from short-term charts to long-term charts, choosing some significant period
The default setup for ADX is fixed at 14-period length. Traders often change these settings to experiment with the working of ADX with different period lengths; few of the traders often use 7-period length to get higher frequency of trading setups.
These traders experiment and observe the stocks with ADX 7-period length setting and Daily Time Frame candlestick charts to find higher frequency of trades to appear above ADX levels 35 or 40. The stocks are selected from these customized ADX periods and trading opportunities are hunted on lower time frames.
: Definition, How it Works, Importance, Calculation, and Trading 98")
How can the ADX improve trading methods with other Indicators?
ADX improves trading methods with other indicators by providing trend strength context and confirmation. For example, ADX helps determine when overbought or oversold conditions are more likely to lead to trend reversals versus retracements when combined with the RSI indicator. The RSI measures the relative strength of bulls and bears in the market on a scale of 0 to 100. Readings over 70 indicate an overbought market and readings below 30 indicate an oversold market.
These extreme levels suggest a reversal is imminent. However, in a strong trend, the RSI remains overbought or oversold for a sustained period while the trend continues. This is where ADX provides important context. The ADX above 25 and RSI reaching overbought is an indication of a strong trend that will be likely to stay constant. The trend is strong enough to remain overbought and continue higher. Let us look at an example to understand this better.
From the chart uploaded below, analysts can observe that whenever ADX rose above 25 on Daily time frame of the stock and RSI stayed in the overbought phase, the trend of the stock remained bullish for a long time and whenever ADX stayed below 25 and RSI kept oscillating in the middle area, the chart gave false signals which could have got avoided by using RSI with ADX.
: Definition, How it Works, Importance, Calculation, and Trading 99")
What is the best combination with the ADX indicator?
The five best combinations where ADX works the best are price action, RSI, MACD, Moving Averages, Stochastics, and Pivot Points. ADX measures trend strength, while price action analysis determines trend direction and reversal points. Candlestick patterns, support/resistance, pivots, etc. integrated with ADX and price action confirms the actual buy and sell signals. ADX is non-directional, so price action complements it perfectly.
ADX works well with RSI as well by determining when overbought/oversold levels are more likely to lead to reversals versus retracements within strong trends. As RSI diverges from price and ADX, it signals loss of momentum and reversals.
ADX verifies that MACD crossovers are supported by a strong enough trend to act upon. ADX ensures MACD signals are in alignment with the current trend strength or reversal status. The divergence between MACD and ADX also points to momentum loss and trend changes.
ADX determines the period the trend is robust enough for price to continue moving away from a Moving Average. For example, a close above the 200-period MA in an uptrend with ADX rising into the 40’s or higher suggests a strong breakout that holds. But a close above the 200 MA when ADX is below 20 indicates limited trend support for this “breakout” – the chance of falling back below the MA is higher. ADX also confirms MA crossover signals are supported by real trend momentum before acting on them.
ADX reflects periods that mark retracements (ADX strong) or reversals (ADX weak) in the Stochastics overbought/oversold levels. Stochastics crossovers also depend on ADX to verify a strong enough trend is in place to move price significantly after the crossover signal. ADX ensures Stochastics signals align with the major trend.
Can other market analysis indicators replace the ADX?
No, ADX uniquely measures what matters most for trend analysis – the intensity and sustainability of the underlying trend. For this reason, ADX is a component of any robust trading method and is not directly replaceable by other indicators. The key is using ADX in combination with other analysis techniques like price action, moving averages, RSI, pivot points, etc.
Is the ADX suitable for the Stock Market?
Yes, The Average Directional Index definitely helps in trading stocks, but it has some pros and cons traders must keep in mind. The main thing ADX tells you is whether a stock is trending strongly or if it’s moving more sideways without a clear direction. Big ADX readings over 25 or 30 suggest there’s a solid trend happening. Lower readings under 20 indicate a weaker trend or choppy conditions.
What is the success rate of the Average Directional Index (ADX)?
There’s no definitive success rate, it depends a lot on how it’s used. ADX is a lagging indicator – it reacts after the trend starts. So its signals end up being late sometimes. Waiting for ADX above 40 to go long makes traders miss part of the trend. Crossovers above 25/30 catch trends earlier, but you get faked out on choppy moves most of the times.
Is ADX reliable?
Yes, ADX definitely complements other analysis to time trends better. But you have to tweak the settings and use it with directional price indicators, not just on its own. No single indicator nails it 100% of the time, there’s always gonna be some losing trades. But used properly, the ADX is a useful piece of the puzzle in stocks. You just have to be aware of both the upsides and downsides with it.
What are the common challenges that traders face when using ADX?
Undoubtedly, using ADX has benefits, but there are common challenges that traders face when using ADX, which must be known to them before they choose it for analysis. It has five main disadvantages, which have been listed below.
It cannot determine trend direction
ADX only measures trend strength, not whether the trend is up or down. For actual trading signals, ADX must be combined with price action analysis or directional indicators. Without directional input, ADX alone cannot provide actionable buy and sell signals.
It lags behind price changes
ADX is based on calculations from previous periods and it lags sharp reversals or accelerations slightly. In fast markets or during high volatility, the lag is more significant. Price action must always be monitored closely, especially when ADX signals a potential trend change.
It needs optimization
The standard ADX lookback period and levels need adjustment for different instruments or timeframes. A 14-period ADX and levels of 20/40 suit some trends well but not others.
It must not be used alone
ADX alone cannot accurately reflect all market conditions and environments. For reliable signals, it must be integrated with price action and other indicators to build a robust trading strategy.It generates false signals
ADX sometimes temporarily produces misleading signals or generates excessive noise. Volatility, erratic price action, loss of trend, and other factors distort indicator readings at times and result in false signals if not approached cautiously. Proper risk management is key. Always verify signals with price action and consider other indicators to filter out fakeouts before trading aggressively.
ADX serves as a reliable trend tool for taking advantage of high-probability opportunities in the market. With the right perspective and optimization, the pros of ADX outweigh the potential downsides. As with any indicator, understand what it does and what it doesn’t do to maximize its benefits.
What are the benefits of the Average Directional Index (ADX)?
Now as the challenges have been discussed, there are certain benefits that ADX offers to traders. It is an advantageous tool for them to use. Below are seven main advantages.
It measures trend strength
ADX quantifies the momentum and intensity behind a trend. It determines when trends are strong enough to potentially continue as well as when they are weakening. ADX highlights the best opportunities. Strong trends have the highest probability of continuation.
It works on all timeframes
ADX measures trends effectively on any timeframe from short-term charts to long-term charts.
It signals early
ADX measures momentum changes, and it detects trend reversals or shifts in the existing trend before they become visually clear in the price action. Early signaling of trend changes allows trading in the direction of new trends as they start to form.
It improves timing
ADX helps time entries and exits. For example, entering a trade when ADX confirms there is sufficient trend momentum to push prices further in the trending direction, or exiting a trade when the ADX trend strength starts to decrease, as the trend seems losing momentum.
It enhances other indicators
ADX helps validate signals from other indicators like MA crossovers, RSI extremes, MACD crossovers or divergence. By confirming trend strength, ADX ensures momentum is sufficient to justify these signals. It also prevents false signals when trends are weak.
It is easy to interpret
ADX values are straightforward to understand. Readings below 20 indicate a weak or non-existent trend. Values from 20 to 40 signify an establishing trend. Readings above 35 signal a strong trend. And values over 50 reflect an exceptionally powerful trend.
It enhances risk management
ADX helps avoid trading weak or unstable trends where the risk of loss is higher. It also warns when strong trends are losing momentum, so positions are exited before reversals occur. The stronger the trend, the more aggressive you potentially are with target setting and stop placement.
What are the limitations of the Average Directional Index (ADX)?
ADX, similar to other technical indicators, has limitations. Below are seven main disadvantages of using ADX for trading.
No directional information
The ADX only measures the strength of a trend, not the direction. It does not determine if the trend is bullish or bearish. You need to look at other indicators like price action or moving averages to determine trend direction.
ADX has a lag
The ADX is a lagging indicator. It tells you about the trend strength after the trend has been established. It does not signal trend reversals. A good portion of the price move sometimes has already happened by the time ADX signals a strong trend.
False signals
The ADX indicator is prone to whipsaws and false signals. Since it measures the average of values over a period of time, it sometimes continues showing a strong trend even after the trend has started to reverse. This sometimes generates incorrect trade signals.
Default ADX setting is not universal
The default 14-period ADX setting sometimes does not suit all timeframes or trading styles. Users need to determine the optimal period setting for their needs and tune the indicator accordingly. An incorrect period sometimes leads to poor signals.
Limited to trending market
The ADX only works well in trending market conditions. The ADX repeatedly shows weak trend strength or whip back and forth when the market is range-bound with no clear trend, generating false signals. Additional filters are needed to determine trending conditions.
ADX divergence signals are limited
There are limitations in ADX divergence signals. Regular bearish/bullish divergence where price makes a higher/lower high/low but ADX does not confirm it, sometimes still results in a trend continuation rather than reversal. Confirmation from other indicators is advised.
No exit indication
The ADX does not provide any guidance on where to place stop losses or take profits. It needs to be used in conjunction with other technical analysis tools like support/resistance, moving averages, etc. to implement risk management strategies.
The ADX is best used as a filtering mechanism to determine trend strength. For trade entry and exit signals as well as trend direction, it must be combined with price action analysis and other complementary indicators. Used on its own, the ADX has limitations that sometimes lead to poor quality signals.
Is the ADX capable of predicting the direction of a trend in financial markets?
No, the ADX indicator itself cannot predict the direction of a trend; rather it measures only its strength or momentum and does not discern if a given trend is bullish or bearish. The ADX measures the difference in price spreads over 14 periods and compares it with previous 14 periods, providing a measure of momentum or strength of the trend – though the ADX doesn’t tell us whether that trend is upward or downward.
Can the ADX reveal market trend fundamentals?
No, the ADX indicator alone cannot reveal market trend fundamentals. It is simply a technical measure designed to measure price momentum and volatility and does not provide insight into fundamental drivers that explain a trend. Fundamental analysis considers economic, sectoral and company-specific factors affecting an asset’s value to ascertain whether it is increasing or decreasing; by contrast, ADX uses statistical analysis of price movements alone and does not reveal why any trend is occurring or continuing.
Can the ADX accurately analyze minute-to-hour trends?
Yes, ADX accurately analyzes minute-to-hour trends, though there are some notable limitations to the shorter-term intraday analysis. It works best when trending market conditions on daily or weekly charts. ADX sometimes only offers limited value in tracking very short-term trends for several reasons. It is because the ADX is a lagging indicator, as it requires an established trend before registering its strength.
Does the ADX consistently indicate financial market buying and selling opportunities?
No, the ADX does not consistently indicate financial market buying and selling opportunities. It serves more for a trend strength measurement and not an entry or exit signal tool. Rising ADX in conjunction with +DI above -DI sometimes provides the potential for buying opportunities as the uptrend strengthens. But its precise timing cannot be predicted with just ADX alone.
It does not indicate an ideal time to sell when selling pressures increase due to a rising -DI relative to +DI along with an increasing ADX. ADX alone cannot give a definitive buy or sell signal. ADX must be combined with other indicators to study accurate buying and selling opportunities in the financial market. These include moving averages, support/resistance levels, candlestick patterns and trendlines.
What is the difference between the Average Directional Index and The Aroon Indicator?
The Average Directional Index (ADX) and Aroon are the type of technical indicators that are used to measure the strength of a script’s trend but they have their differences.
The ADX consists of moving averages of the two directional movement index values, producing trend-strength readings that range from zero to 100.
Generally, the higher the ADX value, the stronger the trend, and the weaker or more ranging the trend, the lower the reading. As a rule, the 25 mark is used to separate strong uptrends or downtrends from weak or ranging ones, with readings greater than 50 indicating very strong trends. Analysts will find potential setups as the trend reverses if the two ADX lines cross.


 Previous Article


![15 Investing.com Alternatives [Free+Paid] You Should Use in 2026](https://www.strike.money/wp-content/uploads/2026/04/Investing.com-Alternatives.jpg "15 Investing.com Alternatives [Free+Paid] You Should Use in 2026 112")
![15 TradeStation Alternatives [Free+Paid] You Should Use in 2026](https://www.strike.money/wp-content/uploads/2026/04/TradeStation-Alternatives.jpg "15 TradeStation Alternatives [Free+Paid] You Should Use in 2026 113")
![15 Chartink Alternatives [Free+Paid] You Should Use in 2026](https://www.strike.money/wp-content/uploads/2026/04/Chartlink-Alternatives.jpg "15 Chartink Alternatives [Free+Paid] You Should Use in 2026 114")

: Overview, 10 Types of Indicators, Settings for Different Markets 117")
 : Definition, Formula, calculation, Uses, Advantages Vs limitations 118")


No Comments Yet.