The Golden Cross is one of the most monitored technical analysis indicators as it signals a change in market sentiment from bearish to bullish. The Golden Cross also tends to attract increased trader participation, as many see it as an early sign of improving momentum. Although it is not usually a sign of long-term patterns, it tends to be when a level of optimism starts to develop, volatility increases, and new trading opportunities open.
What is a Golden Cross in the Stock Market?
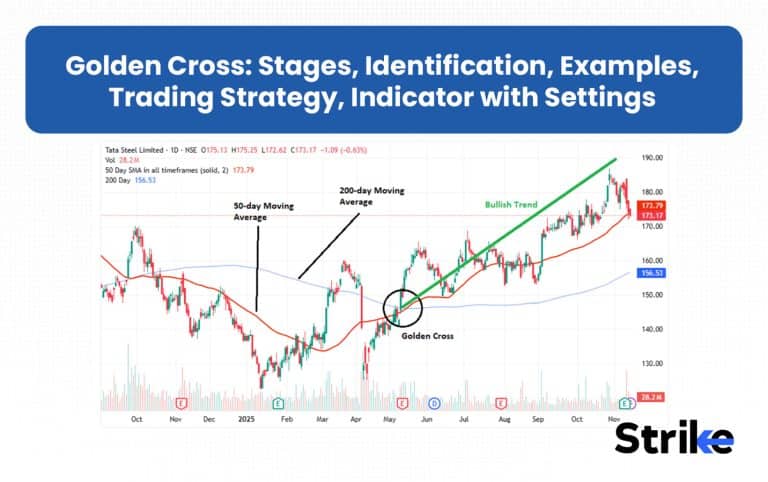
A Golden Cross in the stock market is the technical indication of potential bullish reversal in market trend. A golden cross happens when a shorter period moving average, such as 50, crosses above a longer period moving average, such as 200.

What Happens when a Golden Cross Occurs?
When the golden cross occurs, it indicates that the recent prices are rising higher than the long term prices, signaling a shift in market momentum from bearish to bullish. This is often viewed by traders and investors as a signal to buy, anticipating a sustained upward trend in stock prices.
Why is it called a Golden Cross?
It is called a golden cross because crossover of short term moving average above the long term moving average is seen as a golden or highly valuable bullish signal, representing a golden opportunity for investors. The term “ Golden” represents the optimistic outlook and strong buying opportunity.
Is Golden Cross a Lagging Indicator?
Yes, the golden cross is a lagging indicator in technical analysis because the golden cross uses a moving average, which itself works on past price data to generate signals. The golden cross indicates that market momentum has already begun shifting upward. By the time crossover occurs, price might have already rallied significantly.
The lagging nature of the Golden Cross is more useful when trying to confirm trends instead of predicting them, helping traders identify ongoing momentum rather than trying to catch reversals early—this is a classic example of Leading vs Lagging Indicators in action.
How Does a Golden Cross Work in Technical Analysis?
The golden cross in technical analysis typically works on crossing two moving averages, a short term moving average and a long term moving average.
- Short-term Moving Average: The short term moving average, usually 50 represents the recent price trend, responding quickly to recent price movement and capturing short term market sentiments.
- Long-term Moving Average: The long term moving average, usually 200 represents the recent broader market trend by smoothing out short term market volatility and fluctuation.
- The crossover: When short-term moving average crosses above long-term moving average, this cross over signals market recent price action is strong enough to influence the long term trend, which invites more traders and investors to buy and push the price up.
Together, these three stages show how a weakening downtrend transforms into a sustained bullish trend, making the Golden Cross a powerful confirmation signal for trend reversal during technical analysis.
What are the Stages of a Golden Cross?
There are three stages of a golden cross. The stages are weakening downtrend, crossover phase and uptrend continuation.
- Weakening of Downtrend: This is an initial stage when the current downtrend begins to weaken. Selling pressure decreases, and the momentum stabilizes as seller loss control. Value-oriented buyers can begin to accumulate shares silently, bringing price stability.

- Crossover Phase: The crucial point when the short term moving average (typically the 50 day) crosses over the long term moving average (typically the 200 day). This crossover will confirm the reversal of the trend and it would change the market psychology to a bullish instead of a bearish one.

- Uptrend Continuation: The new uptrend takes over and the buying momentum is further enhanced after the crossover. Both moving averages tend to have upward slopes and usually tend to find support on these lines. This step promotes involvement of the long-term investors, which consolidates the bull market trend.

Together, these three stages show how a weakening downtrend transforms into a sustained bullish trend, making the Golden Cross a powerful confirmation signal for trend reversal—one of the most practical uses of Moving Averages.
How Do You Identify the Golden Cross Formation?
There are four major steps to identify Golden Cross formation. The steps are to identify the downtrend, identify the exhaustion, crossover and confirmation.
- Look for Downtrend: Golden Cross normally appears after a long period of a declining trend, hence starting by checking whether the stock is making lower highs and lower lows. This confirms the market has been bearish for long enough for a potential trend reversal to be meaningful.

- Downtrend Exhaustion: The downwards trend begins to weaken before the crossover. You will see the stabilization of prices around a support area, a reduction in the volume of sales, and short-term candles with rejection wicks. The moving average in the short-term also starts flattening, which means that sellers are running out of control.

- Identify the Crossover: The primary indicator of a Golden Cross is when the 50-day moving average changes upward and crosses over the 200-day moving average. This crossover indicates change of momentum to a bearish to a bullish approach particularly when both moving averages are not rising with a downward bend anymore.

- Confirm with Price & Volume: An excellent Golden Cross pattern is achieved when the price closes above the two moving averages with increasing volumes. Breakouts of previous resistance and momentum charts such as RSI over 50 are also confirmation that the buyers are in charge and the bullish trend is becoming stronger.
Most Common Moving Averages Used in a Golden Cross
The most common moving averages used in a golden cross are the 50 period moving average and 200 period moving average due to their perfect balance of speed, stability, reliability, market psychology, and institutional acceptance.
However, traders with different styles often prefer alternative moving average combinations that suit their speed, risk appetite, and trading timeframe.
| MA Pair | Best For | Why Traders Use It |
| 20 & 50 MA | Swing traders | Faster confirmation while still avoiding excessive noise |
| 9 & 21 MA | Intraday traders, momentum scalpers | Provides quick signals with tight stop-loss zones |
| 10 & 50 MA | High-volatility stocks | Captures early trend shifts in fast-moving markets |
| 50 & 100 MA | Range-bound or moderately trending markets | Reduces whipsaws and gives smoother crossover signals |
| 20 & 200 MA | Long-term trend watchers | Identifies early long-term trend recovery while maintaining reliability |
Both moving averages can be used for the Golden Cross: SMA and EMA. The key difference is speed. SMA is slower and smoother, making it ideal for long-term trends, positional trading, and reducing noise. EMA is faster and more responsive, making it better for intraday trading, swing entries, and catching early momentum shifts.
Historical Examples of the Golden Cross
There are many golden crosses that have occurred in history including three major Golden Crosses. A post -global financial crisis, pre-election rally, and Post-COVID crash recovery.
1. Nifty 50 Golden Cross – April 2009 (Post-Global Financial Crisis)
Following the crash of the world financial crisis in 2008 (low around 2,500 in March 2009), Nifty 50 increased in July 2009 to around 4,500 levels. This crossover initiated the multi-year bull run, driven by global stimulus and the Indian economic recovery. The next 18 months saw the nifty rise more than 100% to about 6,300 by the start of 2011 indicating that it is one of the most powerful Golden Cross signals ever recorded in the history of the Indian market.

2. Nifty 50 Golden Cross – October 2013 (Pre-Election Rally)
A high-impact Golden Cross was created In October, 2013 near 5,700 levels, before the 2014 general elections. This was the signal of a strong bull run driven by better macro sentiment and FII inflows, and Nifty increased by more than 50% to an all-time high of 9,119 without retouching the previous lows by the beginning of 2015.

3. Nifty 50 Golden Cross – March 2020 (Post-COVID Crash Recovery)
Post the COVID-19 crash in March 2020, Nifty 50 formed a Golden Cross in June 2020 around 10,000-11,000 levels. The nifty soared about 70-80% to about 18,600 by the end of 2021, due to stimulus actions and economic reopening.

These Golden Crosses demonstrate the pattern’s proven track record for signaling sustained Nifty bull runs in major recovery and rally phases.
How to Trade the Golden Cross Strategy
There are six major steps to trade the golden cross. The steps are identifying potential crossover on chart, confirming the breakout with volume, wait for candle close, entry, and stoploss.

- Identify potential crossover on chart: If the short term moving average is approaching towards the long term moving average from below, it acts as a potential golden cross.
- Confirm breakout with volume: Look for the rise in volume after the price breakout.
- Wait for candle close: Wait for a candle to close above both the moving averages to confirm the breakout and change in trend
- Entry: Enter a long position when price confirms the shift in trend and starts trading above both the moving averages. You can also enter when price pullbacks and take support from moving averages.
- Set stoploss: Set stoploss near to support or recent lows.
A trailing stop-loss can be used to lock in profits when the price continues moving in the direction of the trend—especially after a Breakout, with RSI and MACD used as confirmation signals to improve trade accuracy.
What is the Best Timeframe for Using the Golden Cross?
The best timeframe for using the golden cross is the Daily timeframe, especially when using the classic 50-day and 200-day moving averages. Daily timeframe filters market noise and captures genuine long term trend reversals, suitable for positional traders and long-term investors.
Depending on the trader’s style, speed, and holding period, different timeframes and moving-average combinations can be used to adapt the Golden Cross signal—making Timeframe for Trading a critical factor in how reliable and actionable the setup becomes.
| Trader Type | Best Timeframe | Common MAs Used |
| Long-term investor | Daily / Weekly | 50/200 |
| Positional trader | Daily | 50/200 |
| Swing trader | 4H / Daily | 20/50 |
| Intraday trader | 5min–1H | 9/21 or 20/50 |
How to Use the Golden Cross Indicator?
There are three major uses of the golden cross indicator in technical analysis. The uses are in trend confirmation filter, for entry and dynamic support and resistance.
- Use it as a trend confirmation: The trend can be confirmed by using the Golden Cross which allows the trades to enter long only when the short-term MA remains above the long-term MA over a couple of candles before making an entry.
- Buy on Pullbacks: The Golden Cross will allow trading on pullbacks where the prices have reverted to the 50-day MA or support zone and purchasing the stocks when the pullback indicates a reversal.
- Apply Moving Averages as Moving Support: The Golden Cross can be applied to determine dynamic support where the 50-day MA is considered as short-term support and 200-day MA as long-term support whereby traders can purchase during bounces and trail the stop loss below these levels.
Overall, the Golden Cross works best when used as a structured trend tool—confirming direction, timing entries on pullbacks, and guiding trade management through dynamic support levels—which is exactly how smart traders use Trading Indicators.
Golden Cross Settings in Different Markets
The Golden Cross settings differ depending on the behavior, volatility and style of trading in different markets. Although the combination of the 50/200 moving averages is the global standard, other markets need slower or faster moving averages to suit the price characteristics.
1. Stock Market (Equities)
- The 50/200 moving averages are popular among traders in equities, as the stock movements are smooth and respect long-term levels.
- This makes them ideal for positional trade and long-term investments in stock market.
- Faster traders sometimes use 20/50 for swing trading and 9/21 in case of momentum stock for early entry.
2. Cryptocurrency Market
- The 20/50 is more useful in crypto since the market is volatile and changes quickly in a sharp manner and thus the traditional 50/200 is too slow for Crypto.
- This makes it best for swing trading and mid-term crypto investing.
- Crypto traders also use 9/21 in order to find fast momentum driven breakouts in the short term.
3. Forex Market
- Traders tend to apply 10/50 moving averages in forex due to the volatility of the currency pairs and their tendency to move in shorter cycles.
- As a highly effective Intraday Trading Indicator, it is mainly used for intraday and short term trades. Traders value this Intraday Trading Indicator for its ability to highlight immediate trend changes on smaller timeframes.
- The trend-followers who are more inclined toward smoother movements can switch to 20/100, particularly when the directional move is caused by macro-factors.
4. Commodity (Gold, Crude, Silver)
- The best place is 20/100 in commodities because these markets experience severe pullbacks and macro driven volatility.
- Best for swing and positional traders
- The 50/200 can be applied to track larger commodity cycles but it is slower in responding.
5. Market Indices (Nifty, S&P 500, Dow, Bank Nifty).
- The traditional 50/200 mix is highly dependable in indexes since indices follow trends and the long term moving averages are obeyed.
- It is best for Long-term investors, ETF traders.
- Medium-term traders also employ 20/50 to identify previous changes of index momentum.
Here is the short comparison table of golden cross settings in different markets.
| Market Type | Common MA Pair | Reason | Best For |
| Stocks | 50/200 | Smooth long-term trends | Investors, positional |
| Crypto | 20/50 | High volatility, fast cycles | Swing traders |
| Forex | 10/50 | Quick reactions, tight ranges | Intraday traders |
| Commodities | 20/100 | Volatile with deep corrections | Swing/positional |
| Indices | 50/200 | Clean macro trends | Investors |
By choosing MA pairs that match each market’s volatility and cycle structure, traders ensure that every Golden Cross signal is timely, relevant, and aligned with the true rhythm of the asset they trade.
Why do Traders use the Golden Cross?
Traders use the golden cross for five main reasons. The reasons are simplicity, trend-following power, rule-based trading, good bull-market performance and early allocation signal.
- Simplicity: The Golden Cross is easy to recognize and easy to use as a trend indicator, making it suitable for beginner traders. It removes noise from the chart and provides a clear visual signal.
- Trend-Following Power: It helps traders to track the main direction of movement in the market by ensuring that the shift of the market momentum is bearish to bullish. This helps traders to stay longer in the trend without exiting early.
- Rule-Based Trading: Since the signal is completely based on moving averages, it makes trading decisions less emotive and more disciplined and systematic.
- Good Bull-Market Performance: The Golden Cross has had great reliability in robust bull markets where the trend is smooth and continued, capturing the long upside moves.
- Early Allocation Signal: It often gives an early indication for building or increasing long-term portfolio exposure before major trends pick up full strength. This helps with timing portfolio entries and reducing fear of missing out (FOMO).
Golden Cross excels as a simple trend tool when paired with confirmations, enhancing your technical analysis toolkit.
Why does the Golden Cross Sometimes Fail?
The golden cross sometimes fails due to four major reasons. The reasons are lagging in nature, false crossover in sideways, ineffective in short term fluctuation and excessive dependence without confirmation.
- Lagging indicator: The Golden Cross signals the shift in trend after the trend has already started, as the indicator relies on past price data, as a result, traders may enter in trade late and fail to get the early returns.
- False cross overs in sideways/ choppy markets: When the market is not in trend or is in range, temporary highs and lows may cause crossovers that reverses quickly and cause the whipsaws and losses.
- Excessive dependence without confirmation: By itself, it does not use volume, greater market tendencies, or other tools such as RSI and leads to misleading information particularly in erratic markets.
- Ineffective in short-term fluctuations: More volatile markets such as crypto or some forex pairs generate a lot of false signals, as the pattern suits sustained trends better than rapid fluctuations.
Mitigate failures by combining with volume, RSI, or stop-losses in trending markets, aligning with your backtesting focus on filters.
How Reliable is the Golden Cross?
Golden cross is moderately reliable especially when used for medium to long term trend following trade. Golden cross captures major trend shifts and avoids deep drawdowns. However its reliability heavily depends on market conditions, like it gives delayed and false signals in choppy markets.
Historical backtesting of Oddmund Groette on markets like the S&P 500 shows that trades based on the Golden Cross had a win rate of about 79%, with an average gain per trade of 15.8% and an annualized return around 6.8%.
Here is the complete trade list from 1960 to 2023.

Here is the equity curve plotted by using these backtested results.

Backtest Results and statistics
| Metric | Golden Cross | Buy-&-Hold |
| #Trades | 33 | 1 |
| CAGR (price-only) | 6.8% | 7.2 % |
| Time in market | 70 % | 100 % |
| Max drawdown | -33 % | -56 % |
| Trades that win (win rate) | 79 % | n/a |
| Average gain/trade | 15.8 % | n/a |
| Risk-adj. return (CAGR ÷ % time invested) | 9.6 % | 6.9 % |
Backtest found that 79% of the trades were winners, with an average trade gain of 15.8% and an annual return of 6.8%. This, we might argue the success rate is pretty high, although what matters is the total return.
How often does a Golden Cross Occur?
The golden cross does not occur very frequently because it uses long period moving averages like 50 and 200.
Here is the occurrence of the golden cross on different markets.
| Market / Asset Type | How Often Golden Cross Occurs | Reason |
| Major Indices (Nifty, S&P 500) | 1–3 times per year | Large, stable indices produce fewer crossovers; long-term trends dominate. |
| Large-Cap Stocks | 2–6 times per year | Moderate volatility creates occasional, but not excessive, trend shifts. |
| Volatile Stocks / Crypto | 5–12 times per year | High volatility causes frequent MA fluctuations and more crossovers. |
| Strong Trending Markets | Rare, sometimes once in a year | Sustained uptrend keeps 50-day MA above 200-day for long periods. |
| Sideways / Choppy Markets | Frequent crossovers (high whipsaws) | Short-term congestion leads to repeated false Golden/Death Cross signals. |
Golden Cross signals appear more in volatile markets and less in strong trends, making their reliability depend on overall market conditions.
How to Backtest the Golden Cross Strategy
There are six major steps to back test the golden cross strategy. The steps include defining rules, selecting assets, selecting timeframe, collecting historical data, stimulating the trade, evaluating the performance and forward testing the strategy, all of these can be easily done using Strike Money.
Define the golden cross rules
- Enter the trade when the 50 period moving average crosses above the 200 period moving average.
- Exit when the 50 period moving average crosses below the 200 period moving average ( Death crossover ) or use trailing stop loss and take profit.
Select asset and timeframe
- Select the asset such as Index, Stocks, Crypto and Commodities.
- The daily time frame is commonly used to trade the golden cross.
Collect historical data
- Collect historical data such as “Open,” “High,” “Low,” and “Close” (OHLC) from the last 10-20 years.
- Use platforms like yfinance (Python), NSEpy (for Indian markets) and pandas-datareader.
Stimulate the trade
- Calculate the indicator and generate buy / sell signals.
- Run the strategy and note Entry price, Exit price, Holding period and Profit or loss.
Evaluate Performance
The key metrics to evaluate performance are given below in the table.
| Metric | What it Means |
| CAGR | Annualized return |
| Max Drawdown | Biggest fall in equity |
| Win Rate | % profitable trades |
| Sharpe Ratio | Return vs risk |
| Total Trades | Number of signals |
Optimize and forward test
- Try using different periods of moving averages or using EMA instead of SMA.
- Filter using different indicators such as RSI above 50.
- Forward test to validate the strategy.
Is Death Cross the Opposite of Golden Cross?
Yes, Death Cross is exactly the opposite of the golden cross in technical analysis. The death crossover occurs when the 50-period moving average crosses below the 200-period moving average. It shows a bearish trend and potential for a long term downward trend.

The Death Cross usually develops after an uptrend peaks and selling pressure causes the short-term average to fall below the long-term average. Similar to its bullish counterpart, it acts as a sell or short signal, but it can lag—or fail—in choppy, sideways markets.
Difference between Golden Cross & Death Cross
The difference between golden cross & death cross is mentioned below in the table.
| Feature | Golden Cross | Death Cross |
| Definition | 50 MA crosses above 200 MA | 50 MA crosses below 200 MA |
| Market Signal | Bullish trend reversal | Bearish trend reversal |
| Indicates | Start of long-term uptrend | Start of long-term downtrend |
| Market Psychology | Shift from fear → optimism | Shift from optimism → fear |
| Trader Action | Buy / add long positions | Sell / reduce holdings / short |
| Performance Context | Works well in bull markets | Works well in bear or weak markets |
| Timeframe Used | Mostly Daily (50/200) | Mostly Daily (50/200) |
| Risk Level | Lower drawdowns, trend-following entry | Higher risk of deeper corrections |
| Reliability | Moderate to high in trending markets | High in strong bear phases, weak in sideways |
| Whipsaw Potential | Medium in choppy markets | High in volatile rebounds |
Golden Cross and Death Cross serve as lagging trend confirmation signals best used with volume, RSI, or price action in trending markets, rather than standalone entries prone to whipsaws.


 Previous Article


![15 Investing.com Alternatives [Free+Paid] You Should Use in 2026](https://www.strike.money/wp-content/uploads/2026/04/Investing.com-Alternatives.jpg "15 Investing.com Alternatives [Free+Paid] You Should Use in 2026 172")
![15 TradeStation Alternatives [Free+Paid] You Should Use in 2026](https://www.strike.money/wp-content/uploads/2026/04/TradeStation-Alternatives.jpg "15 TradeStation Alternatives [Free+Paid] You Should Use in 2026 173")
![15 Chartink Alternatives [Free+Paid] You Should Use in 2026](https://www.strike.money/wp-content/uploads/2026/04/Chartlink-Alternatives.jpg "15 Chartink Alternatives [Free+Paid] You Should Use in 2026 174")
: Overview, 10 Types of Indicators, Settings for Different Markets 175")


 : Definition, Formula, calculation, Uses, Advantages Vs limitations 178")


No Comments Yet.