Market equilibrium reflects the natural balancing point in markets where prices adjust in response to buying and selling activity. Market equilibrium plays a crucial role in understanding how supply, demand, and investor behavior interact to influence price stability. Traders and analysts often track these levels to anticipate market movements and identify fair-value zones.
Historically, the concept of market equilibrium emerged as formal trading developed. In the 1600s, the Amsterdam Stock Exchange facilitated organized trading, allowing prices to settle based on supply and demand. Over the centuries, the idea evolved through European and later global markets, with stock exchanges in London and New York refining mechanisms for price discovery and balancing market forces.
What does Market Equilibrium mean?
In the stock market, market equilibrium is the state where the quantity of a stock that buyers want to purchase is equal to the quantity that sellers are willing to sell. This is also known as the “market-clearing price” because at this price, there is no excess supply or demand, leading to a stable price.
What is Equilibrium Price?
The equilibrium price in the stock market is the specific price where the number of stocks that is demanded by buyers is equal to the number of stocks offered by the sellers. That is, it is the price at which the market demand and supply are both equal. At this price, the price is not under pressure to increase or decrease since the buyers and sellers are content.
How to Determine Equilibrium Price?
There are three main methods to determine equilibrium price. The methods are algebraic method, tabular method and graphical method.
Algebraic Method
Equate quantity demanded (Qd) equal to quantity supplied (Qs) and solve price (P). As an illustration, using Qd = 200 -5P & Qs = -40- 7P, equate them 200 5P= -40 7P, rearrange it 240 = 12P and P = 20. Put P back into either of the equations to get equilibrium quantity, e.g. Q = 120.
Table Method
Prepare a demand and supply schedule and determine the price at which quantities will be equal. In a table showing prices from ₹230 to ₹250, equilibrium occurs at ₹240 where both demand and supply equal 400 units; above this price creates surplus, below causes shortage.
Graphical Method
Draw supply and demand curves and mark the intersection of the curve as the point of equilibrium. This image serves the purpose of confirming the price stabilizing the market free of excess or deficiency.
In stock trading, equilibrium price reflects the stock’s market-clearing level where buy and sell orders balance, shifting with news or earnings.
Why does Equilibrium Occur?
The market reaches equilibrium due to the self correcting mechanism of the market system which is fueled by the rational actions of the buyers and sellers to maximize their personal results. The price is continuously driven towards the centre of supply and demand where the two wishes of either force meet.
How does Market Equilibrium Function?
Market equilibrium functions as a natural balance between buyers and sellers. It occurs when the quantity of shares buyers like to buy equals the quantity of shares that sellers want to sell and make the price remain constant. When supply is less than the demand, prices will increase; when supply is greater than demand, prices will decrease.
This continued process of buying and selling influenced by sentiment of traders and advent of new information is what causes the market to move towards equilibrium. Basically, it is the point at which the market will concur on the fair value of a stock at that time.
How do Supply and Demand Determine Market Equilibrium?
Market equilibrium is fundamentally determined by the interaction and balancing of the forces of supply and demand. Supply and demand act as two opposing forces that dictate price movements until a stable point of balance is reached.
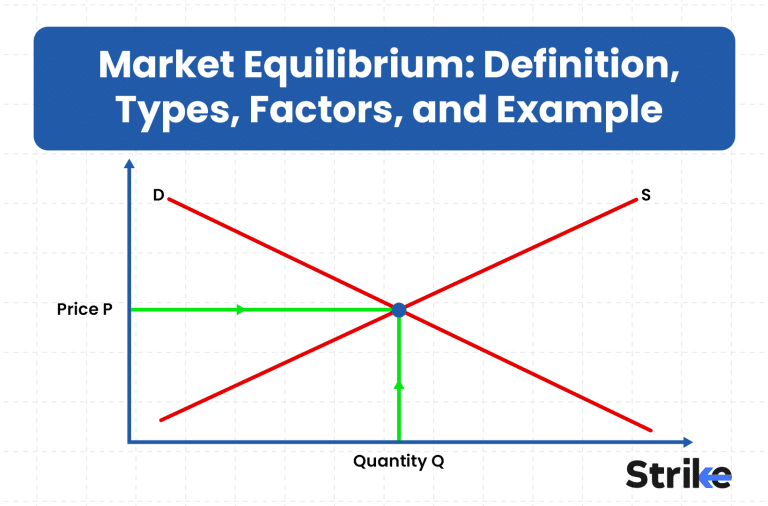
Lets understand it with the help of a graph where the demand curve and supply curve intersect showing market equilibrium.

The horizontal axis shows quantity whereas the vertical axis shows price.
- Demand Curve (Downward Sloping): It shows how many shares buyers want at different prices. As price decreases, buyers’ demand for shares increases.
- Supply Curve (Upward Sloping): It shows how many shares sellers are willing to offer at different prices. As price increases, sellers supply more shares.
- Point of Intersection: This is the point where demand curve and supply curve meet to form market equilibrium where the quantity buyers want equals the quantity sellers want to sell.
- Equilibrium Price and Quantity: The price of the share at the point of intersection (equilibrium) is known as equilibrium price. Whereas, the quantity at the point of intersection (equilibrium) is known as equilibrium quantity.
At this price, the market gets balanced, if price goes above equilibrium, supply exceeds demand and price falls. If price goes below equilibrium, demand exceeds supply and price rises.
How do Prices Adjust to Reach Market Equilibrium?
Prices adjust to reach market equilibrium through the price mechanism, where imbalances between supply and demand create surpluses or shortages that incentivize sellers and buyers to alter prices until quantities match.
- Surplus Adjustment: During high supply, price exceeds equilibrium, generating a surplus, sellers offload the excess inventory by lowering price to attract buyers. This gradually reduces supply and increases demand until equilibrium.
- Shortage Adjustment: During high demand, price drops below equilibrium, generating a shortage, buyers bid higher prices, while suppliers ramp up production, pushing price upward until equilibrium.
- Iterative Process: This self-correcting cycle repeats via trial-and-error pricing by participants, withno central control needed, ensuring efficient resource allocation as prices signal market conditions.
Prices keep adjusting through this natural demand–supply feedback loop, allowing the market to continuously move toward equilibrium without any external control.
How to Read the Market Equilibrium Graph?
There are four major steps to read the market equilibrium graph. The steps are identifying the axis, locate the curves, find the intersection point, and interpret.

Identify the Axes
- The vertical axis (Y-axis) represents the price of the stock.
- The horizontal axis (X-axis) represents the quantity of shares traded.
Locate the Curves

- Demand Curve: Demand curve slopes downward from left to right and shows that buyers want more shares at lower price.
- Supply Curve: Slope curve slopes upward from left to right and shows that sellers are ready to sell more shares at higher price

Find the Intersection Point
- The point where supply and demand curves meet is known as market equilibrium.
- This point gives two key values, Equilibrium Price (on the Y-axis) and Equilibrium Quantity (on the X-axis).

Interpretation
- This intersection point ( equilibrium ) suggests buyers and sellers agreed on both price and quantity.
- At this point there is no excess demand or supply.
- If equilibrium price is above equilibrium point, it means supply is more than demand and price falls.
- If equilibrium price is below equilibrium point, it means demand is more than supply and price rises.
By reading the axes, curves, and intersection point, traders can understand how price adjusts when demand or supply changes, helping them predict market movements more effectively.
Market Equilibrium Formula
A core equilibrium condition is as follows.
Demand (Qd) = Supply (Qs)
Demand Equation: Qd = a – bP
Supply Equation: Qs = c + dP
Where,
Qd = quantity demanded
Qs = quantity supplied
P = price
a, b, c, d = constants from data or observation
How Can We Calculate Equilibrium Price?
Let’s take an example of Reliance Industries stock to understand how to calculate equilibrium price and quantity. We will calculate the equilibrium price and quantity in three steps.
Step 1: Build Demand & Supply Data
Assume based on order book behavior we estimate:
- Demand (Qd) = 10,000 – 20P (Buyers want fewer shares as price increases)
- Supply (Qs) = 2,000 + 30P (Sellers are willing to sell more as price increases)
Step 2: Set Demand = Supply
10,000 – 20P = 2,000 + 30P
10,000 – 2,000 = 30P + 20P
8,000 = 50P
P = 160
This is the equilibrium price.
Step 3: Find the Equilibrium Quantity
Use either equation.
Let’s use the demand equation:
Q = 10,000 – 20(160)
Q = 10,000 – 3,200
Q = 6,800 shares
What Conditions are Necessary for Market Equilibrium?
There are five major conditions necessary for market equilibrium. The conditions are free market functioning, no external inference, perfect information, rational buyers / sellers, and no major shocks.
- Free market functioning: It is a condition where the market is allowed to operate naturally based on supply and demand without unnecessary restrictions. When the market trades freely, buyers and sellers have the advantage to freely decide how much to trade, helping the price reach equilibrium.
- No external interference: Equilibrium forms without any artificial controls like price caps, subsidies, or regulations that distort the supply and demand. Without this external interference, the market can adjust prices smoothly to balance demand and supply.
- Perfect information: In this condition buyers and sellers should have clear and accurate information about price, availability, and market conditions. When everyone knows the same information, it helps them make better decisions to settle the market at correct equilibrium.
- Rational buyers and sellers: Market equilibrium assumes people make logical decisions based on what benefits them. Buyers aim to get good value, and sellers aim to make profit. This rational behavior helps balance the market naturally.
- No major shocks: Sudden events such as economic news, disasters, or big announcements can disrupt the markets supply and demand. Equilibrium requires a stable environment where such major shocks do not disturb the equilibrium process.
These conditions create a stable environment where supply and demand can adjust naturally, allowing the market to reach and maintain equilibrium.
Can Equilibrium Exist in Real Markets?
Yes, equilibrium can exist in real markets, but it is often a temporary state rather than a permanent one.
In reality, real life markets are dynamic and affected by various factors such as the price variation, consumer preference, technology, government policies or external shocks, and all these vary the supply and demand curves and disrupt the equilibrium.
Also, market failures like monopolies, entry barriers and information asymmetry usually do not allow the market to stay in perfect equilibrium.
Hence, while Macro Economics often uses equilibrium as an ideal model, real markets tend to be in a constant state of flux, moving toward new equilibria as conditions change.
What are the Different Types of Market Equilibrium?
There are four main types of market equilibrium. The types are short-term equilibrium, long-run equilibrium, partial equilibrium and general equilibrium.
- Short-Term Equilibrium: This happens when the price of a stock stabilizes for a short term at the point of equilibrium. This kind of equilibrium is frequently achieved through intraday or daily prices. It is guided by the short-term news, trader sentiment, liquidity and the technical levels. Stable positions are achieved within a shorter period of time with the new orders coming in.
- Long-Run Equilibrium: This happens when a stock price stabilizes near long-term fair value based on fundamental factors such as the growth rate of earnings, the prospects of the industry, and the macro environment. In this case, supply and demand are at equilibrium after months and years and may create price ranges or channels of trend.
- Partial Equilibrium: This focuses on balancing a single stock without considering the wider market. For instance, analyzing only Reliance demand and supply behaviour without considering Nifty, interest rates and the global markets. It is applied by traders when they are learning company-specific news or technical setups.
- General Equilibrium: It examines how all markets in an economy reached equilibrium simultaneously. It explains how change in one market affects the other market, like increase in fuel price can affect transport, food, and manufacturing. This alters the equilibrium not only to a single stock but also to the whole financial market.
These four types of equilibrium help traders understand how prices balance in different timeframes and contexts, from individual stocks to the entire market system.
How often does Market Equilibrium Occur?
Market equilibrium occurs very frequently but it never sustains permanently because prices keep adjusting in response to supply, demand, news and expectations. This equilibrium duration varies depending on the market types. It may last for seconds to minutes in liquid stocks, whereas it may last for hours to days in less liquid assets.
Are Markets always in Equilibrium?
No, stock markets are not always in equilibrium. Equilibrium is a dynamic process where supply and demand continuously adjust toward balance and rarely archives a static state.
Stock price changes every second because demand and supply keep shifting with new information, news, sentiment, and order flow, which is also a core idea behind the Efficient Market Hypothesis. This constant movement pushes the market toward balance, but the balance never lasts.
What can Cause Equilibrium to Change?
There are four major causes of change in market equilibrium. The causes include changes in information, shifts in market sentiment, major trading activity and policy changes.
- Changes in Information: Any emergence of new information such as earnings, company news, economic news, or shift in investor expectations. The demand or supply changes when the expectations alter leading to a new equilibrium price.
- Shifts in Market Sentiment: The aggressiveness of buying or selling can shift fearfully or optimistically in a short period of time. Bullish mood increases demand, bearish mood increases supply. This group mentality leaves the balance on a different plane.
- Major Buying or Selling Activity: Big trades by the FIIs, DIIs or large traders alter the ratio between the buyers and sellers. The price changes when one side abruptly dominates against which a new equilibrium is discovered.
- Policy or External Shocks: Risk perception is changed by government policies, interest-rate decisions, geopolitical events or other unforeseen global shocks. This re-prices assets in the market displacing equilibrium.
These shifts cause the market to move to a new equilibrium price and quantity, balancing the changed supply and demand conditions.
What are the Advantages vs Disadvantages of Market Equilibrium?
The advantages and disadvantages of market equilibrium is mentioned below in the table.
| Aspect | Advantages of Market Equilibrium | Disadvantages of Market Equilibrium |
| Price Stability | Prices remain stable when demand = supply, reducing unnecessary volatility. | Stability can be temporary because new information quickly disrupts equilibrium. |
| Efficient Allocation | Resources and capital flow to where they are most valued; fair-value pricing emerges. | Efficiency assumes perfect information, which rarely exists in real markets. |
| Smooth Trading | Buying and selling happen easily with balanced order flow. | Large players (FIIs/DIIs) can break this balance with heavy orders. |
| Fair Value Discovery | Equilibrium helps identify the stock’s “true price” based on market consensus. | Fair value may be misleading if sentiment is extreme (fear/greed phases). |
| Lower Transaction Stress | Traders face less uncertainty during calm, balanced phases. | Too much stability may lead to complacency and reduced opportunities. |
Equilibrium offers stability for range trading but stifles momentum plays, so savvy traders blend both phases for balanced risk-reward.
What are the Common Misconceptions about Market Equilibrium?
There are six common misconceptions about the market equilibrium which are mentioned below.
- The Equilibrium Means Prices Never Change: It is a common belief that when markets become in equilibrium, they remain at that price. In reality, the equilibrium continues to move with the change in demand, supply and the economic conditions. Markets are in an endless state of flux and not at equilibrium.
- The Equilibrium Needs an Equal portion of buyers and sellers: Quantity is usually confused with the number of the participants. Equilibrium occurs when quantity supplied and quantity demanded are equal even when there is a large disparity in the number of buyers and sellers.
- Markets Are Always in Equilibrium: In real markets, sudden news, emotional trading, liquidity gaps or short-term imbalances often cause a real market to be in disequilibrium. Prices continuously adjust toward equilibrium, but markets are rarely perfectly balanced at every moment.
- Equilibrium Removes Competition or Volatility: Others feel that equilibrium brings about a calm or stable market. However, equilibrium only reflects balance between demand and supply, it does not prevent price changes, competition or volatility.
- Equilibrium is not affected by government Policies: Most people believe that equilibrium is a natural process not affected by policies. In reality, demand or supply can be shifted by taxes, subsidies, changes in interest rate and regulations and a new equilibrium quantity and price will be the result.
- Equilibrium Price Is Always Fair: People often assume equilibrium always reflects fairness. However, equilibrium shows the price at which the sellers and buyers agree, not whether the price is ethical or beneficial for all participants.
Market equilibrium is a foundational concept that balances supply and demand but should be understood as a dynamic process influenced by market forces and policies rather than a fixed or perfectly fair state.
What is the Difference between Equilibrium and Disequilibrium?
The Difference between Equilibrium and Disequilibrium is mentioned below in the table.
| Aspect | Equilibrium | Disequilibrium |
| Demand & Supply | Demand equals supply | Demand and supply are not equal |
| Price Movement | Stable, moves slowly | Sharp moves, volatility increases |
| Market Condition | Balanced, calm trading | Imbalance, sudden buying/selling |
| Reason | Normal trading activity, fair-value zone | News, shocks, large orders, sentiment shifts |
| Outcome | Price stays near fair value | Price adjusts until new equilibrium forms |
| Example (Stock Market) | Price consolidates near a strong volume zone | Gap-ups, gap-downs, breakouts, breakdowns |
Markets oscillate between equilibrium stability and disequilibrium volatility, rewarding traders who adapt strategies to each phase for optimal entries and risk management.


 Previous Article


![15 Investing.com Alternatives [Free+Paid] You Should Use in 2026](https://www.strike.money/wp-content/uploads/2026/04/Investing.com-Alternatives.jpg "15 Investing.com Alternatives [Free+Paid] You Should Use in 2026 24")
![15 TradeStation Alternatives [Free+Paid] You Should Use in 2026](https://www.strike.money/wp-content/uploads/2026/04/TradeStation-Alternatives.jpg "15 TradeStation Alternatives [Free+Paid] You Should Use in 2026 25")
![15 Chartink Alternatives [Free+Paid] You Should Use in 2026](https://www.strike.money/wp-content/uploads/2026/04/Chartlink-Alternatives.jpg "15 Chartink Alternatives [Free+Paid] You Should Use in 2026 26")
: Overview, 10 Types of Indicators, Settings for Different Markets 28")

 : Definition, Formula, calculation, Uses, Advantages Vs limitations 30")


No Comments Yet.