Value at Risk (VaR) is a statistical technique used to measure the potential risk of loss for investments. VaR analysis takes into account variables like market volatility, economic trends, and other key factors that can influence investment outcomes.
Value at Risk is measured in three parts – the amount of expected loss, time frame of the loss and the confidence level. Expected losses refers to how much an investment could lose within its given timeframe and certainty level. Quantifying the extent of potential loss requires specifying both its timeframe and severity; typically this period ranges between days, weeks and months with longer timespans suggesting greater losses.
The likelihood of loss, or certainty level, represents the probability that actual losses will fall below anticipated losses. An evaluation of downside risk- or likelihood of money loss- associated with investments or portfolios under normal and stressed market conditions.
VaR first emerged in the late 1980s when financial institutions like J.P. Morgan and Bankers Trust adopted it for internal risk management purposes. Industry-wide acceptance occurred after J.P. Morgan published RiskMetrics as a public methodology for calculating VaR.
Basel Committee on Banking Supervision recommended VaR models as regulatory market risk capital requirements. VaR became a standard risk management tool by the late 90s/early 2000s with various methodologies including historical simulation, parametric approaches and Monte Carlo simulation being developed by both academics and practitioners alike.
What is the Meaning of Value at Risk (VaR)?
Value at Risk (VaR) is a finance term used to calculate the potential loss in portfolio or investment value over a specific time horizon and certain certainty level. VaR serves as a tool to quantify investment risks by providing estimates of maximum potential losses given a certain level of confidence in making predictions about portfolio returns.
Financial institutions such as banks, mutual funds, and investment management companies use financial risk management techniques to address portfolio management. Portfolio directors and analysts use various analytical techniques to analyze individual investments or portfolios.
Regulators and central banks play a pivotal role in monitoring and appraising the risk exposure of financial institutions.
Market risk management entails calculating potential losses due to changes in market factors, such as involvement rates, equity prices and exchange rates. Credit risk management measures potential losses associated with defaults and other factors impacting credit quality changes. Operational risk management helps quantify potential losses associated with operational failures or inadequacies, helping companies calculate losses that occurs as a result.
Financial institutions or portfolio directors establish limits for Value at Risk exposure to control its exposure, and when calculated VaR exceeds this fixed limit it could cause them to modify their risk management tactics in order to bring it back within acceptable range.
An equity portfolio with a 95% one-day VaR of $1 million means there’s only a 5% chance its value will decrease by more than this amount within one day, provided no trading takes place – in other words, an unexpected loss exceeding this VaR should only happen approximately every 20 days.
VaR is widely employed for risk management, financial control, reporting and regulatory capital calculations; however, it has its limitations. VaR doesn’t provide details on losses when there is a breach, making it potentially unreliable in certain applications of risk management. Additional risk assessment measures like economic capital, backtesting stress testing expected shortfall and tail conditional expectation provide complementary insights that help address VaR’s shortcomings.
How does Value at Risk (VaR) function?
Value at Risk (VaR) is a tool for every investment decision. Value at Risk is a financial metric to calculate the maximum financial loss that can occur over a period of time. A Value at Risk metric can only be specified after identifying 3 things.

1) The period of time over which a possible loss will be calculated. It could be a day, week or month. This is called Value at Risk horizon.
2) A quantile of possible loss. The portfolio’s value at risk will be expressed as a particular amount quantile of loss.
3) The currency in which possible loss is denominated. This is called the base currency. It can be USD, Rupee etc.
The value at Risk metric is the quantitative value based on which investment decisions are taken.
The value of Risk is calculated and analyzed by risk managers. Risk managers determine the extent and probabilities of potential losses in portfolios. This is used by investors and traders to make strategic decisions or choose between multiple available investment options. Financial Institutions also benefit from using Value at Risk. Financial institutions use VaR to gauge the cash reserves they need to cover potential portfolio losses.
Value at Risk is often used by businesses that deal with several risky investments as a way to monitor and control the total risk level of the firm. VaR is typically used to assess company-wide risk exposure, rather than investment-specific risk. Firms employ it to predict the size of future outlying losses or gains that their (or their clients’) portfolios experience.
Many firms use VaR to determine the amount of collateral needed from a client for a margin loan when trading financial instruments. Buy-side entities, such as hedge funds, use VaR to determine if a portfolio’s allocation exceeds a current risk tolerance or investment mandate.
What is the History of Value at Risk (VaR)?
Value at Risk was not widely used prior to the mid-1990s, the origins of Value at Risk lie further back in time. Value at Risk’s origins can be traced back as far as 1922 to capital requirements the New York Stock Exchange imposed on member firms.
Value at Risk also has roots in portfolio theory and crude VaR measure published in 1945. The mathematics that underlines VaR were largely developed in the context of portfolio theory by Harry Markowitz and others, though their efforts were directed towards a different end.
Retrospective analysis has found some VaR-like concepts but VaR did not emerge as a distant concept until the late 1980s. The triggering event was the stock market crash of 1987.
This was the first major financial crisis in which a lot of academically trained quants worried about the survival of the firms. VaR was developed as a systematic way to segregate extreme events. Abnormal markets and trading were excluded from the VaR estimate in order to make it observable.
A rudimentary measure of Value at Risk was well established in quantitative trading groups at several financial institutions, notably Bankers Trust before 1990, although neither the name nor the definition had been standardized. Disastrous losses were later associated with the use of derivatives and leverage between 1993 and 1995. This was because of the failure of Barings, The British Investment Bank and Nick Leeson, a young trader in Singapore.
Firms were ready for more comprehensive risk measures. J.P. Morgan provided public access to the variances and co-variances across various security and asset classes in 1995. This was used internally for almost a decade to manage risk and allowed software makers to develop software to measure risk.
This led to the term Value at Risk to describe the risk measures that emerged from the data. It can be concluded that Value at Risk was invented by J.P. Morgan. The measure found a ready audience with commercial and investment banks and the regulatory authorities.
What are the methods to calculate Value at Risk (VaR)?
There are 3 basic approaches that are used to compute Value at Risk, though there are numerous variations within each approach. The three main approaches are Monte Carlo Simulation, Historical Method, and Variance/ Co-Variance Method.
- Monte Carlo Simulation
Monte Carlo Method is the dynamic method of calculating Value at Risk. Value at Risk is calculated by randomly creating a number of scenarios for future rates using non-linear pricing models to estimate the change in value under the Monte Carlo Method. Value at Risk is calculated based on the worst losses.
This method is used in complex situations and is also flexible. The Monte Carlo method is suitable for a great range of risk measurement problems, especially when dealing with complicated factors. It assumes that there is a known probability distribution for risk factors.

There are 3 main steps in Monte Carlo Simulation. The first 2 steps in a Monte Carlo Simulation is the identification of market risks that affect the asset or assets in a portfolio and converting individual assets into positions in standardized instruments. The third step is taking the simulation route, where probability distribution for each market risk factor is specified. The way in which each market risk factors move is also specified.
A six-month Dollar/ Euro forward contract is assumed. The probability distribution for the 6-month zero coupons $ bond, the 6-month zero coupon euro bond and the dollar/ euro spot rate will have to be specified in this case.
The estimation of parameters is easier assuming normal distributions for all variables but under Monte Carlo Simulation alternate distributions for the variables can be selected. Subjective judgments to modify these distributions is also possible. The simulation process starts once the distributions are specified.
The market risk variables take on different outcomes and the value of the portfolio reflects the outcomes in each run. A distribution of portfolio values will be received after a repeated series of runs numbering usually in the thousands. This can be used to assess Value at Risk.
The formula used for calculating Value at Risk using Monte Carlo Method is:
Monte Carlo VaR: VaR = -1 x (percentile loss) × (portfolio value)
VaR in this formula is expressed in currency units and represents the maximum loss that can be expected with a certain level of probability over a specific time horizon. The percentile loss represents the loss expected at the chosen confidence level.
Historical Method
The historical Method is the easiest and simplest method of calculating Value at Risk. The historical Simulation Method is based on the data collected based on the behavior of risk factors over a period of time. Market data for the last 250 days is taken to calculate the percentage change for each risk factor on each day.
Each Percentage change is then calculated with current market values to present 250 scenarios for future value. The change in every risk factor is calculated and arranged in the order of worst to best. This method helps in calculating the probability of the worst outcome that helps in decision making as the base of this method is that history repeats itself. The portfolio is valued using full, non linear pricing models.
The Value at Risk for a portfolio in this method is estimated by creating a hypothetical time series of returns on that portfolio, obtained by running the portfolio through actual historical data and computing the changes that would have occurred in each period. Historical simulation is run with the time series data on each market risk.
Daily price change is separated into positive and negative numbers and each group is analyzed. The positive and negative Value at Risk is then defined with a certain confidence interval.
The formula for calculating Value at Risk under Historical Method is :
Value at Risk= Vm ( Vi/ Vi-1 )
Vi denotes the number of variables on day i. m is the number of days from which historical data is taken. The purpose of the formula is to calculate the percent change of risk factor.
Example:
Suppose an investment firm wants to calculate the 1-day 95% VaR for equity using 100 days of data. The 95th percentile corresponds to the best day within the worst 5% of returns. The VaR simply corresponds to the 5th worst day in this case because 100 days of data is being used.
Another example of historical VaR could be thought of this way. A negative return of 5% represents only 3% of total returns, then there is a 97% chance that a daily loss will not exceed 5 percent.
The Variance Covariance Method
The Variance Covariance method is also called the parametric method. This method assumes that gains and losses are evenly distributed. Potential losses can be framed this way in terms of standard deviation events from the mean. Two factors that are estimated in this method are an expected return and a standard deviation.
The parametric method is best suited to risk measurement problems where the distributions are known and reliably estimated. This method is unreliable when the sample size is very small. The estimated returns and Standard deviation can be combined to create a normal distribution curve. The Variance Covariance method calculates the probability of a return occurring and creates a normal distribution graph based on this data.
The risk is mapped in the individual investments in the portfolio in this method. Value of Risk is computed and the measure based on the market risk exposure is estimated. There are generally 4 steps involved in the process.
The first Step is to take each of the assets in a portfolio and map that asset on to simpler, standardized instruments. The mapping process is more complicated for more complex assets such as stocks and options.
Every financial asset is mapped into a set of instruments representing the underlying market risks. The resulting matrix is used to measure the Value at Risk of any asset that is exposed to a combination of these market risks.
The Second Step is to state each financial asset in a set of positions in the standardized market instruments. This process is simple for 10-year coupon bonds. This process with mapping is more complicated when working with convertible bonds, Stocks or derivatives.
The Third Step is to identify the standardized instruments that affect the asset or assets in a portfolio. The variances in each of these instruments and the covariances across the instruments have to be estimated after identifying them. These variances and covariance in practice are obtained by looking at historical data. They are the key to estimating the VaR.
The Final Step is computing the Value at Risk for the portfolio using the weights on the standardized instruments computed in Step 2 and the variances and covariances in these instruments computed in Step 3. The formula for calculating Value at Risk under the parametric method is:
Parametric VaR: VaR = -1 × (Z – score) × (standard deviation of returns) × (portfolio value)
Value at Risk in this formula is expressed in currency units and represents the maximum loss that can be expected with a certain level of probability over a specific time horizon. The Z -score represents the number of standard deviations from the mean return and the standard deviation of returns measures the volatility of the portfolio or investment.
Example:
The Standard deviation of the daily returns of asset A and its mean is given. There are 250 trading days in a year and the value of asset A is $200,000. The 5% annual VaR is estimated to be $59,660 using the formula.
This implies that there is a 5% probability that the asset will fall in value by more than $59,660 over one year if there is no trading.
What role does Value at Risk (VaR) play in the stock market?
Stock markets are extremely volatile and the probability of making losses is quite high if there is not a thorough understanding of the markets and the price movements. Investors and traders, therefore, give high importance to quantifying the risk through the measurement of volatility. The key shortcoming of such measurement is the indifference in the direction of fluctuations.
A stock with an increasing price trend is volatile too but such volatility does not scare investors. The stock is exactly the opposite in the reverse case. The markets in general or a particular stock are on a decreasing trend, the volatility can then often make investors and traders take rash decisions to limit their losses. The calculation of the maximum potential loss at such times can caution the investors and traders and help them make rational decisions that will benefit their portfolios.
Financial Risk Management has evolved dramatically over the last few decades. One of the most widespread tools used by financial institutions to measure market risk is Value at Risk (VaR). This enables firms to obtain a firm-wide view of their overall risks and to allocate capital more efficiently across various business lines.
Value at Risk summarizes in a single number the risk of loss of a portfolio over a defined time horizon and a given confidence level. Value at Risk (VaR) depends on two chosen parameters. The first one being the confidence level, which indicates the probability of an outcome of less than or equal to VaR. The Second one is the holding period or the period over which the portfolio’s profit or loss is measured. These parameters help in determining the potential loss.
How do you read Value at Risk?
Value at Risk (VaR) can be stated as a percentage of the portfolio i.e. a specific percentage of the portfolio is the Value at Risk of the portfolio.
The portfolio value is $10,000 and there is a 5% VaR of 2% over the next 1 day, then it is equivalent to a 5% VaR of 200$ ( 2% of 10,000$ ) over the next 1 day.
Value of risk provides a quantitative measure of risk in value with a given probability and within a defined period. The level of risk is summarized in a single number, which is then used as a benchmark when judging the level of risk the investor is exposed to.
VaR can be computed in the case of continuous random variables as :
VaR (X) = – t where P ( X< t) = p
VaR represents the maximum possible loss on a portfolio over a given period in the future, with a given degree of confidence. The degree of confidence is typically expressed as 1 – p. This can be computed as units or as a percentage of the portfolio.
What is an example of Value at Risk (VaR)?
Suppose a risk manager wants to calculate 1 day 95% VaR for stock XYZ using 100 days of data. The historical method is used here and the risk manager would look at the last 100 days of returns for stock XYZ, in order from worst to best. The following 100 returns, sorted from lowest to highest:
Worst: 1 = -5.31 %
2= -4.96 %, 3= -4.84 %, 4= -4.20 %, 5=-3.72 %, 6= -3.55 %, ….99= 4.93 %
Best: 100 = 5.02 %
The 95th percentile VaR in this case corresponds to -3.72 % or the risk manager could say that the 1 day 95 % VaR is a loss of 3.72 %. This amount of risk is within an acceptable range for the risk manager or their institution and stock XYZ could be seen as an attractive investment.
What are the Advantages of Value at Risk in the Stock Market?
Value at Risk has many opportunities and means particularly favourable to success or any desired end in the stock market. The 6 advantages of Value at Risk are:
1) Easy to understand: Value at risk is a singular number that approximates the amount of risk in a portfolio. VaR is presented either as a percentage of the value of a portfolio or simply in price units such as dollars. This makes it easy to understand and interpret.
2) Applicability: Value at risk can be used to measure and make a comparison of risks across asset classes and portfolios. This equips the risk manager with relevant information on possible risks.
3) Acceptability: The Value at Risk figure is a widely accepted standard in the buying or selling of assets. It is also acceptable to banking regulators. VaR has the same interpretation irrespective of the assets you are considering. VaR is regularly seen in annual reports of financial companies.
4) Used for Performance Evaluation: Instead of evaluating a firm’s performance purely based on returns, a risk-adjusted return can be calculated by considering the level of risk taken. In this case, VaR can serve as an adjustment basis.
5) Reliability: Value at Risk, as a measure of risk, can be verified by backtesting. VaR can also translate portfolio volatility into a dollar value.
6) Measurement of financial securities: Value at Risk can measure the risk of many types of financial securities like stocks, bonds, commodities, foreign exchange, and off-balance sheet derivatives such as futures, forwards, swaps, options, etc. The measurement of the potential losses of these financial securities will help investors avoid loss.
What are the disadvantages of Value at Risk (VaR) in the stock market?
Value at Risk has an unfavourable circumstance and condition that reduces the chances of effectiveness in the stock market. The 7 Disadvantages of Value at Risk are:
1) Measurement of Significant Events: Value at Risk does not measure significant events like market crashes. It estimates the possibility of large negative returns associated with securities and portfolios, but without taking into consideration the possible actions of other market participations. It assumes the volatility of returns, and the correlations between returns ( how the returns vary in relation to each other), do not change.
2) Capturing liquidity: Value at Risk does not capture liquidity differences among instruments. Sharp and sudden falls in the prices of assets can put value at risk, but they can also reduce a bank’s ability to function and to meet its short-term liabilities. The bank should regularly compute estimates of value at risk, and also liquidity at risk to make adequate preparation for this possibility.
3) Depends on inputs and assumptions: The parametric method, for instance, assumes that asset and portfolio returns follow a normal distribution. One might end up using unrealistic return distributions as inputs. This will, in turn, lead to an underestimation of the real risk. The assumption by the historical simulation method that the past performance of a portfolio is a good indicator of its performance in the near future is unrealistic.
4) Inconsistent results: Different approaches to calculating Value at Risk using varying assumptions and, as a result, end up getting different values of Value at Risk of the same portfolio.
5) Misleading and a false sense of security: Value at Risk is calculated at a confidence interval of 99%, then its interpretation is that there is a 99% probability that one will lose no more than the Value at Risk value obtained. This may give an investor a false sense of security.
6) Difficult to calculate given large portfolios: Having many diverse assets complicates the calculation of Value at Risk. This is mainly because to obtain Value at Risk, the correlation between the assets, as well as the risk and return of all the assets, must be calculated.
7) Subjectivity: Calculating the Value at Risk involves choosing parameter estimates, distribution assumptions, percentage of loss, as well as the lookback period. These choices can immensely affect Value at Risk.
Why do Banks use Value at Risk (VaR)?
Banks often use Value at Risk to determine how much bank capital should be put aside. Bank regulators often ask banks to set aside a factor of the bank’s Value at Risk as a capital requirement. Regulators consider that the bank should set aside 3-5 times the Value at Risk as reserve capital for the same period if the bank faces the level of risk indicated by the Value at Risk within a defined period.
This way banks are prepared to respond to unexpected events. Value at Risk helps commercial and investment banks to capture the potential loss in their traded portfolios from adverse market movements over a specified period. This can then be compared to their available capital and cash reserves to ensure that the losses can be covered without putting the firms at risk.
Value at Risk is calculated for different time periods according to a) how long the bank plans to hold its portfolio, and b) how quickly it can sell the portfolio. The banks use Value at Risk measured over a 10-day period to determine how much capital they must hold to cover their trading activities.
The focus in VaR is clearly on downside risk and potential losses. Its use in banks reflects their fear of a liquidity crisis, where a low-probability catastrophic occurrence creates a loss that wipes out the capital.
The Value at Risk at investment banks is specified in terms of market risks, interest rate changes, equity market volatility and economic growth. Investment banks apply Value at Risk modelling firm-wide because of the potential for independent trading desks to unintentionally expose the firm to highly correlated assets.
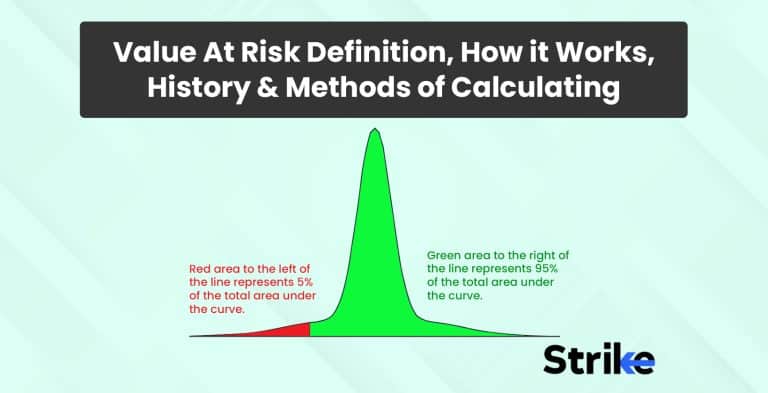
What does a VaR of 5% mean?
Value at Risk can be interpreted and distributed just like historical data to calculate individual asset distribution for a portfolio. Value at Risk of 5% can be interpreted in two ways:
1) As minimum loss possibility: 5% VaR can be said that- “there is 5% chance for the portfolio of incurring a loss of a certain percentage of the total portfolio value in a day or say tomorrow (only in case of daily VaR).
2) As a confidence level measure: for example: 5% VaR can be said that there is a 95% chance that the portfolio will not lose more than a certain percentage of its total value in a day’s trade.
The second interpretation is the one majorly used by portfolio managers. This interpretation can sometimes be misleading as it ignores the higher loss percentages on the left tail of the measured Value at risk. This is why most of the time regulators and other market supervisors prefer to look at both 5% and a certain percentage VaR measures instead of just either one of them.
For example, A security has a 5% Daily VaR (All) of 4%:
There is 95% confidence that the security will not have a larger loss than 4% in one day. The market supervisors prefer to look at both 4% and 5% VaR measures instead of just either one of them in this case.
Can you use Value at Risk in Trading?
Yes, Value at Risk can be used in Trading.
Value at Risk is applicable to all types of assets – bonds, shares, derivatives, currencies, etc. Value at Risk can be easily used by different banks and financial institutions to assess the profitability and risk of different investments and allocate risk based on Value at risk. The data produced is used by investors to strategically make investment decisions.
The most popular and traditional measure of risk in securities trading is volatility. The main problem with volatility is that it does not adjust for the direction of an investment’s movement. The concern for investors is about the odds of losing money, which is the premise that Value at Risk is built on.
Value at Risk provides a glimpse into an investment’s worst-case scenario for investors or managers who care about the odds of a large loss. Value at Risk modelling determines the potential for loss in the entity being assessed and the probability that the defined loss will occur. It is measured by assessing the amount of potential loss, the occurrence probability for that amount of loss, and the timeframe.
Do Hedge Funds use Value at Risk?
Yes, Hedge Funds use Value at risk.
Hedge funds employ complex investing strategies that can include the use of leverage, derivatives, or alternative asset classes in order to boost return. Investors looking at hedge funds need to understand the cost-benefit calculation of a fund’s strategy and value proposition before putting money into it. Hedge fund investors are exposed to multiple risks, and each strategy has its own unique risks.
Value at Risk is used for monitoring and controlling risk within the portfolio. VaR can measure the risk of financial securities like stocks, bonds, commodities, foreign exchange, off-balance-sheet derivatives such as futures, forwards, swaps, and options, etc. The data produced is used by investors to strategically make investment decisions.
Is using Value at Risk effective?
Yes, Value at Risk is effective. Value at risk is widely used to measure potential loss as it is easy to understand and apply. It gives the users (investors or managers) a thorough analysis of the potential losses and the probability of the same. Value at risk is a better version of the measurement of risk in comparison to mere volatility of the market as it shows the direction of the fluctuations and helps in the decision-making process.
The period of calculations used by different methods of calculation Value at Risk can give different results that have to be analyzed with overall risk-return potential. The calculation of VaR is based on certain assumptions hence it cannot be considered to be 100% accurate.


 Previous Article


![15 Investing.com Alternatives [Free+Paid] You Should Use in 2026](https://www.strike.money/wp-content/uploads/2026/04/Investing.com-Alternatives.jpg "15 Investing.com Alternatives [Free+Paid] You Should Use in 2026 8")
![15 TradeStation Alternatives [Free+Paid] You Should Use in 2026](https://www.strike.money/wp-content/uploads/2026/04/TradeStation-Alternatives.jpg "15 TradeStation Alternatives [Free+Paid] You Should Use in 2026 9")
![15 Chartink Alternatives [Free+Paid] You Should Use in 2026](https://www.strike.money/wp-content/uploads/2026/04/Chartlink-Alternatives.jpg "15 Chartink Alternatives [Free+Paid] You Should Use in 2026 10")
: Overview, 10 Types of Indicators, Settings for Different Markets 11")


 : Definition, Formula, calculation, Uses, Advantages Vs limitations 14")


: How We Used This 70/30 Indicator in 6 High Win-rate Strategies 17")


No Comments Yet.