An option chain is a table showing all call and put options for a stock or index, organized by strike and expiry.Option chain is used to spot support/resistance, gauge sentiment, and pick strike prices based on open interest, volume, and implied volatility.
Key components include strike price, expiry, Greeks, and IV. Analyzing the option chain helps with strategies like spreads and condors. Mistakes to avoid include over-relying on OI, ignoring IV, and trading illiquid contracts. Best strike prices are usually at-the-money or slightly out-of-the-money. Live data is available on NSE India, broker platforms, and analytics sites.
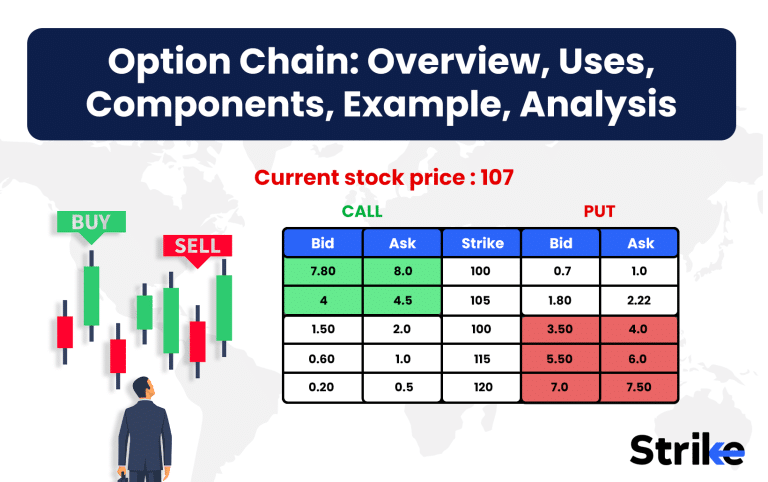
What Is an Option Chain?
An option chain is a real-time table showing all available call and put option contracts for a specific stock or index, organized by strike price and expiry date. An option chain allows traders to see the pricing, volume, and open interest for each option at a glance.
Option chains are essential tools for options traders, as they display the full range of contracts available for trading in one place. Both call and put options are listed, usually with calls on the left and puts on the right for each strike price.
The option chain updates throughout the trading day, reflecting live prices and market activity. Brokers, exchanges, and financial websites provide these data tables for free.
Option chains make it easier to compare different strikes and expiries, helping traders make quick, informed decisions. They are crucial for executing multi-leg strategies like spreads or condors.
What Is the Use of Option Chain in Trading?
The option chain is used in trading to identify market sentiment, key support/resistance zones, and optimal strike prices for various strategies. It provides a real-time overview that helps traders understand where large positions are concentrated and how the market expects the underlying asset to move.
- Identifying Support/Resistance: High open interest at specific strikes often signals support or resistance levels. Traders use this to set stop-losses or targets.
- Finding Max Pain Levels: The “max pain” is the strike where option sellers suffer the least loss at expiry. This level often attracts price movement near expiry.
- Predicting Market Sentiment: Call-dominated chains suggest bullish bias, while high put open interest points to bearish sentiment.
- Choosing Strike Prices: The option chain helps in selecting the right strikes for strategies like straddles, spreads, or iron condors, based on liquidity and implied volatility.
For example, for a stock is trading at Rs. 1,000 and open interest is highest at the 1,020 strike for calls, this level could act as resistance. Similarly, heavy put interest at Rs. 980 might signal support.
Option chain analysis supports both intraday and positional trading by showing where “smart money” is betting. This makes it a powerful tool for active traders.
What Are the Key Components of an Option Chain?
The key components of an option chain include strike price, expiry date, call and put options, bid/ask price, volume, open interest, implied volatility, and option Greeks. Each component provides unique insights into the option’s value and market dynamics.
- Strike Price: The price at which the option can be exercised.
- Expiry Date: The date when the option contract expires.
- Call Options / Put Options: Calls give the right to buy, puts give the right to sell.
- Bid Price / Ask Price: The highest price buyers are willing to pay and the lowest price sellers will accept.
- Volume: Number of contracts traded during the session.
- Open Interest (OI): Total outstanding contracts that are yet to be settled.
- Implied Volatility (IV): The market’s forecast of the underlying’s volatility; higher IV means pricier options.
- Option Greeks: Measures of risk—Delta, Gamma, Theta, Vega, and Rho.
Here’s a sample snippet.
| Strike Price | Call OI | Call IV | Call LTP | Put LTP | Put IV | Put OI |
| 1,000 | 12,000 | 18% | 30 | 28 | 19% | 16,000 |
| 1,020 | 8,500 | 17% | 22 | 40 | 20% | 12,700 |
Understanding these terms is crucial for making informed trading decisions.
What is an Example of Option Chain?
An example of using an option chain effectively can be seen in the strategy built around the 25400 and 25500 strike prices. Suppose the option chain shows heavy call open interest at the 25500 strike and the highest put open interest at the 25400 strike. This indicates a potential trading range between these two levels as expiry is just a day away.

Based on this observation, an Iron Condor strategy can be deployed. Here’s how the strikes and premiums are selected.

- Sell 25500 Call at ₹52.80
- Buy 25750 Call at ₹8.05
- Sell 25400 Put at ₹43.85
- Buy 25200 Put at ₹9.70
The maximum profit in this setup is the net premium received upfront:
Net Credit = (52.80 + 43.85) – (8.05 + 9.70) = ₹78.90
With a lot size of 75,
Max Profit = ₹78.90 × 75 = ₹5,918
Loss occurs if the price breaches either spread completely.
- Call spread width = 25750 – 25500 = 250 points
- Put spread width = 25400 – 25200 = 200 points
The wider spread determines the max loss:
Max Loss per unit = 250 – 78.90 = ₹171.10
Max Loss = ₹171.10 × 75 = ₹12,832
- Upper Breakeven = 25500 + 78.90 = 25578.90
- Lower Breakeven = 25400 – 78.90 = 25321.10

So, the breakeven zone is roughly 25322 to 25578.
How to Read & Analyze an Option Chain?
To read and analyze an option chain, follow a step-by-step process focusing on liquidity, OI, IV, and price movement. Here’s a simple guide.
- Check the Underlying Price: Find the current market price to locate at-the-money (ATM) options.
- Look for High Open Interest: Strikes with the highest OI often act as support (puts) or resistance (calls).
- Compare Bid-Ask Spreads: Narrow spreads mean higher liquidity and easier trade execution.
- Review Implied Volatility: High IV means expensive options—be cautious with buying.
- Analyze Volume: High volume confirms active participation; avoid illiquid strikes.
- Watch Option Greeks: Delta, Theta, and Vega help assess risk and reward.
- Sentiment Clues: If OI and volume spike at OTM calls, sentiment could be bullish.
For example, for a scenario where Nifty is at Rs. 22,000 and 22,000 calls have high OI, this level might resist upward moves. If 21,900 puts see rising OI, this level could act as support.
Images and color-coded tables on broker sites can help visualize these dynamics. Practice by tracking a live option chain for a few days to spot patterns.
What Is Open Interest and Why Does It Matter?
Open interest (OI) is the total number of outstanding option contracts that have not been closed or settled, reflecting the level of activity and liquidity in each strike. OI is different from volume, which counts only contracts traded in a specific session.
- High OI means more contracts are open, indicating higher liquidity and easier execution.
- Volume shows daily activity, but OI reveals longer-term participation.
For example, if the 22,000 Nifty call has 20,000 OI and 4,000 volume, there are 20,000 contracts still open, and 4,000 traded today.
OI trends help spot support and resistance. Rising put OI below market price signals support, while rising call OI above market price indicates resistance.
High OI at a strike often acts as a magnet for price, especially near expiry. This makes OI a crucial metric for both intraday and positional traders.
How Does Implied Volatility (IV) in an Option Chain Affect Pricing?
Implied volatility (IV) in an option chain directly affects option pricing—higher IV means more expensive options and greater expected price movement. IV is not an absolute number but reflects the market’s expectations of future volatility.
- High IV: Options cost more, as traders expect big moves. For example, IV often spikes before results announcements.
- Low IV: Options are cheaper, suggesting stable markets.
IV also interacts with the Greek “Vega,” which measures how much an option’s price changes with IV. A 1% IV jump could increase an option’s price by Rs. 2 if Vega is 2.
Advanced traders track IV percentile or IV rank, which show how current IV compares to its historical range. If IV is at the 90th percentile, options are expensive relative to the past.
Understanding IV helps decide whether to buy or sell options. Selling options when IV is high (and likely to fall) is a common strategy.
What Are the Greeks Shown in an Option Chain?
Option Greeks in the option chain measure how an option’s price responds to various risk factors, helping traders manage trades and predict moves. The main Greeks are:
- Delta: Probability of finishing in-the-money; also shows price change per Rs. 1 movement in the underlying.
- Theta: Measures time decay—how much value the option loses each day.
- Vega: Sensitivity to changes in implied volatility; higher Vega means price moves more with IV changes.
- Gamma: Rate of change of Delta; higher Gamma means Delta shifts quickly as price moves.
| Greek | Meaning | Typical Use |
| Delta | Price sensitivity/probability | Directional trades |
| Theta | Time decay | Selling premium, expiry plays |
| Vega | IV sensitivity | Volatility trades |
| Gamma | Delta change rate | Managing rapid moves |
Traders adjust position size, hedge risk, or time their trades for maximum advantage.
How to Use Option Chain for Intraday and Positional Trading?
Option chain data is used in both intraday and positional trading to spot momentum, confirm setups, and create watchlists. For intraday, traders watch OI build-up and volume spikes at specific strikes to catch short-term momentum.
- Momentum from OI Build-up: Sudden OI increases signal strong buying/selling at key strikes—useful for quick scalps.
- Technical Analysis: Combine option chain signals with price action, moving averages, or RSI for confirmation.
- Scalping vs. Swing: Intraday traders look for quick moves, while swing/positional traders watch OI and IV trends over days.
- Watchlist Creation: Filter for high OI, high volume, and tight spreads to select the best contracts.
For example, if 22,000 Nifty puts see rising OI and price bounces at that level, it signals strong support for intraday long trades. For positional setups, rising OI at multiple strikes helps spot the broader trend.
Smart traders use the option chain as a real-time “heatmap” for market positioning.
Where to Find Live Option Chain Data?
Live option chain data is available on major exchange websites, broker platforms, and specialized analytics sites like Market Strike.Money. The National Stock Exchange (NSE) India provides free, real-time option chains for all listed stocks and indices.
Popular sources include the below.
- NSE India (nseindia.com): Official and most reliable for Indian markets.
- Market Strike.Money: Advanced analytics, with charts, historical OI, and heatmaps.
- Broker Platforms: Zerodha, Upstox, Angel One, ICICI Direct, etc., all offer live option chains with additional tools.
- Financial News Sites: Moneycontrol, Economic Times, TradingView.
Always use official or regulated sources to avoid errors and lag. Fast data is critical for intraday traders, so test your platform’s refresh speed.
Live option chain data helps you react instantly to market changes and manage your trades with confidence.
What are the Common Mistakes to Avoid When Using Option Chain?
Common mistakes when using option chain data include over-relying on open interest, ignoring implied volatility trends, misinterpreting Greeks, and trading illiquid contracts. Avoid these pitfalls to improve your results:
- Over-reliance on OI: OI alone doesn’t give the full picture. Always check price action and volume for confirmation.
- Ignoring IV: High or low IV drastically affects option pricing. Ignoring this leads to overpaying or missing opportunities.
- Misinterpreting Greeks: Delta, Theta, and Vega must be understood in context—direction, expiry, and volatility matter.
- Trading Illiquid Contracts: Low volume and wide spreads lead to slippage and difficulty exiting trades.
- Following Crowd Blinds: High OI doesn’t always mean smart money is buying—sometimes it’s trapped traders.
Stats show that novice traders lose money largely due to these mistakes. Education and practice are key to using option chains effectively.
What is the Best Strike Price to Choose?
The best strike price depends on your trading objective, risk appetite, and chosen strategy, but generally, at-the-money (ATM) or slightly out-of-the-money (OTM) strikes offer the best balance for most traders. ATM strikes have the most liquidity and tightest bid-ask spreads.
For intraday trades, ATM or one strike OTM options are popular due to high volume and quick movement. For positional or hedging, deeper OTM or in-the-money (ITM) strikes might suit different risk-reward needs.
- ATM: Highest liquidity, good for quick trades.
- OTM: Cheaper, but lower probability of profit.
- ITM: Expensive, safer for conservative strategies.
Always consider open interest, IV, and your stop-loss levels before choosing a strike. Track how different strikes react during volatility to refine your selection process.


 Previous Article


![15 Investing.com Alternatives [Free+Paid] You Should Use in 2026](https://www.strike.money/wp-content/uploads/2026/04/Investing.com-Alternatives.jpg "15 Investing.com Alternatives [Free+Paid] You Should Use in 2026 16")
![15 TradeStation Alternatives [Free+Paid] You Should Use in 2026](https://www.strike.money/wp-content/uploads/2026/04/TradeStation-Alternatives.jpg "15 TradeStation Alternatives [Free+Paid] You Should Use in 2026 17")
![15 Chartink Alternatives [Free+Paid] You Should Use in 2026](https://www.strike.money/wp-content/uploads/2026/04/Chartlink-Alternatives.jpg "15 Chartink Alternatives [Free+Paid] You Should Use in 2026 18")
: Overview, 10 Types of Indicators, Settings for Different Markets 19")


 : Definition, Formula, calculation, Uses, Advantages Vs limitations 22")


No Comments Yet.