The inside bar candlestick pattern has been widely used in price action trading for decades, especially by traders who focus on reading market structure without relying heavily on indicators. The inside bar continues to remain relevant even in modern markets dominated by algorithms, as it reflects key moments of pause and potential expansion.
The pattern is important because it highlights compression before a move, helping traders anticipate volatility. Traders use inside bars to identify low-risk entries, breakout opportunities, and trend continuation setups, making it a simple yet powerful tool in understanding market behavior.
What is the Inside Bar Candlestick Pattern?
The inside bar candlestick pattern is a two-candle price action pattern where a small candle, called the inside bar, is completely contained within the high-to-low range of the previous candle, called the mother bar.
The inside bar candlestick pattern represents consolidation or a pause in the market before a potential breakout. It signifies market consolidation, lower volatility, and a temporary pause before a potential breakout, often used for trend continuation, reversal, or during volatility
Structure & Psychology of Inside Bar Candlestick
A valid inside bar candlestick pattern consists of two distinct components, a mother bar and an inside bar.

- Mother Bar: The first large body candle (bullish or bearish) showing a significant price range from active trading by buyers or sellers.
- Inside Bar: The second smaller candle formed completely inside the range of the mother candle, including body and wicks.
An inside bar shows a shift from strong momentum to a brief pause. The mother bar reflects strong buying or selling, while the inside bar shows indecision and reduced activity. This pause indicates that traders are waiting, positions are being absorbed, and pressure is building. When price breaks the mother bar’s range, it usually results in a sharp move as traders enter and trapped positions exit.
What Does the Inside Bar Candlestick Pattern Indicate?
The inside bar candlestick pattern primarily indicates market consolidation, indecision, and a potential pause. It reflects a state of temporary pause in price momentum after a strong move, showing that neither buyers nor sellers are in clear control at that moment.
From a structural point of view, the shrinking range means price is compressing. Psychologically, it reflects indecision and hesitation, creating a temporary balance between demand and supply.
Different Types of Inside Bar Patterns
There are three main types of candlestick pattern involving inside bars, which are categorized based on the direction of break and a number of inside candles. These specific types of candlestick pattern include bullish inside bars, bearish inside bars, and multi-inside bars.
Bullish Inside Bar Candlestick Pattern
The inside bar is considered to be a bullish inside bar when the price breaks above the high of the mother bar, signaling potential upward continuation or reversal, depending on where it appears in the trend.

When a bullish inside bar appears within an uptrend, it functions as one of the Bullish Candlestick Patterns suggesting a trend continuation after a brief pause, whereas when such Bullish Candlestick Patterns appear after a downtrend, they suggest an upward reversal.
Bearish Inside Bar
An inside bar is considered to be a bearish inside bar when price breaks below the low of the mother bar, signaling potential downward continuation or reversal, depending on where it appears in the trend.

When a bearish inside bar appears within a downtrend, it acts as one of the Bearish Candlestick Patterns suggesting a trend continuation after a brief pause, whereas when such Bearish Candlestick Patterns appear after an uptrend, they suggest a downward reversal.
Multiple Inside Bar Pattern
Multiple inside bars, also known as inside bar coils, form when more than one inside bar candle forms within the range of the single mother candle. This series of small inside bars creates a coil-like structure, indicating a period of tight consolidation and low volatility, where the market prepares for the big move.

More the inside bar, higher is the breakout potential. This pattern works best near key levels or before major moves, especially when applied in the right market context.
What is the “Mother Bar” in an Inside Bar Setup?
The mother bar in an inside bar setup is the first largest body candle within which the following inside bars are formed. The Mother bar represents a strong move or price expansion after which the market pauses and consolidates. The range (high and low) of this candle becomes a critical zone for the market to decide its trend.
- When the price breaks above the high of the mother candle, it is considered a bullish breakout.
- When the price breaks below the low of the mother candle, it is considered a bearish breakout.
The size of the mother bar represents its strength. A large mother bar represents strong momentum but has a wider stop loss, whereas the smaller mother bar gives a weaker signal with a tight stop loss.
Is Inside Bar Bullish or Bearish?
An inside bar is neither inherently bullish nor bearish; it is a neutral candlestick pattern that represents a pause or consolidation in the market. The direction (bullish or bearish) entirely depends on the break of the mother candle, location, and prior trend.
Price breaking above the mother candle’s high suggests a bullish trend, whereas price breaking below the low of the mother candle suggests a bearish trend. The probability of a bullish breakout is high in an already established uptrend. Similarly, the probability of a bearish breakout is high in an already established downtrend.
How to Identify an Inside Bar Candlestick Pattern?
There are four main steps to identify the inside bar candlestick pattern. The steps are briefly discussed below.
- Locate a Strong Trending Move: First look for a clear uptrend or downtrend, because inside bars work best when they are formed in a trending market, as they represent a pause before a trending move.

- Identify the Mother Bar: Spot the large dominant bar after the trend marked by a wide high-to-low range. This usually stands out due to its size and momentum compared to its surrounding candle.

- Check the Inside Bar Condition: The next candle after the mother candle should have a high lower than the mother candle’s high and a low higher than the mother candle’s low. If both the conditions are met, it is marked as a valid inside bar.
- Multi-timeframe Confirmation: Switch to a higher timeframe to verify the pattern aligns with the broader timeframe. Multi-timeframe alignment increases the probability of successful breakout.
By following these steps, traders can accurately identify inside bar patterns and improve their chances of trading high-probability setups with better confirmation.
How to Trade the Inside Bar Candlestick Pattern [With Examples]
The inside bar candlestick pattern can be traded in three different ways depending on the market context and intent behind the setup. The three different setups are briefly discussed below.
Inside Bar Breakout Strategy
It is a classic volatility-explosion trading strategy where traders wait for the price to break the range of the mother bar after a consolidation. To trade an inside bar breakout, follow the four major steps mentioned below.

- Identification: Identify a large mother candle followed by a small candle formed completely inside, representing a pause.
- Entry: Enter a long position when the price breaks the high of the mother candle or enter a short position when the price breaks below the low of the mother candle. Always wait for the candle to close for a confirmed breakout.
- Stop loss: Place your stop loss to the opposite side of the mother bar.
- Profit Target: Set your profit target for a minimum of a 1:2 RR, previous swing points, or key levels.
The chart of SBIN pasted above shows the formation of a bearish inside bar below the 50-day moving average, providing a prime opportunity for Breakout Trading. Hence, we took the short position as part of our Breakout Trading strategy after confirmation and targeted 1:2 RR.
Inside Bar Trend Continuation Strategy
In a trending market, an inside bar acts as a pause before the market continues its prevailing trend. Traders look for such an inside bar in a trending market and enter a trade in the direction of the trend after the price breaks the inside bar pattern. To trade the inside bar continuation strategy, follow the four major steps mentioned below.

- Identification: Identify a clear trending market by marking higher highs/lows or moving averages.
- Entry: Enter a long position when the price breaks the high of the mother candle in an uptrend or enter a short position when the price breaks below the low of the mother candle in a downtrend. Always wait for the candle to close for a confirmed breakout.
- Stop loss: Place your stop loss to the opposite side of the mother bar.
- Profit Target: Set your profit target for a minimum of a 1:2 RR, previous swing points, or key levels.
The chart of HCL Technologies pasted above shows the formation of higher highs/lows above the 50-day moving average, suggesting an uptrend ideal for Continuation Trading. We took a long entry in the direction of the trend after the price formed a bullish inside bar during retracement, confirming a high-probability Continuation Trading setup.
Inside Bar Reversal Strategy
This strategy involves identifying the inside bar pattern at key support and resistance levels to trade potential trend reversals after a failed move or exhaustion. To trade the inside bar reversal strategy, follow the four major steps mentioned below.

- Identification: Identify an inside bar at a key support or resistance level after an extended move.
- Entry: Enter a short position when the price breaks the low of the mother candle at resistance or enter a long position when the price breaks above the high of the mother candle at support.
- Stop loss: Place your stop loss to the opposite side of the mother bar.
- Profit Target: Set your profit target for a minimum of a 1:2 RR, previous swing points, or key levels.
The chart of TATA Power pasted above shows the formation of a bearish inside bar near a strong resistance level. Hence, we took the short position after confirmation and targeted 1:2 RR.
Which Technical Indicators work Best with Inside Bar?
There are four major indicators that work best with inside bars. The indicators are moving averages, MACD, RSI, and volume.
- Moving Averages: Moving averages such as 20-period and 50-period help to identify market trends and act as dynamic support and resistance. Consider trading a bullish breakout if the price is trading above the moving average and a bearish trade if the price is trading below the moving average. They ensure the pattern aligns with the prevailing direction, avoiding counter-trend traps.

- MACD (Moving Average Convergence Divergence): MACD helps confirm strengths of inside candle breakouts. A MACD bullish crossover supports a bullish crossover, and a MACD bearish crossover supports a bearish breakout.

- RSI (Relative Strength Index): RSI helps understand momentum and overbought/oversold zones. RSI above 50 signals bullish momentum and supports bullish inside bar breakout, whereas RSI below 50 signals bearish momentum and supports bearish inside bar breakout.

Avoid extreme RSI overbought and oversold conditions for inside bar trend-continuation trades.
- Volume: Volume helps confirm the involvement of big players. When price breaks the inside bar candle pattern with good volume, it signals a strong move driven by big players, whereas low volume during a breakout has the risk of a false breakout.

Combining an inside bar with key levels and different indicators gives a clear edge, instead of relying on the pattern alone.
Which Timeframe is Best for Inside Bar Trading?
Higher timeframes, such as daily and weekly, are considered to be the best timeframes for trading inside bars, with 4‑hour as a strong alternative for swing/intraday traders.
Such higher timeframe inside bar candle patterns form over long periods of time, so they involve more real trading volume and fewer false breakouts than 1‑min or 5‑min charts. However, the lower timeframes, such as 5 min, 15 min, or 30 min, also provide a valid inside bar setup, but most of them are noise.
The table below shows the reliability and characteristics of inside bar patterns across different timeframes.
| Trading Style | Best Inside-Bar Timeframe | Why It Works Well |
| Swing / Position | Daily (primary) | Fewer, cleaner inside bars with less noise, better trend alignment, and easier risk management |
| Day Trading | 4-hour or 1-hour (on liquid stocks/FX) | Balanced structure with relatively low noise and sufficient trading opportunities |
| Intraday / Scalping | 15-minute or lower (with strict filters) | More frequent setups but highly noisy; requires strong context, volume, and strict risk control |
| Discretionary Trend-Following | Daily + 4-hour (multi-timeframe) | Higher timeframe confirmation with lower timeframe entries for better precision and risk-reward |
The effectiveness of inside bars depends less on timeframe and more on context, clarity, and confirmation.
Advantages vs Limitations of a Inside Bar Pattern
The advantages vs. limitations of the inside bar pattern are mentioned below in the table.
| Advantages | Limitations |
| Simple and easy to identify on charts | Can give false breakouts, especially in sideways markets |
| Works across all timeframes | Less reliable on lower timeframes due to noise |
| Helps capture breakout moves early | Requires confirmation (trend, volume, levels) |
| Provides clear entry and stop-loss (mother bar range) | Not effective in highly choppy or low-volume markets |
| Useful in both continuation and reversal setups | Alone does not indicate direction |
| Can be combined with other strategies (trend, S/R, indicators) | Overtrading risk due to frequent formations |
Inside bars are powerful when used with context, but trading them blindly can lead to false signals and traps.
How Reliable is the Inside Bar Pattern?
The inside bar is a moderately reliable pattern that mainly shows consolidation, not direction, so traders wait for a breakout for confirmation. Its effectiveness depends on market context and trend rather than the pattern alone.
According to the Encyclopedia of Chart Patterns and Japanese Candlestick Charting Techniques, both cornerstone references for Technical Analysis, the success rate of inside bars is around 50–55%, with continuation near 52% and favorable reversal cases reaching up to 65% in Technical Analysis applications.
Inside Bar vs Similar Candlestick Patterns
There are several candlestick patterns that may look similar to the inside bar at first glance, but each has a different structure and meaning. Such similar candlestick patterns are briefly discussed below.
- Inside Bar vs. Harami Pattern: Both patterns look similar, but the inside bar uses the full range (high-low) of the candle, whereas the harami considers only body length. The inside candle is a neutral candlestick pattern where it can signal trend continuation or reversal, whereas the harami is a trend reversal candlestick pattern requiring strict color and body containment.

- Inside Bar vs. Doji: They both signal market indecision, but an inside bar is a two-candle pattern showing consolidation, while a doji is a single candle with equal open and close, showing pure indecision. An inside bar builds pressure, whereas a doji shows hesitation.

- Inside Bar vs Engulfing Pattern: An inside bar shows range contraction (a pause). While an engulfing pattern shows strong dominance, where the second candle fully overtakes or engulfs the first. Hence, an engulfing candle shows a momentum shift, and an inside bar shows waiting or a phase.

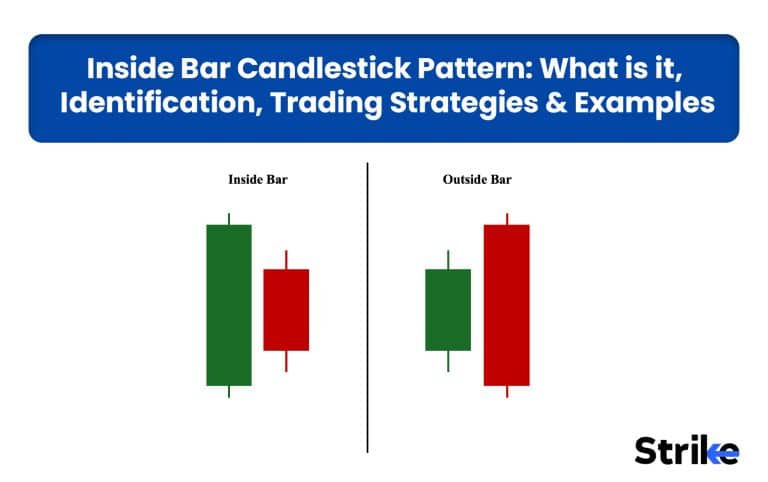
- Inside Bar vs. Outside Bar: An inside bar shows a reduction in volatility (range inside the previous candle), while an outside bar shows an increased volatility (range breaks both sides). Hence, inside bar signals buildup and outside bar signals expansion and strong activity.

An inside bar means the market is resting before a move, while other patterns like engulfing or outside bars show the move is already happening.


 Previous Article


![15 Investing.com Alternatives [Free+Paid] You Should Use in 2026](https://www.strike.money/wp-content/uploads/2026/04/Investing.com-Alternatives.jpg "15 Investing.com Alternatives [Free+Paid] You Should Use in 2026 72")
![15 TradeStation Alternatives [Free+Paid] You Should Use in 2026](https://www.strike.money/wp-content/uploads/2026/04/TradeStation-Alternatives.jpg "15 TradeStation Alternatives [Free+Paid] You Should Use in 2026 73")
![15 Chartink Alternatives [Free+Paid] You Should Use in 2026](https://www.strike.money/wp-content/uploads/2026/04/Chartlink-Alternatives.jpg "15 Chartink Alternatives [Free+Paid] You Should Use in 2026 74")
: Overview, 10 Types of Indicators, Settings for Different Markets 76")

 : Definition, Formula, calculation, Uses, Advantages Vs limitations 78")


No Comments Yet.