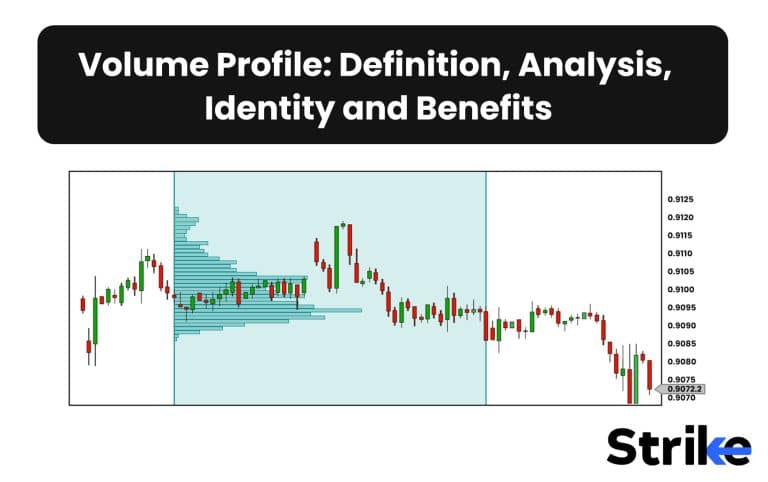
A Volume profile is a horizontal histogram that overlaid on the chart. Volume profit helps you see a graphical representation of where price has been most of the day and this includes highlights of peak volume areas and mean value areas, so basically you can see where the most action is happening price and sorted in price action. The Volume profile is a visual representation of the volume at each price level over a certain time period.
It provides a unique take on the old concepts of support and resistance but trading activity and participation, value areas and fair prices and trading signals. This is because it shows how much trading has occurred at each price level, providing a way to discern the psychology behind a market’s movements, and helping traders make well-guided decisions.
Support and resistance levels are essential concepts in technical analysis. They indicate price levels that a stock has previously had difficulty moving beyond. Areas of high volume are frequently considered levels of support or resistance. This is because these are the price levels where a large amount of trading activity has taken place, indicating strong interest from traders.
For example, a peak in the Volume Profile may indicate a level of support or resistance. If the price of the stock begins to fall, the peak may act as a support level because it represents a price at which a significant number of investors have previously purchased the stock. Similarly, if the price begins to rise, a peak in the Volume Profile could act as resistance, as it represents a price level at which a large number of investors have previously sold.
Traders are able to better analyze market activity, identify support and resistance levels and trends, determine value areas, and spot trading opportunities. This makes volume profiles an invaluable tool for achieving an edge in trading markets.
What Is Volume Profile?
A Volume profile is an advanced technical analysis tool that displays the amount of trading activity occurring at different price levels over a specified time period. Volume profiles provide a horizontal graphic representation of volume across prices, Unlike traditional volume bars on price charts, allowing traders to easily visualize how much volume is occurring at each price level.
The volume profile indicator was first developed in the 1980s by J. Peter Steidlmayer, a trader at the Chicago Board of Trade. Steidlmayer found that by analyzing volume data across prices rather than in a vertical bar format, he could better identify value areas and detect where significant trading activity was occurring in markets. This led to the creation of the volume profile methodology.
There are five key components of a volume profile chart.
The value area represents the price range with the most trading volume and participation over the specified time period. It indicates where the majority of trading activity is concentrated and is considered the fair market value or point of control for that period. The upper end of the value area represents 70% of volume, while the lower end represents 30% of volume. The chart uploaded below is an example of how volume profile (visible range) looks like when applied on the candlestick charts. The blue and yellow bars represent up and down volumes respectively. The length of the bars represent the intensity of the volume that was traded for that particular time and price.

The specific price shows the highest amount of trading volume and interest over the specified time period. This is considered the most accepted price by the market and a key level for potential support or resistance. The chart below portrays how the bars can be extrapolated on the price charts that may work as potential support and resistance levels because traders have interest on these price levels.

Price levels that saw significantly higher trading volume than surrounding prices. These act as support and resistance levels as they indicate high participation from traders.
The opposite of HVNs, these are price areas with very low volume and minimal participation from traders. LVNs often act as exhaustion points and present trading opportunities when prices meet low liquidity.
Isolated volume occurring at a single price level. These often represent short-term imbalances between buy and sell orders. Trading at single-print levels often finds fast profits. The zones marked below in the image are the areas of low liquidity or activity.

Volume profiles are most commonly built over a single trading session, such as one day for an intraday profile or a week for a short-term swing profile. However, profiles are constructed over any user-defined time period to analyze the specific market conditions over that timeframe. Longer-term volume profiles spanning months also identify major support and resistance levels.
It is easy to identify value areas, high volume nodes, and low volume nodes with a volume profile. These indicate the price levels that attract significant trading interest as well as potential support or resistance levels. You are able to determine the directional conviction within a price swing by observing whether the POC is closer to the high or low of the range. Near the highs, there is strong upside conviction. You will be able to spot imbalances between volume traded near the high and the low.
A greater number of transactions occurring near the highs reflects strong bullish sentiment. It reveals the location of optimal trade entry and stop-loss levels based on volume activity rather than only price levels. It provides greater clarity on the strength of breakouts and the likelihood of follow-through by analyzing volume at key price levels. You gain insight into order flow and accumulation/distribution based on the levels that show high participation vs. low participation.
There are types of volume profiles, including daily, bracket, composite, composite point of control (CPOC), and anchored VWAP profiles. Intraday traders most commonly use 30 or 60-minute volume profiles over the trading session to identify intraday support or resistance levels, observe volume trends, and look for potential imbalances to trade from HVNs to LVNs. In the image uploaded below, we can observe how the indicator works on lower time frames.

No single indicator provides a perfect trading solution. When combined with other forms of technical analysis such as price action and trend analysis, volume profiling provides a valuable method to gain greater insight into market conditions and discover trading opportunities. Just as Steidlmayer realized decades ago, analyzing the horizontal distribution of volume across prices reveals much more market information than the standard vertical volume histogram.
How Can Volume Profile Improve Your Analysis?
Transforming volume data into a horizontal graphic, the volume profile offers a clearer perspective on how volume is distributed across different price levels over time. This grants identification Value Areas and Fair Value. The value area and point of control levels highlight the price range and specific prices attracting the most trading volume and activity. This allows traders to identify fair market value better than simply referencing high and low prices. Value areas indicate the greatest agreement between buyers and sellers.
The Volume profile shows if more volume is occurring near the high or low of a price swing. Heavy volume near the highs reflects strong upside conviction and the potential for continuation towards upside. High volume near lows indicates strong selling pressure. Low volume or single prints near the extremes signal exhaustion. Areas with heightened trading activity and volume form significant support and resistance levels with a higher probability of holding. These become optimal areas for placing stop losses or targeting profit taking. Lower-volume nodes also present potential breakout opportunities. Comparing the placement of volume clusters and points of control over consecutive days or weeks reveals the strength and directional bias of the prevailing trend.
Consistent POC near highs reflects bullish control. Falling POCs show distribution and bearish control.
The volume profile highlights whether breakouts occur on heavy volume or light volume. Breakouts with wide-spread participation have a higher chance of continuing than low-volume breakouts, which are more prone to failure. Volume spikes and single prints appearing away from value areas often signal short-term imbalances between buying and selling. Traders take advantage of these temporary volume deviations, or “excess” by anticipating the reversion back to value. Volume data improves risk management by providing objective levels for entering trades and placing stops based on activity rather than only price levels. Entries and stops based on high-volume areas lead to higher-probability trades.
Analyzing volume horizontally also delivers a visual representation that allows traders to instantly recognise key levels and observe market dynamics. This “volume fingerprint” provides an efficient perspective compared to viewing individual volume bars. Below are six main patterns to look out for.
Bell Shape
The ideal volume profile has a bell curve appearance, showing the greatest volume at fair value, with activity decreasing at extreme highs and lows. This reflects efficiency in the market.
Left/Right Skew
These distributions tilted more left or right indicate directional conviction in the market and define trade bias. The Left skew reflects bearish control, while the right skew shows bullish strength.
Bimodal
Double “humps” in the volume profile suggest two main pools of liquidity and potential areas of support or resistance. Where these overlap, it is considered a balanced value.
Spikes
Protruding volume spikes beyond the profile show excess and stop runs. These present reversion opportunities back to the value area.
Single Prints
Isolated volume with no overlap shows an extreme imbalance between buyers and sellers. Trade in the direction of excess by fading these anomalies.
P & V Reversals
Volume profile “P” reversals show market rejection, while “V” reversals indicate market acceptance. Plotting these on profile charts creates powerful trade signals.
The nuanced analysis and definitive trading signals revealed through volume profiling greatly enhance technical analysis. Markets reflect the psychology and activity of human participants. The Volume profile provides the clearest representation of that market activity across prices over any time frame. Just like advancements in market internals and order flow analysis, volume profiling allows traders to assess markets from a professional perspective rather than just price action alone.
How Can Traders Use Volume Profile Charts to Identify Support and Resistance?
One of the key applications of volume profile analysis is identifying levels of support and resistance. The volume profile clearly highlights the specific price levels where significant trading interest and participation exist. Areas of high volume indicate strong support and resistance levels due to the extensive activity of buyers and sellers at those prices. Low-volume areas represent weaker support or resistance. Volume profile analysis allows traders to quickly visualize and focus on the most significant levels.
There are three main components revealed through volume profiling that are used to effectively determine support and resistance.
The value area, comprising the 70% and 30% volume levels, indicates the price range containing the highest amount of trading activity and participation. Value areas show where buyers and sellers are most accepting of current prices. Thus, the upper and lower boundaries of the value area represent the first levels of support and resistance. The more trading occurs within the value area, the stronger it will act as support or resistance. Changes in the placement and shape of the value area over time reveal shifts in market control.
Volume spikes protruding outside of the primary value area reflect heavy trading interest at specific price levels. These High Volume Nodes (HVNs) act as strong support and resistance areas due to the high participation occurring there. It takes greater market effort to absorb the orders and volume clustered at HVNs. Traders often observe HVNs over consecutive volume profiles to detect areas attracting large trading interest over an extended period. The image attached below shows examples of value area, HVN’s, LVN’s and areas of imbalances that can be used by short term traders. In the image below, one can observe, below the black support, the imbalance exist. Volume may try to settle here and target the original value area (red line) where the traders may find interest to support the price action.

Single prints are isolated volume occurrences at one price level. Low Volume Nodes (LVNs) reflect much lower participation. Both single prints and LVNs represent potential weaknesses in the market. When price pushes into these regions with lower liquidity, it signals an imbalance between buying and selling pressure. Fading price extremes into these lower volume levels provide profitable reversion trades back to value areas and HVNs. The lack of substantive support or resistance allows for easier breakouts.
What Are the Benefits of Using Volume Profile Indicators?
Transforming volume data into a visual horizontal graphic, volume profiles offer unique advantages over standard volume indicators. Below listed are the main ten.
1. Identifies Value Areas and Fair Value
The value area highlights the price range containing the point of control — the level with the highest trading volume and participation. This allows traders to quickly identify the fair market value supported by the most buyers and sellers. Value areas indicate balanced areas likely to hold support/resistance.
2. Determines Directional Conviction
The placement of prominent volume clusters indicates whether bulls or bears are in control. Volume near to highs reflects growing buying pressure, while volume near lows signals increasing bearish control.
3. Reveals Support and Resistance Levels
Volume spikes protruding outside the value area form important support or resistance levels. These high-volume nodes (HVNs) attract extensive market activity and participation, requiring greater effort to break through. Low-volume nodes (LVNs) offer weaker support or resistance for breakouts.
4. Measures Trend Strength
Comparing volume profile positioning over multiple periods reveals the strength of prevailing trends. Consistent value areas and POCs shifting higher or lower show who has control.
5. Evaluates Breakouts
The volume profile shows if breakouts are occurring with widespread market acceptance or only limited activity. High-volume breakouts are more likely to continue than low-volume failures.
6. Detects Imbalances
Volume anomalies and single prints appearing outside of value identify localised imbalances between buyers and sellers to exploit.
7. Improves Risk Management
Volume profiling provides objective entry, exit, and stop-loss placement based on activity rather than only price levels. High-probability setups occur when trading in the direction of excess volume.
8. Creates a Market Activity Fingerprint
The volume profile generates a clear graphic depiction of market participation across prices over any time period. This visual perspective provides more insight than stand-alone volume bars.
9. Identifies Trade Opportunities
Specific volume profile patterns reveal high-probability trading opportunities. Key formations include reversals of value, fades from single prints, rejections at POC, and trends between value areas.
10. Confirms Other Indicators
Volume profiling validates or contradicts signals from momentum oscillators, moving averages, chart patterns, and other indicators based on the positioning of volume clusters. Divergences warn of potential reversals.
Beyond these advantages, volume profile analysis also promotes a greater understanding of market dynamics by assessing how volume and price interact. Markets reflect human behavior— the repeating patterns of market participants as shown through price action and its resulting volume footprint. Volume profiling provides perspective on developing market sentiment, participation, and conviction over time through its exposure of volume activity across prices. Just as advancements in market internals and the availability of order flow data have progressed analysis, studying the horizontal volume landscape takes knowledge beyond standard volume and price indicators.
What Are the Downsides of Using Volume Profile Indicators?
There are also some limitations and downsides that traders should be aware of. Below are seven main disadvantages.
1. Requires Significant Skill to Master
Interpreting volume profiles effectively takes considerable practice. Nuances like evaluating the shape of profiles, volume placements, single prints, and pattern formations demand technical expertise. Without experience, the benefits will be limited.
2. More Resource Intensive
Calculating and charting volume profiles in real time requires more computing power than standard indicators. The programming and system resources are greater, especially for tick or range charts.
3. Data Needs May Increase Costs
Detailed volume data comes at a price from data providers. Real-time tick volume and order flow data needed for intraday volume profiles can increase subscription expenses.
4. Subject to Data Errors and Gaps
Volume profiles are only as accurate as the volume data used to generate them. Any gaps or errors in the data will create flaws in the profiles. This is a particular issue with real-time intraday profiles.
5. Can’t Be Backtested Easily
Unlike price data, detailed historical volume data is not readily available. This makes traditional technical backtesting of volume profile strategies very difficult without an associated order flow dataset.
6. Difficult to Automate Signals
The complex analysis of volume profile shapes, patterns, and nuances makes effectively automating trading signals very challenging. Coding volume profile signals in a trading system require advanced programming skills.
Potential to Overcomplicate Analysis
Too much focus on volume profiling intricacies could distract from the core price action, trend, and momentum structure of the market. Overreliance can undermine simplified trading plans.
The efficacy of volume profiling depends greatly on a trader’s skill level, attention to key details, ability to combine it with price and trend analysis, and ability to objectively test strategy results over time. No indicator alone defines a complete trading plan. The most successful traders use volume profiling judiciously as part of a robust, nuanced, yet disciplined trading approach.
How to Use a Volume Profile?
To use a volume profile, select an appropriate time frame. Intraday traders will use 5, 10, or 30-minute volume profiles within the trading session. For swing trading, daily, weekly, or monthly profiles are more suitable. Choose a time frame that matches your strategy’s holding period.
Determine the profile range. A variety of range calculations are used for building profiles, including fixed points, standard deviations, ATR channels, and volatility percentiles. Many platforms have presets, but traders customize their own profile range parameters.
Identify value areas, POCs, HVNs. Locate the value area, point of control, high-volume nodes, low-volume nodes, and single prints on the profile. Focus on their placement relative to the price swings high and low. This reveals developing market control and sentiment.
Combine with price action analysis. Determine the volume profile in the context of overall price action, including trend structure, support or resistance levels, moving averages, chart patterns, and other formations on the price chart.
Look for reversion/continuation signals. Use key volume profile signals like value area rejections, fades from HVNs, volume skew changes, bimodal shifts, and single prints. Confirm with price action context for timing entry.
Plot prior-day profiles for comparison. Viewing the current day’s profile versus the prior day(s) profile reveals evolution in market control and participation. Shifts in value area placement are important to note.
Update and adjust intraday. For intraday trading, rebuild volume profiles in real-time as the session progresses. Adjust key levels and tactics as intraday conditions evolve.
Review performance over time. Track trading results from volume profile strategies separately. Eliminate bias by objectively measuring performance in real market conditions over the long term.
How Does Volume Profile Analysis Help Identify Market Trends and Potential Breakouts?
Volume profile analysis provides a unique perspective for measuring developing trends and anticipating potential breakouts. By transforming volume into a horizontal graphic, the volume profile offers key insights into emerging market sentiment and conviction that traditional bar charts cannot reveal.
Comparing current volume profile positioning to previous days or weeks reveals which market side — buyers or sellers — is gaining control. Points of control and value areas shifted higher, signaling growing uptrend conviction. Falling POCs and value areas indicate distributional and emerging downtrends.
The placement of prominent volume clusters shows if buyers or sellers are dominating at current prices. Volume aggregated nearer highs reflects bullish conviction, while volume clustering near lows represents bearish control. This helps determine upside or downside trend strength.
Volume spikes extending outside the primary value area often represent short-term excesses and imbalances between buying and selling. These present potential fading opportunities back to the value area and point of control.
The volume profile shows whether breakouts are occurring on wide-spread market acceptance above average volume or only limited excess volume. High-volume breakouts have a greater probability of follow-through.
Volume spikes form areas of support and resistance where buyers or sellers are active. Plotting these high volume nodes (HVNs) on prior days profiles identifies key levels that could spark breakouts once breached. The image below represents how traders can interpret the information given by the indicator and how the information can be utilized to take trades.

Confirm volume profile signals and control shifts with momentum oscillators, moving averages, and other directional indicators to properly time entries for trends and breakouts.
Intraday traders also build volume profiles over shorter segments of the day to identify intraday cycles, value areas, and HVNs relevant for that timeframe. 1-hour or 30-minute profiles help locate intraday support and resistance levels to monitor for breakouts and position entry triggers.
How Can Traders Use Volume Profile Data to Identify Opportunities?
High Volume Nodes (HVN) are price levels at which a high amount of trading volume has occurred. They represent levels of strong support or resistance because they indicate a price level where the market has shown strong interest in the past. This means that if the price reaches an HVN, it is likely to find support there and bounce back up. Conversely, if the price falls to an HVN, it is likely to find resistance there and bounce back down.
Low Volume Nodes (LVN), on the other hand, are price levels with less trading volume and indicate a price level where the market found less agreement. This means that if the price reaches an LVN, it is likely to continue moving in the same direction, as there is less support or resistance at that level.
A value area is a price range where 70% of the trading volume took place during the specified time period. Prices within the value area are deemed fair by the market participants, and any move outside this range indicates a market imbalance and creates potential trading opportunities. For example, if the price is trading above the value area, it may be a sign that buyers are in control and the price is likely to continue moving higher. Conversely, if the price is trading below the value area, it may be a sign that sellers are in control and the price is likely to continue moving lower.
Volume profiles can also be used to confirm the direction of a trend. If the volume profile is showing more volume being traded at higher prices, it indicates a bullish trend. Conversely, if more volume is being traded at lower prices, it suggests a bearish trend.
When there’s a shift in the point of control (the price level with the highest traded volume), it is a sign of a possible reversal. If, for instance, the point of control moves higher, it may signal an upward trend.
Several studies and successful trading strategies have incorporated volume profile as a crucial aspect. For instance, a study by Harris, Lawrence in 2010 found that high-volume trading levels often act as a magnet for future prices, demonstrating the predictive power of volume profile data.
How Can Traders Use Volume Profiles to Improve Their Risk Management Strategies?
Incorporating volume profile analysis into a trading plan significantly enhances risk management approaches. Revealing areas of heightened market participation helps volume profiles provide traders with greater precision in determining trade location, stop placement, and profit targets.
Volume profiles spotlight the specific price levels attracting the highest amount of market activity and interest. Executing trades at or near these high-volume nodes increases the probability of trade success.
Combining volume profile signals with price action context allows traders to properly time entries and exits. Waiting for price confirmation of volume points often leads to better fills and the avoidance of false breakouts.
Placing stops just above or below prominent volume clusters provides logical exit points if price action goes against the trade. Stops have a higher chance of holding in heavy-volume areas.
Volume profiling identifies substantial support and resistance levels to target for taking profits. Cashing out winners near the next significant high-volume area optimizes reward potential.
Determining the positioning of volume clusters reveals developing momentum. Trading in the direction of strong volume conviction confirmed by price expands reward-risk potential.
Executing fades near single prints and volume voids takes advantage of localized excesses beyond the value area. Trading back to value balances risk.
Volume profile analysis over multiple time frames also aids intraday risk management by revealing key intraday levels for trades. Shorter period volume profiles define intraday value areas, flags, and HVNs relevant for intraday scalping strategies with tighter stops.
The key is utilizing volume profiling in combination with wider technical analysis when assessing risk management tactics. For example, entering breakouts only at volume profile HVNs that align with bullish price patterns and momentum indicator signals creates a robust approach. Volume profiling should enhance, not complicate, risk management.
How Do Market Participants Use Volume Profile Analysis for Trading Decisions?
Volume profile can be used by traders to get important information regarding market situations. The indicator will provide an area of potential support and resistance. The information gained by watching the indicator can be combined with price action analysis to get even better insights regarding market activity. Short term traders can also take insights from the indicator to get trading setups. HVN can go complementary with price action and provide a solidified view about market activity.
Value areas frame key levels for swing entries. Historically, floor traders like the original profile user, Peter Steidlmayer, benefitted from visually seeing market-generated volume profiles in real time. This aided local trading decisions on the floors.
Is the Volume Profile a Good Indicator?
Yes, the Volume Profile is a good indicator. It is used to identify areas of support and resistance, as well as potential entry and exit points. It can also be used to gauge the strength of a trend.
Is the Volume Profile a Lagging Indicator?
Yes, the Volume Profile is a lagging indicator. This is because it measures the volume of trades that have already occurred rather than predicting future volume. A Volume Profile, however, can be a useful tool for identifying support and resistance levels as well as potential areas of interest for future price movement.
What Are the Critical Differences Between Volume Profiles and Traditional Technical Analysis Tools?
Volume profiles and traditional technical analysis tools take different approaches to analyzing markets. Volume profiles focus specifically on the volume traded at certain price levels. They identify areas of high and low liquidity which can act as support and resistance. Volume profiles also help traders spot potential reversals early. In contrast, traditional technical analysis utilizes indicators and chart patterns based primarily on price and moving averages. These seek to identify trends, ranges, and chart patterns to forecast future price action.
A key advantage of volume profiles is they provide a more accurate picture of market participation than just price data. The volume nodes and peaks clearly highlight zones of liquidity and potential support and resistance. Volume profiles can be more useful in spotting reversals as volume precedes price. However, traditional technical analysis tools like moving averages are more widely used and easier to interpret for most traders. They can more clearly identify ongoing trends and reversals using price action and indicators.


 Previous Article


![15 Investing.com Alternatives [Free+Paid] You Should Use in 2026](https://www.strike.money/wp-content/uploads/2026/04/Investing.com-Alternatives.jpg "15 Investing.com Alternatives [Free+Paid] You Should Use in 2026 40")
![15 TradeStation Alternatives [Free+Paid] You Should Use in 2026](https://www.strike.money/wp-content/uploads/2026/04/TradeStation-Alternatives.jpg "15 TradeStation Alternatives [Free+Paid] You Should Use in 2026 41")
![15 Chartink Alternatives [Free+Paid] You Should Use in 2026](https://www.strike.money/wp-content/uploads/2026/04/Chartlink-Alternatives.jpg "15 Chartink Alternatives [Free+Paid] You Should Use in 2026 42")
: Overview, 10 Types of Indicators, Settings for Different Markets 43")


 : Definition, Formula, calculation, Uses, Advantages Vs limitations 46")


No Comments Yet.