The spinning top candlestick pattern frequently appears during the market’s transitional phase from momentum to uncertainty, making it an important point to watch for traders. The spinning top candlestick pattern helps traders spot early trend change signals or pauses in the market.
Japanese traders have been observing spinning tops for centuries, originally used by 18th-century rice traders to interpret shifts in market psychology. Spinning tops gained popularity in the late 20th century, getting tracked widely across equities, forex, and commodity markets. Traders observed that spinning tops often appear during slowing momentum, potential exhaustion, or temporary pause, making them an important pattern to study in depth before making trading decisions.
What is the Spinning Top Candlestick Pattern?
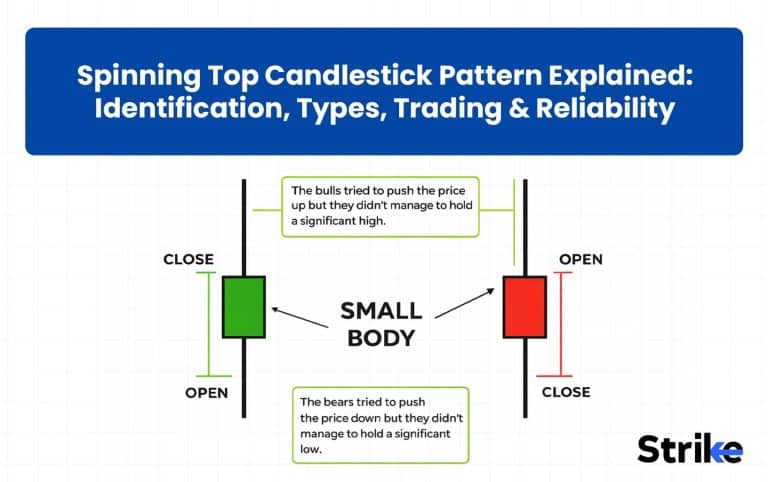
A spinning top is a neutral single candlestick pattern characterized by a small real body and long upper and lower shadows, that signal market indecision between buyers and sellers. A spinning top often appears after a strong trend and signals a potential pause or possible reversal, depending on confirmation from the next candle.
What Does the Spinning Top Candlestick Indicate?
A spinning top candlestick primarily indicates market indecision and loss of momentum, where neither buyers nor sellers gained control. During the session, buyers push the price higher, forming the upper shadow, whereas sellers push the price lower to form the lower shadow, but the price eventually closes near the open, forming a small real body. This tug-of-war reveals uncertainty, exhaustion, and hesitation.
How to Identify a Valid Spinning Top Candlestick Pattern
Identifying a valid spinning top candlestick pattern involves checking three major criteria. Three major criteria are body size, wick size, and market move.

- Small Real Body: The open and close price should be between 25-30% of the total range of the candle. The color of the candle does not matter.
- Long Upper and Lower Shadows: A shadow should be at least 2X the length of the body. Both upper and lower shadows should be equal in length (slight variation is acceptable).
- Appears After a Clear Move: A spinning top is more reliable when formed after a clear trend. In sideways markets, it only shows a continuation of indecision.
When these three conditions align, the spinning top becomes a high-quality signal of a potential trend pause or reversal. Proper identification helps filter weak setups and improves overall trading accuracy and decision-making confidence.
Types of Spinning Top Candlesticks
There are two major types of spinning top candlestick patterns based on the location and the next confirmation candle, making them an important part of the broader types of candlestick patterns used in technical analysis.
Bullish Spinning Top
A Bullish Spinning Top forms at the end of a downtrend after sustained selling pressure. This Bullish Spinning Top typically appears green in color because the closing price is higher than the opening price. Although it still signals indecision, buyers had a minor advantage by the end of the session. If the next candle closes above the high of the spinning top, it indicates a potential trend reversal from bearish to bullish.

Bearish Spinning Top Candle
A Bearish Spinning Top forms at the end of an uptrend after strong buying pressure. This Bearish Spinning Top typically appears red colored because the closing price is lower than the opening price. Although it still signals indecision, sellers had a minor advantage by the end of the session. If the next candle closes below the low of the spinning top, it indicates a potential trend reversal from bullish to bearish.

How to Trade with a Spinning Top? [With Example]
There are four major steps for trading spinning top. The steps include identifying the market context, checking the location, waiting for the confirmation, and executing the trade.
- Identify the Market Context: Understand whether the market is trending, range-bound, or reversing. Analyzing market context allows traders to align their trades with the overall market direction.

- Check the Location: Location increases the reliability of the spinning top candle. Such a high-probability location involves support and resistance, previous swing highs or swing lows, proximity to moving averages, and Fibonacci retracement levels (50%/61.8%). Ignore the spinning top forming randomly on the price chart.

- Wait for Confirmation: As the spinning top represents market indecision, wait for the next candle to close for a clear signal. If the next candle closes above the high of the spinning top, it signals bullish momentum, and if the next candle closes below the low of the spinning top, it signals bearish momentum.

- Trade Execution: Enter long or short depending on the close of the confirmation candle and put your stop-loss to the other side of the spinning top (stop-loss below the spinning top’s low for a long trade and above the spinning top’s high for a short trade). Aim for a 1:2 profit target or higher.

Following the above four steps enhances your edge in spotting high-probability reversals while managing risk effectively.
Intraday Trading with Spinning Top
Intraday Trading with spinning tops involves the use of shorter timeframes, such as 5 or 15 minutes. Since lower timeframes have higher volatility, it is important to confirm the setup using volume or another momentum indicator in Intraday Trading. This requires constant trade monitoring and quick stop-loss adjustments.
Positional Trading with Spinning Top
For Swing Trading, the spinning top is more reliable on higher timeframes like daily or weekly charts. In Swing Trading, when they form after an extended trend, they may indicate possible medium-term to long-term reversals or consolidation periods. Powerful confirmation with trend breaks improves the quality of trade.
Forex Trading with Spinning Top
In forex trading, spinning tops often appear during the period of low volatility or before the announcement of major economic news events. This is effective only near key psychological levels. Since the forex market allows use of high leverage, strict risk management and confirmation from momentum indicators are essential.
Do You Need Confirmation After Spinning Top?
Yes, you need to confirm a spinning top candlestick pattern before taking any trading action. A spinning top is a neutral candlestick pattern, which alone signals market indecision, not a directional bias. Without confirmation, it is difficult to know whether the trend will continue or reverse.
How to Confirm a Spinning Top?
There are three important criteria to check when confirming a spinning top. The criteria is mentioned below.
- Next Candle: If the next candle closes above the spinning top candle’s high, it signals a bullish confirmation, and if the next closes below the spinning top candle’s low, it signals a bearish confirmation.
- Volume: High volume on the confirmation candle increases the reliability
- Support and Resistance: Works best when formed near a key support or resistance area, especially on higher time frames.
Confirm it only if the next candle breaks and closes above or below its range, supported by strong volume and a key support or resistance level.
How Reliable is the Spinning Top Candlestick Pattern?
The Spinning Top candlestick pattern is moderately reliable on its own. According to Thomas Bulkowski in his Encyclopedia of Candlestick Patterns, the standalone reliability of a spinning top is below 55%, which ranks it in the lower-middle tier among candlestick patterns.
However, reliability increases when it forms near support or resistance, followed by a strong confirmation candle, or it is supported by a volume or momentum indicator. This confirmation increases the accuracy by more than 56%, making it more effective as a context-based signal rather than a standalone trading trigger.
In Which Market Conditions, Spinning Top Works?
The spinning top works in four major market conditions, such as at the peak of an uptrend, the bottom of a downtrend, near important key levels, and during momentum divergence.
- At the Peak of the Uptrend: A spinning top candlestick is highly effective when it forms after the prolonged uptrend. It indicates losing momentum and exhaustion among buyers. A next candle closing below the low of the spinning top confirms the trend reversal.
- At the Bottom of the Downtrend: A spinning top formed after a prolonged decline indicates fading momentum among sellers. A next candle closing above the high of the spinning top confirms the trend reversal.
- Near Important Key Levels: When the pattern forms at support or resistance levels, previous swing highs/lows, or any other important moving averages, it indicates a real struggle between the demand and supply. At these decision zones, the probability of a meaningful move increases.
- During Momentum Divergence: When a spinning top appears alongside RSI or MACD divergence, it indicates exhaustion. This divergence indicates a loss of momentum and the possibility of a trend change.
Rather than trading every occurrence, trading spinning top in these market conditions helps filter low-quality signals and improves the probability of capturing meaningful market moves.
How to Avoid False Signals with Spinning Top?
There are five major steps to avoid false signals with a spinning top. The steps include trading spinning top at key levels, waiting for confirmation, avoiding trending markets, using volume, and aligning the trade with higher timeframes.
- Trade Only at Key Levels: Avoid trading Spinning Top in the middle of the random price action. The pattern is more reliable when it forms near important key levels, such as support or resistance levels, previous swing highs/lows, or any other important moving averages.
- Wait for Confirmation: Wait for the next candle to confirm the direction of the upcoming trend. For bullish confirmation, the next candle must close above the high of the spinning top and for bearish confirmation, the next candle must close below the low of the spinning top.
- Avoid Strong Momentum Trend: In strong trending momentum, the spinning top often indicates a temporary pause. If the momentum indicator still shows strong momentum, avoid counter trading.
- Use Volume for Validation: Low volume indicates weak participation. Higher volume on the confirmation candle increases reliability and reduces false breakouts.
- Align with Higher Timeframe Trend: Before trading lower timeframes, check the daily or 4H trend. Selling in a direction counter to higher timeframe momentum enhances failure.
When it forms at a key level, gets proper confirmation, aligns with a higher timeframe structure, and is supported by volume, it becomes tradable. When it appears randomly during strong momentum, it is just noise.
What Indicators Work Best with Spinning Top?
Trading Indicators that work best with spinning tops include RSI, Moving Averages, Volume, and Fibonacci. These Trading Indicators help confirm momentum shift, trend strength, and participation.
Relative Strength Index (RSI): If the spinning Top candlestick forms an overbought zone (above 70) or oversold zone (below 30), it indicates trend exhaustion and possible change in trend. The indication of exhaustion further improves with RSI divergence.

Moving Averages: Moving averages help identify the trend and act as a dynamic support and resistance. A spinning top forming on the moving average indicates either a pullback continuation or a possible reversal, depending on confirmation.

Fibonacci Retracement: When a spinning top forms near key Fibonacci levels, such as 38.2%, 50%, or 61.8%, it adds confirmation. These Fibonacci levels act as strong reaction zones where the probability of a shift in momentum is high.

What Timeframe is Best for Spinning Top?
Spinning tops work best on higher time frames, such as daily, weekly, and monthly, as they have less noise and incorporate more data. Lower time frames, such as 5 min, 15 min, or 1 hr, are less reliable due to noise.
| Timeframe | Reliability | Best For |
| Weekly / Monthly | Very High | Long-term trend shifts & positional trading |
| Daily | High | Swing trading & major trend analysis |
| 1-Hour / 4-Hour | Moderate | Intraday trading with strong confirmation |
| Under 15-Minutes | Low | High-frequency noise (generally avoid) |
Is Spinning Top Profitable?
Yes, spinning top is profitable, but not on their own. Since it is a neutral candlestick pattern that reflects market indecision, trading it without confirmation gives no clear edge.
It is profitable only when used with the right market context, such as at major support or resistance levels, after an extended trend, and with a strong confirmation candle. Combining it with momentum indicators like RSI and maintaining proper risk–reward (minimum 1:2) improves its effectiveness.
Benefits vs Limitations of Spinning Top Candlestick Pattern
The benefits vs. limitations of the spinning top candlestick pattern are mentioned below in the table.
| Benefits | Limitations |
| Signals early momentum slowdown | Not a strong standalone reversal signal |
| Helps identify potential exhaustion zones | High probability of false signals without confirmation |
| Works well at key support/resistance levels | Low reliability in strong trending markets |
| Simple and easy to identify | Requires additional indicators for direction |
| Can improve trade timing when combined with confirmation | Often leads to consolidation instead of reversal |
| Useful for spotting trend pauses | Standalone accuracy is relatively low |
The spinning top is best used as an early warning of indecision, not a standalone trading signal. Its real strength comes from proper context, confirmation, and disciplined risk management.
What’s the Difference between Spinning Top & Doji Candle?
The difference between a spinning top and a doji candle is mentioned below in the table.
| Feature | Spinning Top | Doji |
| Real Body | Small body (open & close are close but not equal) | Almost no body (open ≈ close) |
| Shadows | Long upper and lower shadows | Can have long or short shadows depending on type |
| Indecision Level | Moderate indecision | Strong indecision |
| Signal Strength | Weak neutral signal | Stronger neutral signal |
| Meaning | Momentum slowing down | Complete balance between buyers & sellers |
Both of the candles indicate market indecision, but Doji reflects strong market indecision due to its nearly zero body.
Spinning Top vs Hammer vs Hanging Man vs Shooting Star
The difference between a spinning top, hammer, hanging man, and Shooting Star is mentioned below in the table.
| Pattern | Structure | Appears After | Signal Type | Indicates |
| Spinning Top | Small body and long upper & lower shadows | Uptrend or Downtrend | Neutral | Indecision, possible pause or exhaustion |
| Hammer | Small body + long lower shadow + little/no upper shadow | Downtrend | Bullish | Selling exhaustion, potential reversal upward |
| Hanging Man | Small body + long lower shadow + little/no upper shadow | Uptrend | Bearish | Buying weakness, potential reversal downward |
| Shooting Star | Small body + long upper shadow + little/no lower shadow | Uptrend | Bearish | Buying exhaustion, potential reversal downward |
Although these patterns may look similar, such as a Shooting Star and an inverted hammer pattern, their meaning depends on structure and trend location. Always focus on context and confirmation, not just the shape of the Shooting Star itself.
Is Spinning Top Bullish or Bearish?
A spinning top on its own is neither bullish nor bearish; it is a neutral candlestick pattern that reflects market indecision. Whether it is bullish or bearish totally depends on the previous trend and the confirmation candle formed after the spinning top.
A spinning top is considered to be bullish when it forms after a downtrend and the next candle closes above the high of the spinning top, making it part of Bullish Candlestick Patterns. Conversely, a spinning top is considered bearish when it appears after an uptrend and the next candle closes lower than its low, classifying it under Bearish Candlestick Patterns. These setups are widely used within both Bullish Candlestick Patterns and Bearish Candlestick Patterns to identify potential trend reversals.
Is Spinning Top a Reversal Pattern?
No, a spinning top is not inherently a reversal pattern; it’s a neutral pattern that can precede reversals or continuations depending on market context and the next confirmation candle. A table below explains the situation where
| Previous Trend | Confirmation Candle Closes | Outcome | Signal Type | What It Indicates |
| Uptrend | Above the high of the Spinning Top | Bullish continuation | Continuation | Small pause, not exhaustion. Buyers regained control. |
| Downtrend | Below the low of the Spinning Top | Bearish continuation | Continuation | Small pause, not exhaustion. Sellers regained control. |
| Uptrend | Below the low of the Spinning Top | Bearish reversal | Reversal | Buying exhaustion. Sellers taking control. |
| Downtrend | Above the high of the Spinning Top | Bullish reversal | Reversal | Selling exhaustion. Buyers taking control. |


 Previous Article


![15 Investing.com Alternatives [Free+Paid] You Should Use in 2026](https://www.strike.money/wp-content/uploads/2026/04/Investing.com-Alternatives.jpg "15 Investing.com Alternatives [Free+Paid] You Should Use in 2026 44")
![15 TradeStation Alternatives [Free+Paid] You Should Use in 2026](https://www.strike.money/wp-content/uploads/2026/04/TradeStation-Alternatives.jpg "15 TradeStation Alternatives [Free+Paid] You Should Use in 2026 45")
![15 Chartink Alternatives [Free+Paid] You Should Use in 2026](https://www.strike.money/wp-content/uploads/2026/04/Chartlink-Alternatives.jpg "15 Chartink Alternatives [Free+Paid] You Should Use in 2026 46")
: Overview, 10 Types of Indicators, Settings for Different Markets 47")


 : Definition, Formula, calculation, Uses, Advantages Vs limitations 50")


No Comments Yet.