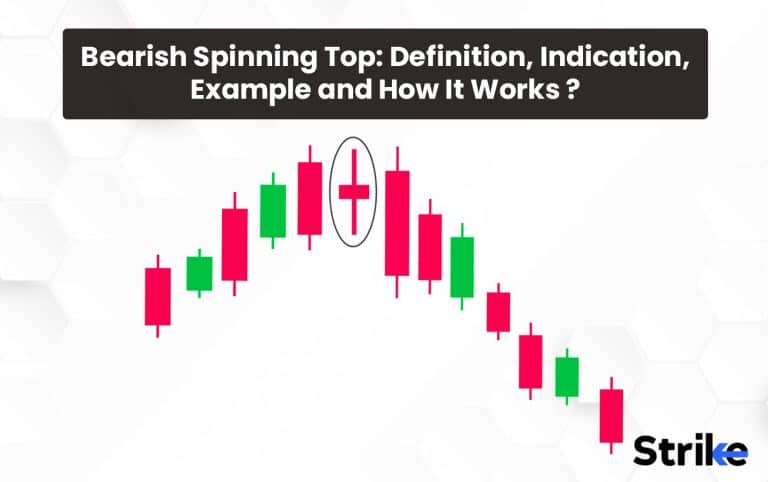
A Bearish Spinning top is a candlestick formation that occurs when buyers and sellers balance each other out. A Bearish spinning top is a single candlestick pattern that represents indecision about the future price movement. A Bearish spinning top candlestick pattern has a short real body with upper and lower shadows longer than the body. A small real body means that the open price and close price are close to each other.
The bearish pattern occurs when the opening price is higher than the closing price. A bearish spinning top is formed when the bearish traders push prices lower than the open price before the market closes.
Bearish Spinning tops indicate a substantial shift in the trend. A Bearish Spinning top indicates that bulls are losing control at the peak of an uptrend, and the bears are taking control. This also indicates that the trend may be about to change to a downtrend. This means that the bulls will take control at the bottom of a downtrend, and they may take the reins. This also signals that bears are losing control.
The opening price is Rs 424, and the closing price is Rs 420. This means that this will lead to the creation of a small real body, as a 4-point move is not much. A short real body means both opening and closing prices are very similar to each other. Here, the opening price is higher than the closing price, and a bearish spinning top occurs.
What is a Bearish Spinning Top?
A Bearish Spinning top is an indecisive candlestick pattern representing the future price movement. A Bearish spinning top explains high volatility and is associated with unpredictable price swings. A Bearish spinning top is formed when the bears send the price higher than the opening price, and the bulls push it back down before the market closes.
The market will explore a downward trend and settle at more or less the same opening price, which will result in prices falling and stocks declining if a bearish spinning top is formed. There are high chances of a potential reversal if a spinning top is formed after a large uptrend, and if the spinning top is seen at the bottom of an uptrend, it could mean that a bearish reversal might happen.
What is the Indication of a Bearish Spinning Top?
Bearish Spinning top candlestick pattern shows uncertainties around an underlying asset. The shadows or wicks will indicate any decisive trend reversal and necessary information for trading strategy. A bearish spinning top is generally colored red. It has a long red body followed by 3 small green bodies followed by another red body. The colors are helpful to identify separately in a candlestick chart. This indicates a falling three-methods bearish pattern.
Bearish Spinning tops are candlesticks with 3 components. The small real body of the candlestick shows the opening and closing prices of the day. A short real body means both opening and closing prices are very similar to each other. The short real body indicates that there was a lot of indecision in the market regarding the direction of the price. The body is formed by horizontal lines in a candlestick pattern. The Upper wick or the Upper shadow represents the highest price. A tall upper shadow means that the bulls tried to push the market higher but did not succeed.
This indicates that the price moves during the period but goes back down. This is viewed as a failed attempt by the bulls to push the markets higher and as a bearish signal. The wick is formed by a vertical line in a candlestick pattern. The lower wick or lower shadow represents the lowest price. The lower shadow indicates that the bears tried to push the market lower but did not succeed. A long red candle indicates that the bears are successful. This is viewed as a failed attempt by the bears to drive the markets down.
Bear factors are futile to make the market move in a single direction, resulting in market indecision. The components of a bearish spinning top will help in indicating that the price will fall likely and the sellers are back in control.
What is an Example of Bearish Spinning Top?
An example of a bearish spinning top pattern in the stock market is given below.

The trading day opens with the share price at Rs 442. Buyers enter the market, and the share price starts moving, hitting a high of Rs 450. Sellers start to push back, and the share price reaches a low of Rs 435 before the market settles and the share price closes at Rs 440. This creates a bearish spinning top candlestick.
A bearish spinning top is colored red in a candlestick chart. The bears sent the price sharply lower, but in the end, the price closed near where it opened. This is a sign of indecision in the asset. A bearish reversal signals that the spinning top occurs at the top of the uptrend. This means that the bulls are losing control, and bears may take the reins.
What does Bearish Mean?
Bearish means that the market, asset, or financial instrument is going to experience a downward fall. The market price usually drops when the bearish pressure in a market is stronger than the bullish market. A market that is experiencing a constant decline in price is referred to as a bear market. A bear market is generally declared when the stock of a company or the price of an investment falls at least 20% from its high.
A bear market or bearish is a situation when the stock market experiences price declines over a period of time. It is recognized by falling stock market indices and recession. The usual causes of a bear market are unexpected fluctuations, world recession, etc.
What is the History of the Bearish Term in Stocks?
The beginning of the bear in the share market was marked on October 24, 1929. The stock market crash of 1929 first marked the onset of depression because of the massive sales volume of approximately 12.9 million shares. This was recorded on October 24, 1929, which came to be known as Black Thursday.
The great depression of 1929 was reported as the most prolonged depression of the modern world. The great depression was triggered by a bearish market trend and was persistent for about 10 years. The years prior to 1929 saw an immense speculation drive. Many individuals purchased overinflated assets at prices higher than their absolute value. Such a rise caused companies to resort to excess production, leading to excess supply in the market. This caused the average price level to fall significantly, causing deflation, the effects of which penetrated the stock market as well.
Another important event in the history of bearish terms in the stock market is the 2008 recession. A global financial slowdown was witnessed after the subprime mortgage crisis in America. This was followed by the collapse of Lehman Brothers Holdings Inc., which is one of the biggest financial institutions in the world. India also felt the effects of this economic slowdown owing to globalization. India witnessed a fall in Sensex points by 1408 points on January 31, 2008. Indian investors undertook a bearish investment pattern when the world faced the brunt of this recession. They preferred withholding their money and depositing the same in risk-free tools. Cyclical movements in the business cycle are known to cause a recession in an economy, and this is characterized by a downtrend in the overall price level. This includes a fall in the average stock prices resulting from reduced demand, which, in turn, lowers the value of benchmark indices in a country.
The first sign of an upcoming recession is a significant value drop in major indices associated with the foremost stock exchanges of a country. For example, in the event of a recession, the first warning sign is a massive fall in the Sensex and Nifty points associated with the Bombay and National Stock Exchange. There have been a total of 28 bear markets since 1929. The average decline was 35.62%, and the average length of time was 289 days. An important factor in the history of bears in the stock market is that not every bear market leads to a recession. The first bear market was from September 7,1929 to November 13, 1929. The most recent one was from February 2020 to March 2020. This is a short bear market that lasted only 33 days but saw a drop in the market of nearly 34%. The COVID pandemic wreaked havoc on the economy, with an economic contraction of 31.4% in the second quarter. This was the second quarter it fell, dropping 5% in quarter one, and unemployment jumped to 14.7%. There were a total of 9 bears from September 7 to March 2020. The most recent event was in 2022, with concerns over an inflation surge and potential rises of the federal funds rate, which caused a bear market.
What are other types of Bearish Patterns?
The Bearish Reversal candlestick patterns are single or multiple candlestick patterns. Bearish Reversal candlestick patterns indicate that the ongoing trend is going to reverse to a downtrend. It is important to the traders that they are cautious about their long positions when the bearish reversal candlestick patterns are formed.
There are 12 Bearish candlestick patterns.
1.Hanging Man: Hanging Man is a single candlestick pattern that is formed at the end of an uptrend and signals a bearish reversal. Hanging Man indicates weakness in the ongoing price movement and shows that the bulls have pushed the prices up, but they are not able to push further. The hanging man is the bearish equivalent of a hammer, and it has the same shape.
The real body of this candle is small and is located at the top with a lower shadow, which should be more than twice the real body. This candlestick pattern has no or little upper shadow. The psychology behind this candle formation is that the prices opened, and sellers pushed down the prices. It indicates that there was a significant sell-off during the day, and the buyers were able to push the price up again.
The large sell-off is often seen as an indication that the bulls are losing control of the market, and they are unsuccessful as the prices close below the opening price. This resulted in the formation of bearish patterns and signifies that sellers are back in the market, and the uptrend may end. Traders can enter a short position if, the next day, a bearish candle is formed and can place a stop-loss at the high of Hanging Man.
2. Dark Cloud Cover: Dark Cloud Cover is a multiple candlestick pattern that is formed after the uptrend, indicating a bearish reversal. Dark Cloud cover also indicates weakness in the uptrend. Dark Cloud cover is also said to be a black cloud over the previous day’s optimism.
It is formed by two candles. The first candle is a bullish candle, which indicates the continuation of the uptrend. The second candle is a bearish candle, which opens the gap up but closes more than 50% of the real body of the previous candle. This shows that the bears are back in the market, and a bearish reversal is going to take place. This is represented as a red candlestick that opens above the previous green body and closes below its midpoint. The bears take over by pushing the prices sharply lower. The downtrend is considered extremely decisive if the wicks of the candles are short. Traders can enter a short position the next day if a bearish candle is formed and can place a stop-loss at the high of the second candle.
3. Bearish Engulfing: Bearish Engulfing is a multiple candlestick pattern that is formed after an uptrend, signaling a bearish reversal. Bearish Engulfing indicates a fall in the prices due to the selling pressure that is exerted by the sellers. This is done at the top of an uptrend.
It is formed by two candles, the second candlestick engulfing the first candlestick. The first candle is a bullish candle, which indicates the continuation of the uptrend. The second candlestick chart is a long bearish candle that completely engulfs the first candle and shows that the bears are back in the market. The first candle is represented as a small green body that is engulfed by a subsequent long red candle. This signifies a peak or slowdown of price movement and is a sign of an impending market downturn. The trend is likely to be more significant depending on how low the second candle can go. Traders can enter a short position the next day if a bearish candle is formed and can place a stop-loss at the high of the second candle.
4. The Evening Star: The Evening Star is a multiple candlestick pattern that is formed after the uptrend, signaling a bearish reversal. The Evening Star is used by traders to analyze when the uptrend is going to reverse a downtrend. The Evening Star is equivalent to the bullish Morning Star.
It is made of 3 candlesticks. The first is a bullish candle, the second a doji, and the third is a bearish candle. Doji is a bearish reversal candlestick pattern that is formed when the open, low, and closing prices are all near each other with a long upper shadow. The first candle shows the continuation of the uptrend. The second candle, being a doji, indicates indecision in the market. The third bearish candle shows that the bears are back in the market, and a reversal is going to take place.
The second candle should be completely out of the real bodies of the first and third candles. It is represented as a short candle sandwiched between a long green candle and a large red candlestick. It indicates the reversal of an uptrend and is particularly strong when the third candlestick erases the gains of the first candle. Traders can enter a long position the next day if a bearish candle is formed and can place a stop-loss at the high of the second candle.
5. Three Black Crows: The Three Black Crows is a multiple candlestick pattern that is formed after an uptrend signaling bearish reversal. Three Black Crows are used for predicting the reversal of the downtrend from the uptrend. Three Black Crows are formed when the sellers exert bearish forces and make the prices fall for three consecutive days.
The candlesticks are made of three long, bearish bodies that do not have long shadows and open within the real body of the previous candle in the pattern. The three black crows candlestick pattern comprises three consecutive long red candles with short or non-existent wicks. Each session opens at a similar price to the previous day, but the selling pressure pushes the price lower and lower with each close movement.
Traders interpret this pattern as the start of a bearish downtrend because the sellers have overtaken the buyers during three successive trading days.
6. Black Marubozu: The Black Marubozu is a single candlestick pattern that is formed after an uptrend, indicating a bearish reversal. This candlestick chart has a long bearish body with no upper or lower shadows, which shows that the bears are exerting selling pressure, and the markets may turn bearish. At the formation of this candle, the buyers should be cautious and close their buying position.
7. Bearish Harami: The Bearish Harami is a multiple candlestick pattern that is formed after the uptrend indicating bearish reversal. Bearish Harami consists of two candlesticks. The first candlestick is a tall, bullish candle, and the second is a small, bearish candle, which should be in the range of the first candlestick chart. The first bullish candle shows the continuation of the bullish trend, and the second candle shows that the bears are back in the market.
8. Three Inside Down: The Three Inside Down is a multiple candlestick pattern that is formed after an uptrend, indicating a bearish reversal. It consists of three candlesticks. The first is a long, bullish candle. The second candlestick is a small bearish candle, which should be in the range of the first candlestick. The third candlestick chart should be a long bearish candlestick confirming the bearish reversal. The relationship of the first and second candlestick should be of the Bearish Harami candlestick pattern. Traders can take a short position after the completion of this candlestick pattern.
9. Shooting Star: The Shooting Star is a candlestick pattern that is formed at the end of the uptrend and gives a bearish reversal signal. The shooting star is the same shape as the inverted hammer, but it is formed in an uptrend.
The candlestick chart for shooting stars is formed in a way where the real body is located at the end, and there is a long upper shadow. It is the inverse of the Hanging Man Candlestick pattern. This pattern is formed when the opening and closing prices are near to each other, and the upper shadow should be more than twice the real body. The Shooting Star has a smaller lower body and a longer upper wick. Usually, there will be a slightly higher market gap on opening and rally to an intra-day high before closing at a price just above the open, which is like a star falling to the ground.
10. Tweezer Top: The Tweezer Top pattern is a bearish reversal candlestick pattern that is formed at the end of an uptrend. The tweezer top pattern consists of two candlesticks. The first one is a bullish candlestick, and the second one is a bearish candlestick. The bullish and bearish tweezer candlestick make almost or the same high. The prior trend is considered an uptrend when the tweezer top candlestick pattern is formed.
A bullish candlestick is formed, and it looks like the continuation of the ongoing uptrend. The second day’s bearish candle’s high indicates a resistance level on the next day. Bulls seem to raise the price upward, but now they are not willing to buy at higher prices. The top-most candles with almost the same height indicate the strength of the resistance and also signal that the uptrend may get reversed to form a downtrend. This bearish reversal is confirmed on the next day when the bearish candle is formed.
11. Three Outside Down: The Three Outside Down is a multiple candlestick pattern that is formed after an uptrend, indicating a bearish reversal. Three outside down candlestick patterns consist of three candlesticks. The first is a short bullish candle, and the second candlestick is a large bearish candle, which should cover the first candlestick. The third candlestick should be a long bearish candlestick confirming the bearish reversal. The relationship of the first and second candlestick should be of the Bearish Engulfing candlestick pattern. Traders can take a short position after the completion of this candlestick pattern.
12. Bearish Counterattack: The bearish counterattack candlestick pattern is a bearish reversal pattern that appears during an uptrend in the market. The Bearish counterattack predicts that the current uptrend in the market will make the market, and the new downtrend will take over the market.
These are the different types of candlestick patterns. An important note is that Bearish reversal patterns should form at the uptrend; otherwise, it will act just like a continuation pattern. It is also important to confirm the reversal signals given by bearish reversal patterns with other indicators like volume and resistance.
What are the Best Bearish Indicators?
Bearish indicators are the tools that give an insight into the future stock price movement. The intensity of these stock price movements is based on mathematical calculations of historical prices. There are 3 best bearish indicators:
1.Simple Moving Averages: A Simple Moving Average is a very effective tool for identifying long-term trends. Simple Moving Average (SMA) is the arithmetic mean of the set of prices over days in the past. This duration is completely customized and compared with different time frames.
The working of this depends on the prices which are trending above the moving averages. This generates a bullish signal, and when the price goes below the moving averages, it generates a selling signal. In the long run, the prices are always trending near the moving averages.
A bearish crossover, which is also known as the death cross, is signalized when the defined short-term moving average crosses the long-term moving average from above. A Simple Moving Average (SMA) is the best among the other technical indicators in the bearish market due to its simplicity.
2. Exponential Moving Average: Exponential Moving Average is another common technical indicator in the bearish market. The exponential Moving Average is used for generating bullish and bearish signals. The Exponential Moving Average (EMA) is considered to be better than the Simple moving average (SMA). EMA applies more weight to the recent price, which reduces the lag and is more responsive than SMA. EMA is also a price-sensitive indicator in the trending markets and will generate multiple signals in a short duration.
EMA is calculated as:
EMA (current)= ((Price (current) – EMA (Previous)) × K (Multiplier) + EMA (Previous)
An exponential moving average is combined with various other indicators like MACD, RSI, trend, etc, to confirm the trend before taking any position. 12 and 26 exponential moving averages are the most commonly used parameters for the EMA.
A bearish signal is generated if the prices that are trending go below the EMA. A bearish EMA crossover is signaled when the defined short-term exponential moving average crosses the long-term exponential moving average.
3. Relative Strength Indicator: Relative Strength Indicator or RSI is an oscillator that shows the rate of the change or momentum of stock price. RSI is usually coupled with other indicators and price trends.
RSI movement is calculated based on the price changes over the last period (usually 14 days) divided by the number of periods to attain the average. This movement consists of the overbuying and overselling of the stock. RSI follows the prices and oscillates between 0 to 100 levels. Conventionally, the trader uses 30% for an oversold level and 70% for an overbought level. A bearish signal is generated when the RSI line moves from above to below the overbought line. RSI is most effective in the ranging or sideways market and also confirms the reversal of the trends.
4. Moving Average Convergence and Divergences: Moving Average Convergence and Divergences have the elements of multiple indicators as they show the price momentum and trend reversal usage in both the short and long term. This makes it one of the most used indicators, which is essential for confirming the trend movements.
The Moving Average Convergence and Divergences comprises of 3 lines:
- MACD or Fast line: Fast line is calculated by subtracting the 26 periods EMA (Exponential moving average) from 12 periods EMA.
- Signal or slow line: Slow line is calculated taking 9 days EMA of the MACD or Fast line.
- Centerline or zero line: A Zero line is a straight line. MACD and the signal line move around these zero lines.
The standard settings for MACD are 12 and 26-period EMA and are customized. MACD is applied to daily, monthly, and weekly charts. Moving Average Crossovers are also known as MACD crossovers, and they occur when the MACD (Fast) line crosses the signal (Slow) line. A bearish signal is generated when the MACD line crosses the signal line from above.
The center line crossover occurs when the MACD (Fast) line crosses the zero (center line). A bearish signal is generated when the MACD line crosses the zero (center line) from above. The center line crossover generates the most accurate signal, especially in the long term.
5. Super Trend: Super Trend is very effective in identifying trend changes. Super Trend is most accurate with trending markets and not very precise with sideways or ranging markets. Therefore, Super Trend should be used accordingly. The super trend is a trend-following indicator, and it is constructed with two parameters: period (Average true range number of days) and multiplier (value by which the ATR is multiplied) with the default values of 10 and 3, respectively. It is popularly used on equities, futures, or forex and is plotted on daily, weekly, and hourly charts.
The Super trend indicator is very effective in trending markets and is easily identified. The Buy signal is generated when the Super trend closes below the price, and its color changes to green, and the sell signal is generated when the Super trend closes above the price and its color changes to red.
These were the best technical indicators in the bearish market to counter any bearish movement. These indicators will alert the investor or trader in advance of the upcoming trend and also confirm the trend reversal or changes in the ongoing trend.
What are the Types of Spinning Tops for Candlesticks?
A spinning top candlestick is formed when the bulls send the price higher than the opening price, and the bears then push it back down before the market closes or when bearish traders push prices lower than the opening price and bullish traders push it back up before the market closes. The spinning tops occur mainly in 2 types. They are

1. Spinning tops in a downtrend: Spinning tops in a downtrend means that the bears may be losing momentum, and a bullish reversal may occur. In a downtrend, the bears are in absolute control as they manage to lower the prices. The bears can consolidate their position before continuing with another cycle of selling with the spinning top in the downtrend. The bulls have also attempted to control the price fall and have tried to hold on to their position, but they are not successful. The day would result in a good blue candle and not really a spinning top if they were successful. There are two scenarios with equal probability in a downtrend. There could be another round of selling, or the markets could reverse their direction, and the price could increase.

2. Spinning tops in an uptrend: Spinning tops in an uptrend means that the bulls may be losing momentum, and a bearish reversal may occur. In the uptrend, bulls are no longer in control, and the bears make an entry to the market.
The spinning top basically conveys indecision in the market, and neither the bulls nor bears can influence the market.
How does the Bearish Spinning Top work?
A bearish spinning top forms when the bears push the price back down before the market closes. The bearish trend is characterized by heavy selling pressure exerted by the bears. It is identified as a bearish trend when there is a fall in the prices of about 20%. The prices are making lower lows and lower highs, and then the trend is termed the Downtrend. The prices start moving down and form a downtrend when the psychological and fundamental factors degrade. It is termed a Bear market when the stock market is on a downtrend. Traders should sell dips during this ongoing downturn. A bearish market means that the price is going down and falling. There is negative momentum. Markets can stay bearish for months or years, and just like the case with bull markets, a few days of falling prices isn’t usually enough for a market to be called bearish.
How do you use Bearish Spinning Top in Trading?
A bearish Trend in the financial markets is defined as a downward trend if there is a fall in the industry’s stocks or there is an overall fall in the market indices. Technical indicators are technical tools that help in analyzing the ongoing trend and whether the current trend is going to reverse or not. Indicators help in providing us with trend trade or reversal signals. Traders should use a combination of technical indicators to confirm the signals given by these technical indicators. The traders should identify that the bearish reversal patterns form at the end of an uptrend and confirm the reversal signals given by bearish reversal patterns with other indicators such as high trading volume.
The best way to use the bearish spinning top in technical analysis is to consider it as a sign of ambiguity and wait for the market to get onto a trade. The traders can adopt a riskier strategy during this time or sell the securities. The trader can also wait for the next candlestick pattern to form after the bearish spinning top and make a plan of action. The prices will mostly remain around the same range, and the trader can wait it out if a bearish candlestick is formed near the support price of a security. Another scenario that occurs is a bearish candle forming nearing the resistance level of security. The traders can take a short position in this scenario and sell the stocks at a higher price before buying them at a lower price after the price has fallen.
What Errors Do Traders Frequently Make When Trading the Bearish Spinning Top Pattern?
The possible error made by traders in a Bearish Spinning Top pattern is that most traders forget the long-term course of the plan and start selling their securities when the price goes down in the bear market. Another error is calculating that a bearish spinning top will mean that there are chances of a bearish reversal in a market. The tools used for technical analysis of a stock are not 100% accurate, so it is important to use them carefully as they indicate overall indecisiveness in markets. Aggressive traders can also make a move and bet on trend reversals without analyzing if it is a bearish or bullish spinning top.
How to Avoid Frequent Errors when Trading Bearish Spinning Top Patterns?
The best way to avoid frequent errors is by having a risk management plan, especially while using the tools for technical analysis of a stock. Candlestick patterns also indicate overall indecisiveness in markets, so conservative traders can choose to stay away as there is no definite trend. Aggressive traders should also only make a move and bet on trend reversal by analyzing whether it is a bearish or bullish spinning top.
What are the Limitations of The Bearish Spinning Top Pattern?
The limitations of the Bearish Spinning Top Pattern are that these are quite common patterns as they always form when the price of a security is witnessing a sideways movement. It becomes difficult to assess whether these patterns do indicate certain trend reversals. Confirmation from other technical tools is necessary while forecasting future action plans, as this is quite a common pattern and may not mean something consequential. The risk-reward potential of placing stop loss targets just above or below the high or low of a spinning top is also quite low. It means you may be dealing with a higher risk in comparison to the expected reward.
How Can I Identify A Bearish Spinning Top Pattern?
Bearish spinning top patterns are identified while looking at a candlestick chart, as they usually come at the end of prevailing uptrends. Bearish Spinning top patterns are characterized by candles that have small real bodies and long wicks. The long wicks will be the main distinguishing feature that separates them from doji patterns. Bearish Spinning top patterns will also have a wick that is longer than the body of the candle. A bearish spinning top is generally colored red on a candlestick chart. It has a long red body, followed by small green bodies, and then another red body. The closing prices are also slightly lower than the opening prices.
What happens after a Bearish Spinning Top Pattern?
The next phase after a bearish spinning top pattern will be an uptrend, downtrend, or sideways trend. A bearish spinning top pattern or a bear market is generally termed a downtrend. This downtrend phase can also continue, and it can produce false signals. The trend is termed as an Uptrend when the prices are making higher highs and higher lows. As the psychological and fundamental factors improve, the prices start moving up and form an upward trend. The horizontal price movement happens when the supply and demand are almost equal. Then, the trend is termed a Sideways trend. This trend may last for a few weeks or a few years.
Is the Bearish term only used for Candlestick Chart?
No, the Bearish term is generally used in the stock market by traders, often in conjunction with analyzing Candlestick Charts. Bearish in trading means you believe that a market, asset, or financial instrument is going to experience a downward trajectory. This belief is often supported by patterns observed in Candlestick Charts.
Is White Spinning Top a Type Bullish Pattern?
Yes, the spinning top represents a bullish sentiment whenever these patterns at the support level are white or black. But the pattern represents bearish tendencies or sentiments whenever these candlesticks at resistance levels are black or white.
Does Bearish mean uptrend?
No, Bearish Trend in financial markets is defined as a downward trend in the prices of an industry’s stocks or the overall fall in broad market indices. The bearish trend is characterized by heavy investor pessimism about the declining market prices scenario. A fall in the prices of about 20% is identified as a bearish trend.
What is the difference between a Bearish Spinning Top and a Bullish Spinning Top?
Bearish spinning top patterns indicate that the ongoing uptrend is going to end and may reverse to a downtrend, and bullish spinning top patterns indicate that the ongoing downtrend is going to end and may reverse to an uptrend. The bullish trend increases the price further, while the bearish trend lowers the price until the overall price closes where it opened. The bullish spinning top is represented as green, and the bearish spinning top is represented as red. The bullish formation occurs when the closing price is higher than the opening price, while the bearish pattern occurs when the opening price is higher than the closing price. These are the major differences between Bearish Spinning Top and Bullish Spinning Top.


 Previous Article


![15 Investing.com Alternatives [Free+Paid] You Should Use in 2026](https://www.strike.money/wp-content/uploads/2026/04/Investing.com-Alternatives.jpg "15 Investing.com Alternatives [Free+Paid] You Should Use in 2026 40")
![15 TradeStation Alternatives [Free+Paid] You Should Use in 2026](https://www.strike.money/wp-content/uploads/2026/04/TradeStation-Alternatives.jpg "15 TradeStation Alternatives [Free+Paid] You Should Use in 2026 41")
![15 Chartink Alternatives [Free+Paid] You Should Use in 2026](https://www.strike.money/wp-content/uploads/2026/04/Chartlink-Alternatives.jpg "15 Chartink Alternatives [Free+Paid] You Should Use in 2026 42")
: Overview, 10 Types of Indicators, Settings for Different Markets 43")


 : Definition, Formula, calculation, Uses, Advantages Vs limitations 46")


No Comments Yet.