A Tweezer Bottom is a bullish reversal pattern composed of two Japanese candlesticks with matching bottoms that appears at the bottom of downtrends. Tweezer bottom’s matching bottoms are generally composed of shadows but also be the candle’s body.
A Tweezer Bottom appears during a downtrend when sellers push the prices lower, frequently ending the session near the lows but unable to push the bottom any further. Tweezer Bottoms are generally short-term bullish reversal patterns that indicate a market bottom.
The tweezer bottom formation in the charts indicates that a reversal will occur. The pattern implies that the selling pressure has decreased, and the buyers are beginning to enter the market. Traders take this as an opportunity to buy stocks at a low price and benefit from a coming uptrend.
What Is Tweezer Bottom Double Candlestick Pattern?
The tweezer bottom double candlestick pattern is a bullish reversal pattern seen at the bottom of a downtrend. It comprises two candles; the first corresponds to the bearish trend, while the second candle shows more bullish market sentiment as the price surges higher. The trader’s attitude changes, and they start to buy as this pattern forms close to the support level.
A tweezer bottom is a pattern formed during an evolved bearish trend. The pattern has a low point signifying that bulls will not allow the prices to reduce further.
A bullish candlestick forms due to this market sentiment, signaling that bulls have taken control of the prices.
Tweezer bottom candlestick patterns appear after a downtrend when the lows of two candles are nearly identical. It is made by the lower shadows (or wicks) of the two candles since they represent the low price, but the candle body also forms it in the case of the candle without a wick and whose low price is the same as either the open price or the close price.
What Does Tweezer Bottom Pattern Indicate?
The Tweezer Bottom pattern indicates that the selling pressure has been exhausted, and buyers are stepping in. The pattern is considered more reliable when it forms after a prolonged downtrend with high trading volume. Traders often use this pattern to enter long positions, with a stop-loss order placed below the low of the pattern.
What Is the Importance of The Tweezer Bottom Pattern for Stock Market Technical Analysis?
The importance of this pattern in technical analysis is that it provides traders with a clear signal to enter a long position. Traders can place a stop-loss order below the low of the pattern to limit their risk. This pattern is also useful for identifying potential support levels in the market.
This pattern is used to identify a bullish reversal in a downtrend. It is formed when two candlesticks with the same low are located next to each other. It indicates that selling pressure has been exhausted and buyers are stepping in. This pattern is more reliable after a prolonged downtrend with high trading volume.
What restrictions should traders be aware of while using the Tweezer Bottom pattern?
The restrictions traders should be aware of while using the tweezer bottom pattern are that they are valid only during an uptrend or a downtrend. Their emergence during choppy trading conditions is useless and indicates that the market is unsure whether to move upward or downward.
Relying solely on the appearance of two candles to signal a trend change is risky. The addition of increased volatility demonstrates a highly likely price reversal. The tweezer bottom pattern might be less effective if it develops against a significant trend. The pattern persists despite market turbulence and unpredictability.
What Is the Example of a Tweezer Bottom Pattern?
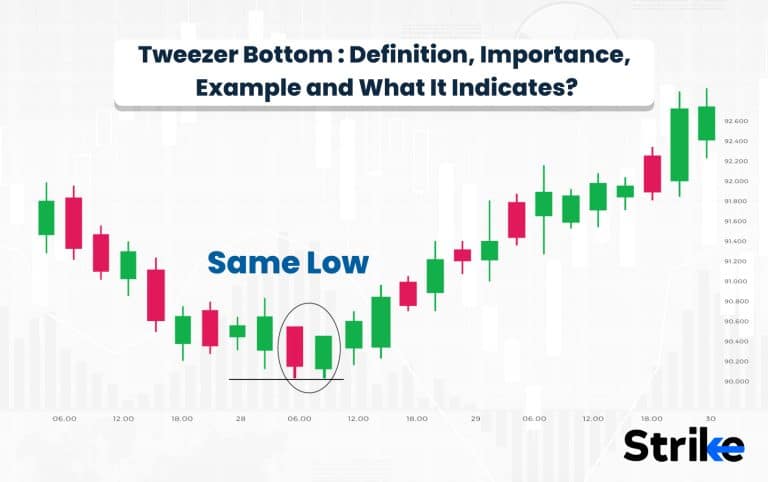
The following chart shows an example of a tweezer bottom candlesticks pattern and the uptrend that followed immediately after:
The tweezer bottom candle formation in the above chart shows that the two candles had the same low values. Reversed the downtrend that had been present before the first red candle and resulted in the upward movement denoted by the long green arrow. A range breakout with a considerable value also raised the likelihood of a possible price reversal.
How to Identify a Tweezer Bottom Pattern?
Look for its unique feature: they have two equal-sized legs to identify a tweezer bottom pattern,. Tweezer bottom candles have equal values of low prices on two candles.
The pattern is recognised by two candles that might be close together or separated by a few smaller candles. These two candles have equally low values near the bottom of the market, representing the tweezer tool, hence the name tweezer bottom.

Here is the explanation of how to identify a tweezer bottom pattern converted into paragraphs:
A tweezer bottom is identified by looking for two candlesticks with specific characteristics.
The two candles should be adjacent to each other, with no or very small gaps between them. The first candle is a down candle that continues the existing downtrend. It has a long bearish body showing the market closed significantly lower than the open.
The second candle is a bullish candle that makes a sharp reversal back higher. It has a long bullish body showing the market closed considerably above the open. Critically, both candles have matching or nearly identical lows. The bottoms of the candlesticks “tweeze” together at the same support level. This is what gives the pattern its name.
Often, the second bullish candle will open below the close of the first candle, and then reverse direction intraday to close near its high. This shows strong buying support kicked in. Volume confirmation on the bullish second candle provides stronger signal.
How Do You Trade Tweezer Bottom Patterns?
The most important part of trading with Tweezer bottom pattern is identification of the same. Below steps explain how you can trade with the pattern.
Identify the pattern: Make sure that there is a downtrend. There should be a rounding off where the price starts to settle and starts trading within a range without the risk of sliding down at the end of the downtrend. This indicates that buyers are trying to support the price and gain control.
Look for the pattern: Find two small-bodied candlesticks with similar lows to determine the tweezer bottom.
The bodies must be roughly the same length, but it doesn’t have to be exactly the same price.
Prepare for an entry: Set up a trade entry once a possible pattern is spotted. You either manually enter the trade or create a pending order to accomplish this.
The goal is to trade with the buyers’ momentum after raising the price above the tweezer pattern. It gives you a confirmation signal while protecting against a false-positive action.
Place your profit targets and stop-loss levels based on your analysis of reward-risk management.
Execute The Trade: The pending order placed earlier will go into effect once the market trades at the desired level. You should use a trailing stop loss and raise your take profit level if the market makes a sharp turn.
How Does the Tweezer Bottom Pattern Form?
The tweezer bottom pattern is formed in the price chart when two nearby candles, or candles with three to four little candles between them, have the same or almost the same low price value. The first candle could be of any size and color.
The Four-Price Doji Candle, which has its open, high, low, and close values equal, is the only exception. Additionally, the first candle must be a component of a downward price movement.
A second candle with a low price similar to the previous one appears after such a red bearish candle forms, and then we have a tweezer bottom pattern. There could be a few small-sized candles in between these two candles, having similar low prices.
The size and color of these two candles are unimportant; their pricing should be identical or close to one another. The initial candle of a reliable tweezer bottom pattern must appear during an ongoing downward price movement.
Is the Tweezer Bottom pattern better for short-term trading or long-term investing?
The Tweezer Bottom pattern is generally more suitable for short-term trading rather than long-term investing. This is because the Tweezer Bottom pattern is a reversal pattern that typically indicates a bullish trend reversal in the short-term.
Long-term investors are more concerned with the overall fundamentals of a company and its growth potential, rather than short-term price movements. But the Tweezer Bottom pattern can still be used as a tool for long-term investors in identifying potential entry points for a stock that has strong fundamentals and growth potential.
When Should I Begin Trading for Tweezer Patterns?
Begin trading for tweezer patterns when there is a significant change in momentum between the first candle and the second candle. These patterns are most useful for trading when they signify the conclusion of a pullback and a trade in the direction of the trend as a whole.
A stop-loss is positioned both above and below a pair of tweezers. Use the candles that appear after the pattern to verify signals for short-term reversals.
Is the tweezer Pattern a Sign of An Upcoming Reversal?
Yes, the tweezer pattern is a sign of an upcoming trend reversal. Tweezer bottom candlesticks show a bullish reversal, whereas Tweezer top candlesticks show a bearish reversal. The emergence of tweezer candlestick patterns on the charts should alert traders that a reversal is about to occur.
Is Tweezer Bottom Bullish?
Yes, the tweezer bottom is a bullish trend reversal pattern that appears at the bottom of the downtrend. The first candle is a powerful, bearish candle, indicating that the downside movement will continue. The second candle, however, prints a new short-term bottom before rising higher to nearly reverse all of the losses from the previous session.
Are There Other Tweezer Patterns?
Yes, there is a tweezer topping pattern, other than a tweezer bottom pattern, . The tweezer topping pattern is a bearish reversal pattern. A bullish candle forms the first candle, while a bearish candle forms the second candle. Each candle should have identical upper shadows or highs at the same level. It is formed at the end of an uptrend where the prices make higher highs.
What mistakes do traders make while trading the Tweezer Bottom and Bearish Harami patterns?
The common mistake traders make while using tweezer bottom and bearish harami patterns is misinterpreting the pattern. The traders read isolated bullish candlestick patterns. You shouldn’t immediately place a deal just because you notice a pattern that resembles a hammer or piercing line. The context is as important as the pattern.
Another mistake traders make is to depend entirely on the bullish pattern. These patterns should be used as a part of a bigger, more encompassing trading strategy, even though they could undoubtedly point to a potential price increase. This entails considering additional technical analysis tools and closely monitoring the general market trend.


 Previous Article


![15 Investing.com Alternatives [Free+Paid] You Should Use in 2026](https://www.strike.money/wp-content/uploads/2026/04/Investing.com-Alternatives.jpg "15 Investing.com Alternatives [Free+Paid] You Should Use in 2026 10")
![15 TradeStation Alternatives [Free+Paid] You Should Use in 2026](https://www.strike.money/wp-content/uploads/2026/04/TradeStation-Alternatives.jpg "15 TradeStation Alternatives [Free+Paid] You Should Use in 2026 11")
![15 Chartink Alternatives [Free+Paid] You Should Use in 2026](https://www.strike.money/wp-content/uploads/2026/04/Chartlink-Alternatives.jpg "15 Chartink Alternatives [Free+Paid] You Should Use in 2026 12")
: Overview, 10 Types of Indicators, Settings for Different Markets 14")

 : Definition, Formula, calculation, Uses, Advantages Vs limitations 16")


: How We Used This 70/30 Indicator in 6 High Win-rate Strategies 20")


No Comments Yet.