Gaps are hollow spaces created in stock market price charts due to a sudden and unexpected rise or drop in price from the previous day’s price. Gaps create a visible emptiness in a price chart as the price rises significantly and there is no data to display between the previous day’s close and today’s open.
Gaps happen both in bearish and bullish contexts. Bullish gaps happen when today’s opening price is significantly higher than the previous day’s close. A bearish gap happens when today’s price is significantly lower than the previous day’s close.
What is a Gap?
A stock gap is a price range in which no trade has taken place. Gap is a price gap on a chart that arises when the price of a stock moves sharply up or down with no trade in between. Gaps are classified into two types: up gaps and down gaps. An up gap is generated when the current day’s low price is greater than the previous day’s high price.
Down gaps occur when the current day’s high price is lower than the prior day’s low price. Significant news events, such as a corporation reporting better-than-expected earnings or a dramatic shift in market sentiment, frequently produce gaps. The benefit of gaps is that they might provide useful information about the market’s or a specific stock’s future direction.
How do Gaps happen in Stocks?
Gaps in stock prices arise when there is a sudden movement in the market that causes a stock’s price to swing dramatically up or down with no trading in between. A gap is represented in the image below.
Gaps can occur due to news events, results release or changes in market sentiment. A company’s profits may be better than expected, generating a rise in demand for its stock and resulting in an up gap. Negative news such as a significant lawsuit or scandal creates a fast decline in demand and results in a down gap. The context in which gaps arise determines whether they are good or detrimental.
Gaps can provide useful information regarding the future direction of a company or the market as a whole in some situations. An upward gap may signal that a stock is gaining momentum and is likely to rise more, but a downward gap may indicate that the stock is losing momentum and is likely to fall further. Gaps may also be an indication of instability and uncertainty, which can be harmful to investors.
Stocks rarely have gaps. But they can be huge when it appears. The frequency of gaps is determined by market volatility, the number of news events affecting the stock, and the overall health of the economy. Investors should be aware of gaps and how they may affect their investments, and they should exercise caution while trading in volatile markets.
Investors should be aware of gaps and how they can impact their investments, and use caution when trading in volatile markets.
What are the different Types of Gaps?
1. Exhaustion Gaps
Exhaustion gaps are a type of gap in stocks that happens when the price of a stock suddenly spikes in the opposite direction of the prevailing trend. A stock could be in an uptrend and could open significantly lower in the next day in exhaustion gaps. These gaps are frequently generated by a market trend that has been pushed too far, too quickly and is losing strength. Investors who were previously optimistic about the company begin to liquidate their holdings, leading the price to plummet precipitously. Below is a pictorial representation of the same.
Exhaustion gaps can signal to investors that the trend is coming to an end and that it is time to consider selling their positions. This is because exhaustion gaps are generally followed by a period of consolidation or a trend reversal, which can result in big losses for unprepared investors. Look for a gap in the chart that is accompanied by significant trading volume and is followed by a period of consolidation or a trend reversal to spot an exhaustion gap. Seeing and comprehending depletion gaps allows investors to make more educated decisions about when to acquire and sell positions, lowering their risk of big losses in unpredictable markets.
2. Breakaway Gaps
Breakaway gaps occur when the price of a stock breaks through a significant level of support or resistance and then continues to move in the same direction with substantial momentum. These gaps are frequently generated by a sudden shift in market moods, such as a favourable results announcement or unexpected news, which creates a rise in stock demand. Below is a pictorial representation.
Breakaway gaps are crucial because they frequently signal the start of a new trend and can provide valuable information to investors about the stock’s future direction. A breakaway gap following a period of consolidation, for example, may indicate that the stock is about to embark on a large upward trend, whereas a breakaway gap after a period of rising momentum may indicate that the company is about to face a significant correction.
Investors should look for a gap in the chart that is accompanied by strong trading volume and is followed by a period of continuous movement in the same direction as the gap to identify a breakaway gap. By spotting and comprehending breakout gaps, investors may make more educated judgements about whether to buy and sell positions and capitalise on market movements.
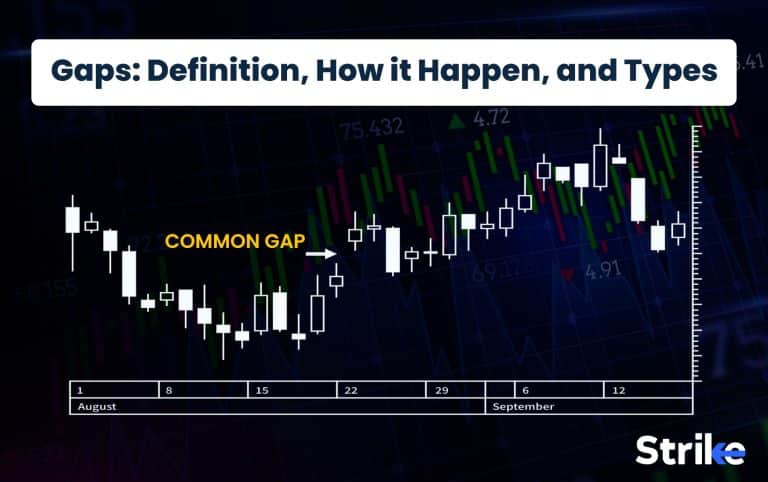
3. Common Gaps
Common gaps are a type of gap that occurs when the price of a stock or other financial instrument moves sharply in one direction, without any significant news or event to justify the move. These gaps are often caused by normal market fluctuations and are not usually accompanied by significant changes in trading volume or market sentiment. Below is how a common gap will look in price charts.
Common gaps are typically less significant than other types of gaps, such as breakaway gaps or exhaustion gaps, and are often quickly filled by subsequent price movements. They still provide valuable information to investors about the future direction of a stock and can be used as part of a broader analysis of market trends and investor sentiment.
Investors should look for a gap in the chart that is not accompanied by significant changes in trading volume or market sentiment, and that is quickly filled by subsequent price movements to identify a common gap.
4. Runaway Gaps
Runaway gaps arise when the price of stocks swings abruptly in one direction and then continues to move sharply in the same direction with significant momentum. Runaway gaps are frequently generated by a sudden shift in market moods, such as a favourable earnings announcement or a piece of major news, which creates a rise in stock demand. Below is a pictorial representation.
Runaway gaps are crucial because they frequently indicate the presence of a strong trend and can give investors valuable information about the stock’s future direction. A runaway gap after a period of consolidation, for example, may indicate that the stock is about to embark on a large upward trend, whereas a runaway gap after a period of upward momentum may indicate that the company is about to face a significant correction. Investors should look for a gap in the chart that is accompanied by strong trading volume and is followed by a prolonged movement in the same direction as the gap to identify a runaway gap.
How to predict Gap Up and Gap Down?
Investors should pay attention to news and events that may have an impact on the company or the larger market to predict gaps. A favourable earnings report or a large merger announcement, for example, may cause a gap, whereas a negative economic report or a geopolitical crisis could cause a gap. Investors should search for technical signs that may indicate a possible gap.
A stock trading near its 52-week high may be more likely to gap up, whereas a stock trading near its 52-week low may be more likely to gap down. A company with a strong short interest may gap up as short sellers race to cover their bets if there is favourable news.
Options trading data can help investors forecast upcoming gaps. A large number of call options purchased on a certain stock could signal that investors are speculating on a future gap higher.
How do you deal with Gaps in Trading?
Stop-loss orders are a typical way to restrict potential losses while dealing with gaps. A stop-loss order is a request to a broker to sell a stock if its price falls below a specific level. Traders can limit their potential losses if the stock continues to trade downward by placing a stop-loss order below the price gap. Limit orders can also be used to enter or exit deals.
A limit order is a purchase or sale of a stock at a defined price or better. Traders can potentially enter a long position at a lower price by placing a buy-limit order at a price slightly below the price gap. Traders might potentially exit a long position at a better price by placing a sell limit order slightly above the price gap.
Traders can utilise technical analysis to spot potential gaps in their trading techniques and change their trading tactics accordingly. Traders, for example, might use chart patterns like gaps that appear after a period of consolidation or a trend reversal to help identify potential opportunities and hazards.
Traders who are prepared and have a sound trading plan can manage the risks and even profit from the opportunities they bring while gaps can be difficult to manage.
What are the benefits of Gaps in Trading?
Spotting stock gaps can provide traders and investors with four main advantages.:
Signals entry and exit points early
Gaps might indicate a shift in market sentiment or a change in the supply-demand balance, which can provide traders with an early entry or exit signal. Traders can make informed trade decisions by recognising gaps and assessing their context.
Limit the chances for loss
Gaps can cause considerable price swings, raising the chance of loss. Traders can manage their risks more efficiently by recognising gaps and placing stop-loss orders or modifying their positions accordingly.
Increased insights about market
Gaps can provide insights about market mood, news, and events that may affect a stock or the market as a whole. Traders can stay informed about market movements and news by monitoring gaps and assessing their context.
Easy to find stocks to trade
Gaps might reveal whether stocks or sectors are performing well or poorly. Traders can select stocks or sectors that are more likely to outperform and avoid those that are more likely to underperform by recognising gaps and studying their context.
Spotting stock gaps can help traders and investors make more educated trade decisions, manage risks more effectively, and perhaps profit from the possibilities presented by gaps.
What are the risks of Gaps in Trading?
Gaps also pose a number of risks that traders must be aware of. The main risks of trading with gaps are listed below.
Gaps give false signals sometimes
Not all gaps result in large market moves, and some gaps can be misinterpreted. Traders must employ other technical analysis techniques and evaluate the context of the gap to determine whether a gap is a reliable signal.
Gaps can be over-relied
Trading only on gaps is dangerous because gaps occur seldom, and traders may lose out on other trading chances. Gaps must be used as part of a larger trading strategy, together with other technical and fundamental considerations.
Gaps may cause liquidity issues
Gaps can cause considerable price swings, which can cause liquidity concerns, particularly in smaller stocks or less liquid marketplaces. Liquidity risks must be recognised by traders, and their trading tactics must be adjusted accordingly.
Price reversals
Gaps might result in price reversals. Traders must evaluate the context of the gap, employ other technical analysis tools, and carefully manage their risks to avoid loss.
Traders must be aware of the dangers involved with gaps and employ them as part of a larger trading plan. Traders must confirm whether a gap is a real signal, manage their risks properly, and consider other technical and fundamental variables.
What are the different Gap Trading Strategies?
Gap and go, gap fading, and gap-fill are three strategies commonly used to trade gaps.
Gap and Go Strategy approach entails identifying stocks with gaps in the morning and then purchasing them at the open with the idea of selling them for a profit later in the day. The gap, according to the theory, signals a burst in momentum that can propel the stock higher throughout the day. The Gap Fading Strategy approach includes spotting stocks with gaps in the morning and shorting them in the hope that the gap would close.
Traders that employ this method believe that the gap signals an overreaction to news or events that will be corrected in time. Gap Fill Strategy technique is identifying companies with gaps and waiting for the gap to close before investing. The theory is that the gap signifies a temporary mismatch in supply and demand that will be corrected as the stock returns to its pre-gap level.
What is an example of Gap Trading?
Assume Infosys reported better-than-expected earnings after the market closed on Monday, with the stock closing at Rs.150. Infosys announced additional good news, causing the stock to jump to Rs.160 at the open. A trader employing the Gap and Go technique may have noticed this gap and purchased Infosys stock at the open, expecting the momentum to propel the stock higher throughout the day.
The trader would have sold their position at the profit goal or raised their stop-loss order to lock in profits later in the day when the stock rose more. But the trader would have been stopped out at the predetermined stop-loss level, limiting their losses if the stock continued to reverse and fall.
A trader employing the Gap Fading technique could have recognised the gap and shorted Infosys stock at the open, anticipating that the gap would close. The stock may have retraced to its pre-gap level as the day progressed, allowing the trader to take profits at the profit target or move the stop-loss order down to lock in profits. The trader would have been stopped out at the pre-determined stop-loss level, limiting their losses if the stock had continued to rise.
What is a Gap Fill in Stocks?
A gap fill is the movement of a stock’s price to close a price gap on its price chart. A gap is a difference between the previous day’s closing price and the beginning price of the next day.
A gap generates a price chart area of support or resistance. Traders frequently seek gap fills as potential trading opportunities because they anticipate the price will move to fill the gap and close the support or resistance point.
For example, traders may expect the stock to retrace to its pre-gap level of Rs.100 to close the gap if the price of a stock rises from Rs.100 to Rs.110, creating a gap. It may continue to trade in line with its previous trend If the stock fills the gap successfully.
Why do Stocks need to Fill Gaps?
Gap fills are not required for stocks, but traders frequently seek for them as potential trading opportunities because they believe the price will move to fill the gap and close the area of support or resistance. A gap establishes a zone of support or resistance on the price chart, which traders use to make trading decisions. It may continue to trade in line with its previous trend if the stock fills the gap successfully.
How do the Gaps get Filled?
Traders are projecting that the price will eventually move back to fill the gap. This might occur as a result of a variety of market forces, such as news events, earnings releases, or changes in investor attitude.
How long do Stock Gaps last until they get Filled?
The duration of stock gaps can vary widely, depending on a variety of market factors. Some gaps may fill within a day or two, while others may take weeks or even months to close.
How often do Stock Gaps happen in Stock Market?
Stock gaps are a common occurrence in the stock market and can happen regularly. The frequency of stock gaps can vary depending on market conditions, news events, and other factors that may affect investor sentiment and cannot be predicted.
Do Gaps always get Filled?
No, there is no guarantee that they will always be filled. Certain gaps may go unfilled for extended periods of time, while others may never be filled at all. Market volatility, investor emotion, and company news can all influence the chance of a gap being filled.
Are Gaps Bullish or Bearish?
Gaps can be both bullish or bearish depending on the direction of the gap and the context in which it occurs. An upward gap (also known as an uptrend gap) is generally considered bullish, while a downward gap (also known as a downtrend gap) is generally considered bearish.


 Previous Article


![15 Investing.com Alternatives [Free+Paid] You Should Use in 2026](https://www.strike.money/wp-content/uploads/2026/04/Investing.com-Alternatives.jpg "15 Investing.com Alternatives [Free+Paid] You Should Use in 2026 4")
![15 TradeStation Alternatives [Free+Paid] You Should Use in 2026](https://www.strike.money/wp-content/uploads/2026/04/TradeStation-Alternatives.jpg "15 TradeStation Alternatives [Free+Paid] You Should Use in 2026 5")
![15 Chartink Alternatives [Free+Paid] You Should Use in 2026](https://www.strike.money/wp-content/uploads/2026/04/Chartlink-Alternatives.jpg "15 Chartink Alternatives [Free+Paid] You Should Use in 2026 6")
: Overview, 10 Types of Indicators, Settings for Different Markets 8")

 : Definition, Formula, calculation, Uses, Advantages Vs limitations 10")


No Comments Yet.