Double Bottom pattern is one of the favourite chart patterns for reversal traders, and swing traders who seek low risk entries following a downtrend. The Double Bottom pattern is frequently used by technical analysts, price action traders and even institutions because it tells a psychological story of change in momentum from bearish to bullish. The secret behind its popular status is that it is dependable when used in conjunction with volume confirmation and a neckline breakout. Traders do not guess bottoms but wait until they see signs of strength, so this type of pattern is an often-used tool to trade an early trend reversal with a high level of reward.
What is a Double Bottom Pattern?
A Double Bottom pattern is a bullish reversal chart pattern that signals a potential change of trend from downtrend to uptrend. Double Bottom pattern usually occurs after a stock reaches similar low prices two times with a moderate rise in price between the two peaks.

Why is it called a W Pattern as well as Double Bottom?
The double bottom pattern is also called the “W” pattern because its shape on the price chart visually represents the letter ‘W”. This happens because the pattern consists of two distinct lows at roughly the same price level, separated by a rise in price similar to the latter “W”.

When Does Double Bottom Pattern Appear?
The Double Bottom Pattern Appears after the prolonged or sustained downtrend in price. The appearance of the Double Bottom pattern after prolonged downtrend suggests the shift in momentum from bearish to bullish. This pattern forms when price hits the same low two times with a moderate peak in between.
Is the Double Bottom Pattern Bullish?
Yes, the Double Bottom pattern is a bullish chart pattern. It signals the losing momentum of the downtrend and possible reversal to uptrend. This pattern visually represents the failure of sellers to push prices below the support of the two lows, leading to growing buying pressure. Traders use this signal to identify buying opportunities.
What Does Double Bottom Pattern Indicate in Technical Analysis?
Double Bottom pattern in technical analysis indicates a potential trend reversal from downtrend to Uptrend. It indicates hesitation of sellers at lower levels and failure to create new lows, which clearly shows trend exhaustion and an emerging dominance of buyers.
Once the neckline breaks, it points toward an upward move driven by declining supply and increasing demand. Double Bottom communicates that bearish momentum has faded, distribution is complete, and a potential trend reversal to the upside is now underway.
What are the Components of the Double Bottom Pattern?
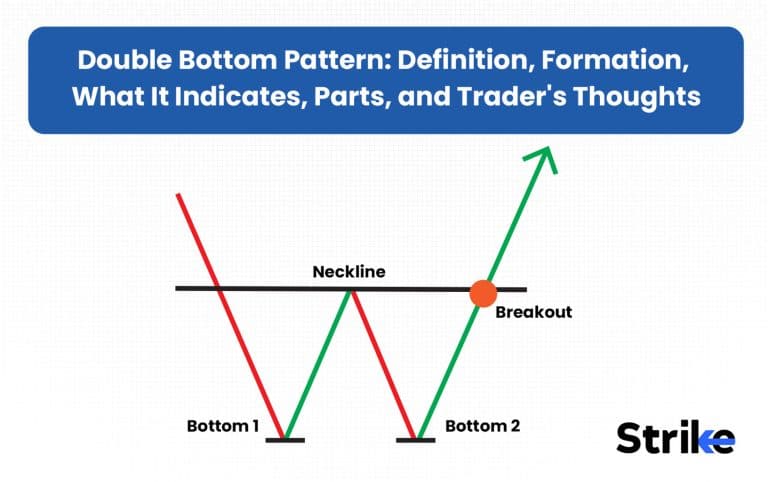
There are five major components of the Double Bottom pattern. The components are first bottom, pullback, second bottom, neckline and breakout point.

- First Bottom: The first low formed after sellers push the price lower in a downtrend. After hitting a low, momentum slows down and price takes support. This is marked as a support zone.
- Pullback: After the first bottom price reverses or rises due to moderate buying pressure from a support zone.
- Second Top: The price falls again to form a new low, but fails to break the support zone or first low. This signals weakening selling momentum.
- Neckline (Resistance): This is the price level of the highest point of pullback between the two bottoms. This neckline acts as a key resistance level that traders watch closely.
- Breakout Above Neckline: Break above neckline confirms the trend reversal to bullish and potential buying opportunity.
The pattern resembles the shape of an “W” formed by these components on the chart, reflecting sellers’ attempts to push prices lower that ultimately fail, resulting in a likely reversal to an uptrend.
What’s the Psychology behind the Double Bottom Pattern?
The psychology behind the Double bottom pattern illustrates a gradual shift in momentum from bearish to bullish.
- First Bottom( Sellers in Control ): A strong downtrend market driven by optimistic sellers pushing price lower. As price reaches a significant support level, some traders book profits creating the first bottom.
- Pullback (Profit Booking): As sellers start booking profits, new buyers also step in at lower prices to long the market. This creates a small pullback, but sellers still expect the downtrend to continue.
- Second Bottom( Failed Sellers Attempt ): Sellers try to push the price down again. But this time the move is weaker with less volume and less momentum. This failed attempt shows losing seller control and strong support.
- Break of Neckline ( Buyers Take Control ): Once the neckline resistance breaks, it hits sellers stop loss and builds buying pressure fueled by buyers long entries, confirming uptrend.
In essence, this pattern marks a psychological transition from confidence and selling enthusiasm to doubt, hesitation, and ultimately buying pressure, making it a reliable bullish reversal indicator.
Do Both Bottoms have to be Exactly Equal?
No, both the bottoms in a Double bottom pattern do not necessarily have to be of exactly equal size but should be anywhere very close to each other to be counted as a valid pattern. The bottoms should form within the range of 3% to indicate high and definite support. Minor differences like the second bottom being slightly higher or lower are acceptable and actually have psychological significance.

- If the second bottom is a little lower, it might be a failed breakout and sellers were not able to hold momentum below the support.
- If the second top is higher, it indicates even more weak seller power on the retest, which can also be an early indication of reversal strength.
What matters most is overall “W” pattern and break above the neckline to confirm the pattern.
What is the Neckline in a Double Bottom?
The neckline in a Double bottom pattern is the resistance level formed by the swing high between the two bottoms. It represents the highest price point reached after the first low and the price tries to correct by forming the second low. This level is important as it becomes the confirmation point of the pattern.

But, how to find and draw the neckline?
You can find and draw the neckline by following three simple steps. The steps are double bottom identification, identifying the highest point and drawing the neckline.
- Identify the two lows of the Double Bottom pattern at roughly the same low price level.
- Locate the highest price point between these two lows (the swing high).
- Draw a horizontal or slightly angled line connecting these low points; this line is the neckline or resistance level.
The importance of the neckline lies in its role of resistance, a decisive close above the neckline signals buyers control, confirming the trend reversal.
What are the Variants of Double Bottom Pattern?
There are four major variants of Double Bottom pattern based on .
Adam & Eve Double Bottom

- Adam has a sharp pointed first bottom which is V-shaped.
- Eve makes a curved and less sharp second bottom.
- This combination indicates a first- sharp sell-off (Adam) then a more gradual test of support (Eve).
- It is one of the trendy price action formations which is an overwhelming indication of a favorable bullish reversal.
Perfect Symmetrical Double Bottom

- Both bottoms are roughly equal in depth and shape.
- The pattern appears as a symmetrical “W” on the chart.
- This is the classic textbook pattern signaling buyers defend the support level effectively twice.
- It is considered reliable due to its clear formation and balance.
Complex Double Bottom

- Features multiple lows near the support zone forming a broader base rather than two simple lows
- It often indicates strong accumulation over a longer time.
- More challenging to trade but can lead to powerful reversals if confirmed.
Deep Double Bottom

- The second bottom penetrates deeply below the first low, forming a false breakdown or “bear trap.”
- This often shakes out weak holders before a sharp reversal higher.
- Confirmation occurs after the price returns above the neckline.
- It shows strong buyer willingness to absorb selling pressure even after the deeper test.
These variants reflect different price action and market psychology nuances but all serve as bullish reversal patterns when properly confirmed by volume and breakout above the neckline.
How to Identify a Double Bottom Pattern on a Chart?
There are six major steps to identify the Double Bottom pattern on the chart. The steps are confirmation of prior trend, identifying first bottom, pullback, second bottom, neckline and breakdown.
- Confirm Prior Uptrend: Look for the initial strong bearish momentum because this pattern forms after the strong bearish movement.
- Identify First Bottom: Spot the first low where price faces support after downtrend and starts to pull back. This bottom reflects sellers reaching strong support.
- Identify Pullback/Resistance: Look for a price to rise after taking support to create swing high. This will create the resistance level which will act as a neck line.
- Identify Second Bottom Near First Bottom: Look for the second bottom which should be near the level of the first bottom. This reflects the failed attempt of sellers to surpass the support due to weak selling pressure.
- Draw Neckline: Connect the highest price points between the two bottoms with a horizontal line. This line serves as the critical resistance level.
- Await Breakdown: This pattern confirms when price breaks decisively above the neckline with increased volume, signalling a shift in momentum from bearish to bullish.
This sequence visually creates an “W” shape on the chart. Traders use the neckline break as a signal to enter long positions or exit short in anticipation of upward price movement
How Do You Confirm a Double Bottom?
To confirm a Double Bottom pattern, traders typically look for major key signals. The signals include break and close above the neckline, volume and supporting signals from indicators.

- Break and Close Above Neckline: The double bottom pattern is confirmed when the price breaks and closes above the neckline. This confirms that bulls have taken control and bullish reversal is valid.
- Volume Spike During Breakout: An increase in volume during the breakout above the neckline confirms the buying pressure and enhances the reliability of the pattern.
- Supporting Signals Like RSI Divergence: You can get additional confirmation from technical indicators like RSI showing bullish divergence or oversold conditions, and MACD crossover etc.
Together, these rules help avoid false signals and improve confidence that the pattern signals a genuine trend reversal. Waiting for a decisive neckline break with volume and bullish confirmation is essential for effective trading decisions involving the Double Bottom pattern.
How to Avoid False Double Bottom?
To avoid false Double Bottom patterns, consider these common false signals.The signals are price breaking below first bottom, patterns forming in consolidation and premature entries.
- Price Breaks Above First Top: Avoid trading Double bottom pattern if the price breaks below the level of the first bottom, it invalidates the double bottom pattern. This indicates the strong selling momentum rather than reversal.
- Pattern Forms in Consolidation or Sideways Market: Double bottoms are reliable usually after clear strong downtrend. If the price is in consolidation range without any strong downtrend, it will give a false signal.
- Premature Entries Before Neckline Break: The Double bottom pattern gets confirmed only after price breaks and closes above the neckline. Avoid premature entries before neckline breaks.
Additional safeguards include checking for decreasing volume on second bottom formation and a volume spike on breakdown, as well as supporting indicators like RSI bullish divergence. Waiting for these confirmations enhances the reliability of the Double bottom and helps avoid costly mistakes.
Does Volume Matter in a Double bottom?
Yes, volume is very important in a double bottom pattern as it increases the reliability of the pattern. During the formation of the second bottom, volume usually dries out which indicates weakening of sellers. During the breakdown point of the neckline, volume increases confirming the formation of a double bottom pattern.
That’s how volume plays a crucial part in the Double bottom pattern, because without volume this breakout may be false or the pattern can be less reliable.
How to Trade the Double bottom Pattern
There are four major steps to trade the Double bottom pattern. The steps are pattern identification, entry, stoploss, and target.
- Pattern Identification: Identify a prevailing uptrend before the pattern forms and spot two lows at roughly the same level creating support. Confirm if volume is higher on the first low and lower on the second. For instance, NBCC fell from 114 and made first bottom near 108, with high volume. During the formation of the second bottom volume got reduced.

- Entry: Wait for price to close above the neckline with a good volume confirming the pattern. Enter the long position when the breakout is confirmed. NBCC broke above the neckline level of 110.3 with increasing buying volume.
- Stoploss: Place the stop loss below the low of the second bottom to avoid fake reversals. You can also place stoploss at breakout candles low in order to have tight stoploss. In the case of NBCC, the stop loss is below 108.
- Profit Target: Measure the height of the neckline to the low and project this distance upward from the neckline break point. Use this projected level as your initial profit target and trail stop loss to lock in profits if price continues upward.

It is important to manage risk by using proper position sizing, stop loss and following proper risk management. Avoid trading weak double bottoms and overtrading.
Based on entry criteria, we can have three setups to trade the Double Bottom pattern. The setups are neckline break entry setup, early reversal entry setup and breakdown and retest entry setup.
- Neckline Break Entry: Enter immediately once the price breaks and closes above the neckline. Most commonly used setup across intraday and swing trading, because it gives clear confirmation.
- Early Reversal Entry Strategy: This involves entering trade during the formation of the second bottom without waiting for price to close above the neckline. This is little aggressive setup and requires tighter stoploss
- Break and Retest Entry: This involves entering a trade once price breaks the neckline and retesting it. This setup is for conservative traders and high reliability seekers.
Depending on your risk appetite and style of trading, you can follow one of the entry setups to trade double bottom chart patterns.
Double Bottom Trading Strategy for Intraday
Double Bottom trading strategy for intraday involves identifying and trading double bottom patterns at a lower time frame such as 5 min to 15 min.
- Pattern Identification: Identify a prevailing uptrend before the pattern forms on a 5-15 min chart. Spot two lows roughly at the same level creating support. Confirm if volume is higher on the first low and lower on the second.
- Entry: Wait for price to close above the neckline with a good volume on a 5-15 min chart, confirming the pattern. Enter the long position when the breakout is confirmed.
- Stoploss: Place the stop loss below the low of the second bottom to avoid fake reversals. You can also place stoploss at 5-15 min breakout candles low in order to have tight stoploss.
- Profit Target: Measure the height of the neckline to the low and project this distance upward from the neckline break point. Use this projected level as your initial profit target and trail stop loss to lock in profits if price continues upward.
It is important to manage risk by using proper position sizing, stop loss and following proper risk management, because the lower timeframe has more volatility. Avoid trading weak double bottoms and overtrading.
Double Bottom Trading Strategy for Swing Trading
Double Bottom trading strategy for swing involves identifying and trading double bottom patterns at a higher timeframe such as 4hrs to Daily.
- Pattern Identification: Identify a prevailing downtrend before the pattern forms on a 4hrs or Daily chart. Spot two lows roughly at the same level creating support. Confirm if volume is higher on the first low and lower on the second.
- Entry: Wait for price to close above the neckline with a good volume on a 4hrs or Daily chart, confirming the pattern. Enter the long position when the breakout is confirmed.
- Stoploss: Place the stop loss below the low of the second bottom to avoid fake reversals. You can also place stoploss at 4hrs or Daily breakout candles low in order to have tight stop loss.
- Profit Target: Measure the height of the neckline to the low and project this distance upward from the neckline break point. Use this projected level as your initial profit target and trail stop loss to lock in profits if price continues upward.
It is important to manage risk by using proper position sizing, stop loss and following proper risk management. Avoid trading weak double bottoms and overtrading.
Double Bottom Trading Strategy for Forex Trading
Double Bottom trading strategy for Forex involves identifying and trading double bottom patterns on a high volume and high liquidity currency pairs such as EUR/USD, GBP/USD, USD/CAD, AUD/USD and USD/JPY.
- Pattern Identification: Identify a prevailing uptrend before the pattern and spot two lows roughly at the same level creating support. Confirm if volume is higher on the first low and lower on the second.
- Entry: Wait for price to close above the neckline with a good volume confirming the pattern. Enter the long position when the breakout is confirmed.
- Stoploss: Place the stop loss below the low of the second bottom to avoid fake reversals. You can also place stop loss at breakout candles low in order to have tight stop loss.
- Profit Target: Measure the height of the neckline to the low and project this distance upward from the neckline break point. Use this projected level as your initial profit target and trail stop loss to lock in profits if price continues upward.
Price action is best followed in the forex market, hence probability of making profit is high in forex trading. It is important to manage risk by using proper position sizing, stop loss and following proper risk management. Avoid trading weak double bottoms and overtrading.
How Reliable is the Double bottom Pattern?
The Double bottom pattern is a moderately reliable bullish reversal chart pattern in technical analysis. According to the Samurai Trading Academy, when the double bottom was tested over 10 years and 200,000 patterns, the double bottom “success rate” was about 78.55%.
As per Pocketoption study, the success rate varies by timeframe. Longer time frames (weekly, monthly) tend to offer more reliable signals than shorter-term intraday or daily charts where noise is higher.

The Double Bottom pattern has a statistically backed reliability range of around 75-80% when used with proper confirmation, volume analysis, and supportive indicators, making it a valuable tool for identifying potential trend reversals in trading.
Is Double Bottom Strategy Profitable?
Yes, Double bottom strategy is profitable trading strategy, but only if executed with proper risk management, confirmation, and in conjunction with other analysis tools. Double bottom is a structural way to catch trend reversal trades but there are few things to keep in mind before trading the Double Top pattern.
- Wait for the neckline breakdown.
- Combine it with volume.
- Trade it on higher timeframes.
- Use proper stop-loss
- Target the pattern height.
Although this pattern doesn’t appear daily, when it appears it gives high quality reversal trade, specially on a higher timeframe.
What Indicators work Best with Double bottom Patterns?
The indicators that work best with Double bottom Patterns include RSI, MACD, Stochastic Oscillator, Volume and EMA.
- RSI (Relative Strength Index): RSI helps to increase the reliability of the Double bottom pattern by forming RSI bullish divergence. RSI bullish divergence is formed when price makes two equal bottoms but the RSI makes high low, signaling weakening selling strength. Oversold RSI levels near the second bottom also strengthen the bullish signal.

- MACD (Moving Average Convergence Divergence): The bullish crossover in MACD near or after the second bottom indicates buyers gaining momentum, helping confirm the trend shift from bearish to bullish.

- Stochastic Oscillator: Oversold readings or a stochastic bullish crossover near the second bottom strengthen the case for a reversal.

- Volume Indicators: Volume reduces during the formation of the second bottom, signaling losing seller strength. During the breakout of the neckline resistance, volume indicators usually increases, indicating strong buying pressure.

- Moving Averages: As moving averages act as a dynamic support and resistance, the Double bottom pattern reliability increases when the price breaks above the key EMA such as 20 or 50 after breaking the neckline.

Using these indicators together with price action improves accuracy, helping traders avoid false signals and better time entry and exit points in Double Bottom trades.
What is the Best Timeframe for Double Bottom?
The best time frame to trade Double bottom is a higher timeframe such as 4hrs, daily, and weekly. Higher timeframes are more reliable because it provides a clear view of significant price action and trend context, while filtering out the market noise common in shorter intervals like intraday charts.
The reliability of the pattern with respect to timeframe is given below in the table.
| Timeframe | Reliability Level | Notes |
| Weekly | Extremely High | Very strong reversal signals; patterns form slowly but are highly dependable. |
| Daily | Very High | Clean structure, strong trend reversals, minimal noise. |
| 4-Hour | High | Good balance between accuracy and trade frequency. |
| 1-Hour | Moderate | Works if confirmed with volume and momentum indicators. |
| 15-Minute | Low | Noisy; higher chance of false patterns and fake breakouts. |
| 5-Minute / 1-Minute | Very Low | Highly unreliable due to volatility and constant noise. |
Trading Double bottom on higher time frames improves pattern reliability and reduces false signals, making daily and weekly charts especially favored among traders to spot strong bullish reversals.
Is Double Bottom a Leading or Lagging Signal?
A Double Bottom is primarily a lagging signal, not a leading one because the trend will only be confirmed when the neckline is broken. Until the breakout, two bottoms might be just the normal support in an existing downtrend. The confirmation comes after price has already shown weakness and broken above neckline, making it reactive rather than predictive.
But there is one leading feature which is the second bottom. Second bottom formation may serve as an early warning sign of the declining momentum of sellers and possible formation of second bottom when Volume declines and RSI/MACD shows bullish divergence.
Benefits vs Limitations of the Double Bottom Pattern
The benefits and limitations of the double bottom pattern are mentioned below in the table.
| Benefits | Limitations |
| Signals a potential trend reversal from downtrend to uptrend | Can produce false signals during strong downtrends |
| Easy to identify visually on most timeframes | Requires confirmation (neckline breakout) to be reliable |
| Works well with supporting indicators like RSI divergence | Pattern may take time to form, causing delayed entries |
| Clear entry, stop-loss, and target levels | Second bottom may break slightly lower, confusing traders |
| Provides favorable risk–reward when traded with breakout | Low reliability in low-volume or choppy markets |
The Double bottom pattern offers valuable insights for identifying bullish reversals but must be used with confirmation and supporting tools to mitigate risks associated with its limitations.
What are the Other Popular Chart Patterns besides Double Bottom?
The other chart patterns besides Double Top are mentioned below in the table.
| Chart Pattern | Type | What It Indicates | Key Characteristics |
| Double Top | Reversal (Bearish) | Trend reversal from uptrend to downtrend | Two peaks at similar levels + neckline break |
| Head & Shoulders | Reversal (Bearish) | Major reversal after an uptrend | Left shoulder – head – right shoulder + neckline |
| Triple Top | Reversal (Bearish) | Strong rejection after three attempts to break resistance | Three similar highs + breakdown |
| Triple Bottom | Reversal (Bullish) | Strong accumulation & reversal to uptrend | Three similar lows + breakout |
| Ascending Triangle | Continuation (Bullish) | Trend continuation or breakout | Flat resistance + rising higher lows |
| Descending Triangle | Continuation (Bearish) | Breakdown continuation | Flat support + falling lower highs |
| Symmetrical Triangle | Continuation | Breakout either direction | Converging trendlines |
| Cup and Handle | Bullish | Accumulation then breakout | Rounded bottom + handle pullback |
| Flag Pattern | Continuation | Strong trend pause then continuation | Sharp pole + consolidation |
| Pennant | Continuation | Short consolidation before trend resumes | Small symmetrical triangle after a pole |
| Rounding Bottom | Reversal (Bullish) | Long-term bottoming | U-shaped bottom |
| Falling Wedge | Reversal (Bullish) | Reversal from a downtrend | Converging falling trendlines |
| Rising Wedge | Reversal (Bearish) | Reversal from an uptrend | Converging rising trendlines |
These patterns help traders identify potential trend continuations or reversals and improve trading decisions across different markets and assets.
What is the difference between Double Top and Double Bottom?
The difference between Double Top and Double Bottom is mentioned below in the table.
| Feature | Double Top | Double Bottom |
| Type | Bearish reversal pattern | Bullish reversal pattern |
| Trend Before Pattern | Uptrend | Downtrend |
| Structure | Two peaks at similar price levels | Two troughs at similar price levels |
| Key Level | Neckline (support) | Neckline (resistance) |
| Signal Trigger | Breakdown below neckline | Breakout above neckline |
| Psychology | Buyers fail twice → sellers gain control | Sellers fail twice → buyers gain control |
| Volume Behaviour | Often lower volume on second top | Often lower volume on second bottom |
| Outcome Expectation | Downtrend continuation after breakdown | Uptrend continuation after breakout |
Both patterns rely on the breakout or breakdown of the neckline to confirm the reversal and are valuable tools for traders to anticipate significant trend shifts and make informed trading decisions.
Difference between Double Bottom vs Inverse Head and Shoulders vs Triple Bottom
The difference between Difference between Double Bottom vs Inverse Head and Shoulders vs Triple Bottom are mentioned below in table.
| Feature | Double Top | Head & Shoulders | Triple Top |
| Number of Peaks | 2 peaks at similar levels | 3 peaks (left shoulder, higher head, right shoulder) | 3 peaks at similar levels |
| Shape | “M” shaped | Three-wave structure with central higher peak | Flat, wide structure with three equal highs |
| Reliability | Moderate | High | Higher than Double Top; less common |
| Trend Requirement | Strong prior uptrend | Mature uptrend | Uptrend or sideways-to-uptrend |
| Key Psychology | Buyers fail twice at resistance → exhaustion | Shift from higher highs to lower highs → distribution | Buyers fail three times → strong selling pressure |
| Neckline Type | Single horizontal swing-low support | Can be horizontal, rising, or falling | Horizontal support formed by two swing lows |
| Breakdown Confirmation | Close below neckline | Close below neckline | Close below neckline/support |
| Target Projection | Height from peak to neckline | Height of head to neckline | Height from peak to neckline |
| Frequency in Market | Very common | Common in trends | Less common |
| Strength of Reversal | Moderate reversal potential | Strong reversal potential | Strong but slower reversal |
| Volume Behavior | High volume on breakdown boosts reliability | Left shoulder = high volume → head lower → breakdown high | Volume rises on third rejection and breakdown |
Each pattern has unique characteristics, reliability, and implications for trend reversals, helping traders choose appropriate setups based on market context.


 Previous Article


![15 Investing.com Alternatives [Free+Paid] You Should Use in 2026](https://www.strike.money/wp-content/uploads/2026/04/Investing.com-Alternatives.jpg "15 Investing.com Alternatives [Free+Paid] You Should Use in 2026 220")
![15 TradeStation Alternatives [Free+Paid] You Should Use in 2026](https://www.strike.money/wp-content/uploads/2026/04/TradeStation-Alternatives.jpg "15 TradeStation Alternatives [Free+Paid] You Should Use in 2026 221")
![15 Chartink Alternatives [Free+Paid] You Should Use in 2026](https://www.strike.money/wp-content/uploads/2026/04/Chartlink-Alternatives.jpg "15 Chartink Alternatives [Free+Paid] You Should Use in 2026 222")
: Overview, 10 Types of Indicators, Settings for Different Markets 224")

 : Definition, Formula, calculation, Uses, Advantages Vs limitations 226")


: How We Used This 70/30 Indicator in 6 High Win-rate Strategies 229")


No Comments Yet.