The Standard Deviation is a statistical value that represents the variation of data from its mean value. A Standard deviation is used in the financial world to measure the risk associated with a particular security. Traders and investors use standard deviation to study how far a security’s price moves away from its average price. It shows them the volatility. The Standard deviation works in technical analysis by helping market participants identify the deviation of each price point from the mean or average price. Higher deviations indicate more volatility, and lower deviations indicate lower volatility.
The Standard Deviation is very important in technical analysis as it helps investors and traders understand the price movements in the market, which in turn allows them to adopt the right investment strategies. The Standard deviation is calculated as the square root of the variance, wherein variance is the degree of deviation of each number in a sample data set from the sample’s mean or average.
What is a Standard Deviation?
The Standard deviation is a statistical measure that represents the dispersion of data from its average or mean value. The Standard deviation in the financial market helps to measure the size of price movements and denotes the volatility of the security. Volatility, in finance, refers to the rate at which the price of an asset changes over a fixed period.
The Standard deviation helps measure the risk associated with a certain financial security by indicating its volatility. A high standard deviation indicates high volatility and represents high investment risk. A low standard deviation, on the other hand, indicates low volatility and therefore low investment risk.
How do Standard Deviation and Mean relate to one another?
The Standard deviation and mean are closely related to one another. The Standard deviation always measures the variation of data relative to its mean value. The Standard deviation is calculated as the square root of the variance, where variance refers to the deviation of each value in the data set from the mean of the entire data set.
The Standard deviation reflects the variation tendency of the values in the data set, while the mean reflects the central value of the data relative to which the other points are analyzed. The Standard deviation and mean need to be studied together to gain a proper understanding of the data set and its deviations.
How can a high Standard Deviation and Mean affect investment risk and return?
A high standard deviation and mean represent a large degree of deviation from the average price of the security and thereby denote a high degree of volatility. A high degree of volatility means that the price of the security is more prone to price fluctuations, which could be positive or negative. Increased volatility increases investment risk and is usually only preferred by investors and traders with a strong risk tolerance. Securities with high returns are usually accompanied by high investment risk and high volatility.
How does a Standard Deviation work in Technical Analysis?
The Standard Deviation works in technical analysis by giving investors and traders information about the volatility of a security and the investment risk associated with it. The Standard deviation is used to gain an understanding of potential trade entry and exit positions. Investors and traders gain an understanding of the size of the price moment by using the standard deviation. A high standard deviation indicates a major movement from the mean price, while a low standard deviation indicates a minor movement from the mean price.
Investors and traders use standard deviation to form their investment and trading strategies depending on their risk appetites. Securities with lower standard deviations are less susceptible to price fluctuations. Investors with lower-risk appetites tend to prefer securities with a low standard deviation. Securities with high standard deviations are highly volatile and susceptible to price fluctuations. Investors with high-risk appetites tend to prefer securities with high standard deviations that are traded quickly in a short span of time for high profits.

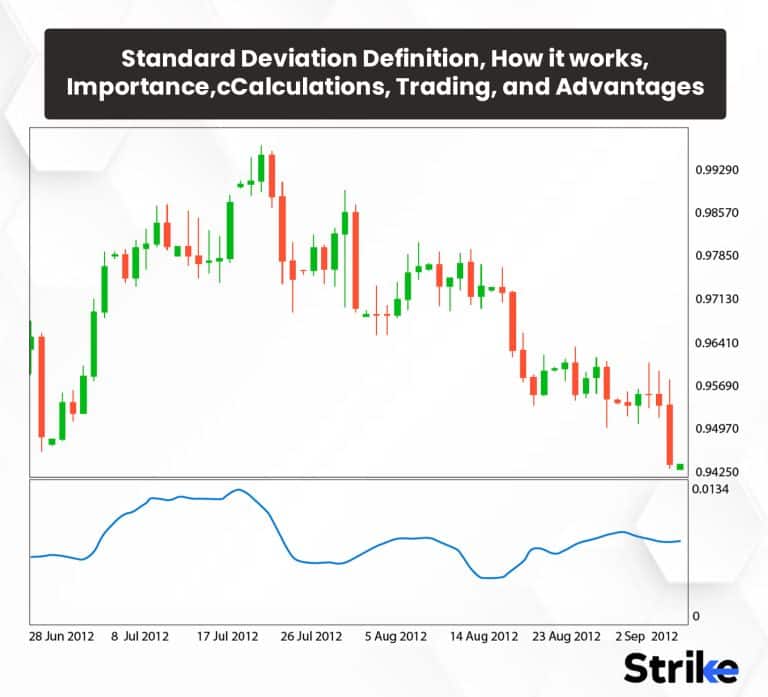
How do you find the Standard Deviation on a graph?
The Standard Deviation is found on any price chart by applying the standard deviation indicator to the stock price chart. The image below shows a stock price chart with the standard deviation indicator plotted below it.

The top portion of the image is a candlestick price chart. The blue line at the bottom is the standard deviation. The shaded area in the image shows how the standard deviation indicator works. The standard deviation line shows a significant rise in the purple-shaded area. It must be noted that the increase in the standard deviation is accompanied by a sudden increase in the security price as well. The image also shows that the security’s price is more or less stable when the standard deviation line remains more or less straight.
What is the importance of Standard Deviation in Technical Analysis?
Standard Deviation is of high importance in technical analysis, primarily because it helps investors and traders measure the risk associated with a particular security. The Standard deviation acts as an important assessment tool by informing traders about the volatility of a security. Volatility in a financial market refers to the measure of fluctuation of the security’s or index’s price around its mean price. Standard deviation helps investors and traders form their investment or trading strategies depending on their individual risk appetites.
Short-term traders with more risk appetite tend to make use of market situations with high standard deviation values, while long-term investors tend to prefer market situations where the standard deviation values are lower. The Standard deviation is also an important component of some of the widely used technical indicators, including Bollinger Bands, Volatility Channel Indicator, Keltner Channel Indicator, Donchain Channel Indicator, etc.
What is the formula for Standard Deviation?
The formula for Standard Deviation is formed by calculating the square root of variance. The formula for standard deviation is given below.

The mean value is calculated by dividing the sum of all the data points by the total number of data points, which is represented by ‘n’ in the formula above. The variance of each point in the data set is calculated by subtracting the mean value from the value of the data point.
How do we calculate the Standard Deviation?
The Standard deviation is calculated using the formula for standard deviation in six main steps. The formula for calculating the standard deviation is given below.

These are six steps to follow, to calculate the standard deviation based on the formula given above.
- The first step is to calculate the mean of the data set. The mean of the data set is calculated by dividing the sum of all the values of the data set by the total number of values or sample elements in the data set.
- The second step is to calculate the variance of the data set. The variance of each point in the data set is calculated by subtracting the mean value from step one from the value of the corresponding data point.
- The third step in calculating the standard deviation is to calculate the square of the variance of each point in the data set. Each of the values from Step 2 is squared to obtain these values.
- The fourth step in calculating the standard deviation is to add together all the squared variance values from Step 3.
- The fifth step is to divide the sum obtained in Step 4 by one less than the total number of data points. The sum is divided by (n-1), if n is the total number of data points.
- The sixth and final step in calculating the standard deviation is to calculate the square root of the quotient obtained in Step 5.
The six simple steps are used to calculate the standard deviation for any data set. Investors and traders who utilize standard deviation in their investment or trading strategies must have a sound understanding of how the calculations are performed in order to better comprehend the logic behind the statistical tool.
How to use Standard Deviation in Trading?
Using Standard Deviation in trading can be useful. These are the steps that traders can take to formulate a suitable trading plan.
- The first step to using standard deviation in trading is to measure the price chart of the security. These are available on all trading platforms like trading view including strike.money.
- The second step to using standard deviation in trading is to apply the standard deviation indicator to the security’s price chart. The standard deviation indicator is chosen from the drop-down menu that usually appears in the indicators section on platforms.

The top part of the image is the candlestick price chart. The green line on the lower part is the standard deviation indicator.
3. The third step to using standard deviation in trading is to analyze the graph produced by the standard deviation indicator.
- In the chart uploaded above, the purple shaded area represents the phase when Banknifty was consolidating in a tight range for several weeks.
- The red arrows represent the divergence on the price vs standard deviation. When Banknifty fell, standard deviation rose from the bottom.
These are the weekly candles, so this information is beneficial for short term traders and day traders to calculate this thing during the trading plan that is supposed to be created for every trade that is placed.
The volatility and, therefore, risk are lower when the standard deviation is lower. The image also depicts what happens when the standard deviation line indicates a huge variation. The significant variation in the standard deviation line denotes that the security is highly volatile at that point and is susceptible to price fluctuations and more risk.
4. The last and final step to using the standard deviation indicator in trading is to decide on trade entry and exit positions. Lower time frame analysis is the final step after noting down important information from the higher time frame plus standard deviation analysis.
5. The interpretation of the standard deviation results depends on the risk appetite of the trader. Traders with a higher risk appetite tend to make trades when the standard deviation is high and the prices are highly volatile, with the aim of making higher returns. Traders with a lower risk appetite tend to make trades when the standard deviation is low and the prices are not very volatile, with a longer-term investment in mind.
The Standard deviation is, however, cannot be used alone.
It is often used with other technical indicators along with the standard deviation to validate the results and make informed decisions. The other technical indicators that can be used along with the standard deviation include Moving Averages, Relative Strength Index (RSI), On-Balance Volume (OBV), Fibonacci Retracement, price action and different time frame analysis.
How can Standard Deviation indicate market trends like support and resistance levels?
The Standard deviation does not indicate market trends such as support or resistance levels. The Standard deviation only reflects market volatility. The Standard deviation, however, indicates support and resistance levels when used along with other technical indicators. Bollinger Bands, which are based on the standard deviation, are useful in indicating support and resistance levels. The image below shows how Bollinger Bands are used to identify support and resistance levels.

The upper band represents the resistance level and the lower band the support level, in a bullish market. The upper band represents the resistance level, and the lower band is the support level when the market is bearish. The Standard deviation, by itself, only indicates the variation of the price from the average price, and high standard deviations indicate a possible support or resistance level, depending on the overall market trend.
What trading strategy is best to use in Standard Deviation?
The trading strategy to use for standard deviation differs from trader to trader depending on their risk appetite. Traders with a higher risk appetite tend to make trades when the standard deviation is high. The strategy here is to make use of the market’s volatility to make maximum gains. The downside to this strategy is that the risk of incurring losses is high. Traders with low-risk appetites tend to opt for assets with a low standard deviation. The strategy for long-term investment is not to make quick trades and profit from market fluctuations but to invest long-term and obtain long-term returns.
When is the best time to use the Standard Deviation?
The best time to use the standard deviation is when the market volatility is moderate and the price fluctuations are centered around the middle of the price range. Using the standard deviation at such times helps investors and traders gauge the extent of the fluctuation. Investors and traders use this information to gain a better understanding of the price movement and alter their trading strategies accordingly. The Standard deviation is also used while studying the trend predictions made by other technical indicators. The Standard deviation indicates when volatility is on the rise, denoting a possible trend reversal.
What is the importance of volatility in the Standard Deviation?
Volatility plays a key and central role in standard deviation. The Standard deviation is the statistical measure of volatility. The Standard deviation, in the financial context, measures the extent of price fluctuations. The Standard deviation quantifies the market volatility, which then be used by investors and traders to assess market risk. The Standard deviation gives its users a clear idea of how much the price has dispersed from its average or mean value. A high standard deviation indicates high volatility, and a low standard deviation indicates low market volatility.
How to use Standard Deviation in conjunction with Indicators?
Standard deviation is used with other technical indicators to obtain comprehensive information. The Standard deviation, when used along with other technical indicators, validates the results of both and helps investors and traders make informed decisions. Investors and traders who wish to use other indicators with a standard deviation choose the desired indicators from the drop-down menu available in the price chart.
The indicators will either be plotted on the price chart in different colors or below the price chart. Investors and traders then study the results of the standard deviation in conjunction with the other technical indicators to obtain comprehensive information. Moving Averages, Bollinger Bands, and RSI are all technical indicators that are used with standard deviation.
Investors and traders must remember to choose ones that complement the standard deviation indicator while choosing a technical indicator. Moving Averages, for example, is used with a standard deviation. Moving Averages will indicate the current trend, and by using the standard deviation with it investors and traders identify points of high volatility, which could be points of possible trend reversals.
How does Bollinger Bands relate to Standard Deviation in Technical Analysis?
Bollinger Bands and standard deviation are closely related to each other, as Bollinger Bands are technical indicators that use standard deviation as their primary component. A Bollinger Band comprises three lines, including a middle line, an upper band, and a lower band. The middle line represents the Simple Moving Average over a period of time. The upper and lower bands indicate the standard deviation of the prices above and below the moving average.
Can Standard Deviation be used in conjunction with Moving Averages?
Yes, standard deviation can be used with Moving Averages. The two can be used together to gain a sound understanding of price volatility, the current market trend, and the strength of the market trend. Moving Averages and standard deviations complement each other and work well together.
Is it possible to use the Standard Deviation together with the Relative Strength Index (RSI)?
Yes, it is possible to use the standard deviation together with the RSI. The RSI is a technical indicator that signals overbought and oversold levels. Using the standard deviation along with the RSI can help validate the results of the RSI. An overbought RSI signal that is accompanied by a high standard deviation can confirm an upcoming bearish trend reversal.
What is better in trading a high or low Standard Deviation?
A low standard deviation is sometimes better as it shows consistency. But it also sometimes means low growth. Hence, it depends on the situation and trader’s choices.
Is a 10% Standard Deviation high?
A 10% standard deviation is considered slightly high. Standard deviation of above 10% is high, while below 10% is considered low.
What is an example of a Standard Deviation used in Trading?
The image below shows an example of a standard deviation.

The image shows a candlestick stock price chart, where the price is indicated on the y-axis and time on the x-axis. The green line indicates the standard deviation. The standard deviation, as the image shows, is plotted below the candlestick price chart for the same time period. The image also shows that every time there is a significant rise or decline in stock prices, the standard deviation line indicates steep ups and downs. The steep ups and downs of the standard deviation line indicate areas of high volatility. A more or less constant standard deviation, as the image indicates, reflects stock price action that is stable.
What are the advantages of Standard Deviation?
There are primarily three main advantages to using the standard deviation. The advantages of using standard deviation in trading include its ability to be understood easily, its ability to be calculated easily, and its reliability. The three principal advantages of standard deviation are listed below.
- Ability to be understood and calculated easily
One of the main advantages of the standard deviation is that it can be easily understood. The standard deviation indicator is plotted as a single line below the price chart. Its ease of comprehension makes it one of the most widely used statistical measures in technical analysis. It is also calculated using a simple formula that can be used and understood by everyone. The step-by-step method of calculating standard deviation is easy to follow and produces accurate results when the steps are followed correctly.
- Ability to be used in all financial markets
Another main advantage of the standard deviation is that it can be used in all financial markets, from the stock and bond markets to commodities and forex. Investors and traders must, however, keep in mind that standard deviation values must be studied subjectively according to the market and asset in question. A standard deviation value that may be high for one asset or market may not be high for another asset or market.
- Reliability
Another main advantage of the standard deviation is that it is very reliable in indicating the volatility of assets and market. Investors and traders can use it to assess the risk associated with an asset or market before making decisions regarding trade entry and exit positions.
Other advantages of standard deviation include its ability to be used for different time frames, and its ability to work well with other technical indicators such as Moving Averages, Relative Strength Index (RSI), Bollinger Bands, etc.
What are the disadvantages of the Standard Deviation?
There are primarily three main disadvantages to using the standard deviation. The disadvantages of standard deviation include its inability to predict upcoming market trends, its susceptibility to the influence of outliers, and its inability to reflect market dynamics. The three main disadvantages of standard deviation are listed below.
- Inability to predict upcoming market trends
One of the main disadvantages of standard deviation is that it cannot predict upcoming market trends. The Standard deviation can only indicate the volatility of the asset or market and the risk associated with it. The Standard deviation cannot tell traders about possible trend reversals.
- Susceptibility to the influence of outliers
The Standard deviation being a statistical measure that summates the variation of each point in the data set from the mean value, is susceptible to outliers. Outliers are data points that are found far away from the rest of the data set. Outliers are caused by errors in data, and they can significantly impact the accuracy of the standard deviation.
- Inability to reflect market dynamics
Another limitation of the standard deviation is its ability to reflect market dynamics. Market dynamics are the forces that influence the behaviour of traders. The Standard deviation is a primarily statistical measure that does not take into account factors such as market sentiment or changes to market structure.
Another disadvantage of standard deviation is that the interpretation of its values is subjective, and it is not possible for investors and traders to have a clear-cut rule while using it. A standard deviation that is high for one trader, market, or asset may be low for another trader, market, or asset.
Does Standard Deviation determine trade entrance and exit points?
Investors and traders can use the standard deviation to determine trade entrance and exit points. It is, however, not advisable to use the standard deviation in isolation to determine entry and exit points. The Standard deviation only indicates the volatility of the asset or market, and investors and traders must use other technical indicators before determining trading positions that are in accordance with their trading strategies. A short-term trader may, for instance, want to enter a trade when the standard deviation is high and make a quick trade. The use of other technical indicators like the RSI or Bollinger Bands can validate the results of the standard deviation before decisions are made.
Does the Standard Deviation predict market price movement?
The Standard deviation does not directly predict market price movement. The Standard deviation measures market volatility. High market volatility is commonly followed by a price movement and trend reversal. The Standard deviation, however, does not reflect the direction of the upcoming trend.


 Previous Article


![15 Investing.com Alternatives [Free+Paid] You Should Use in 2026](https://www.strike.money/wp-content/uploads/2026/04/Investing.com-Alternatives.jpg "15 Investing.com Alternatives [Free+Paid] You Should Use in 2026 88")
![15 TradeStation Alternatives [Free+Paid] You Should Use in 2026](https://www.strike.money/wp-content/uploads/2026/04/TradeStation-Alternatives.jpg "15 TradeStation Alternatives [Free+Paid] You Should Use in 2026 89")
![15 Chartink Alternatives [Free+Paid] You Should Use in 2026](https://www.strike.money/wp-content/uploads/2026/04/Chartlink-Alternatives.jpg "15 Chartink Alternatives [Free+Paid] You Should Use in 2026 90")
: Overview, 10 Types of Indicators, Settings for Different Markets 92")

 : Definition, Formula, calculation, Uses, Advantages Vs limitations 94")


: How We Used This 70/30 Indicator in 6 High Win-rate Strategies 98")


No Comments Yet.