On-neck pattern is a bearish continuation candlestick setup that signals sellers remain dominant despite a small bullish attempt. On-neck pattern forms during downtrends and indicates that the market is more likely to extend losses than reverse.
It is defined by two candles—a long bearish candle followed by a small bullish one that closes near the prior low. With a reliability rate of around 50–56%, it is considered moderately useful, especially when combined with RSI, volume, moving averages, and support-resistance levels. Traders prefer using it as a confirmation tool rather than a standalone strategy.
As legendary trader Ed Seykota once said, “The trend is your friend until it bends.” This highlights why the On-neck works best when aligned with the broader trend, reinforcing bearish momentum instead of predicting reversals.
What is a On-neck pattern?
An on-neck pattern is a bearish continuation candlestick formation that shows sellers are still in control even after a short bullish attempt. An on-neck pattern usually forms during a downtrend and suggests that the market is likely to keep falling.
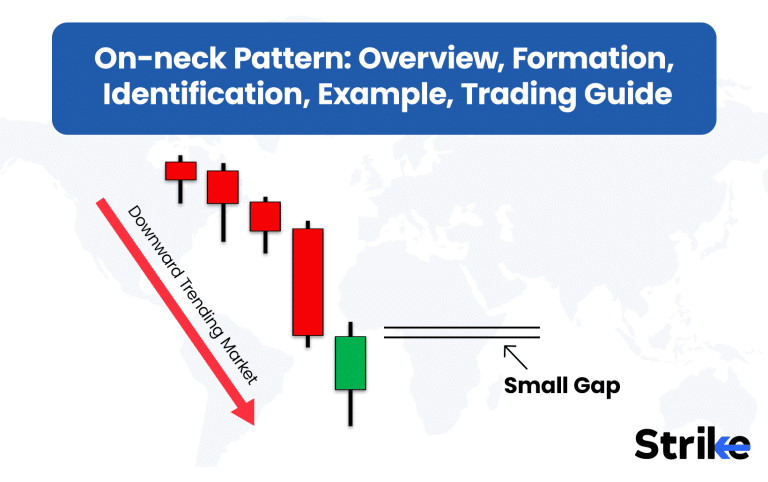
The pattern has two candles. The first candle is a long bearish one, showing strong selling pressure. The second candle is a small bullish one that opens lower but closes very close to the previous day’s low.
This close near the low creates the “on-neck” look, as if the second candle rests on the neckline of the first. The failure of the second candle to close higher shows that buyers do not have enough strength.
Traders use the On-neck pattern as a signal that the downtrend is not over yet. Studies, including those by Thomas Bulkowski, suggest its continuation success rate is around 56%, making it moderately reliable when used with other indicators.
How does On-neck pattern Candlestick Pattern Formed?
The on-neck pattern forms when a strong bearish candle is immediately followed by a small bullish candle that closes near the previous candle’s low. This sequence highlights weak buyer response within a downtrend.

- Day 1: A long red candle forms as sellers dominate and push prices sharply lower.
- Day 2: A small green candle opens below the prior close but manages to rise slightly, only to finish near the earlier low.
The psychology behind this is important. The first candle represents strong selling pressure, often triggered by negative news, weak earnings, or bearish market sentiment. The second candle shows that buyers tried to push back, but the attempt was too weak to reverse the trend.
This failure usually attracts more selling in the following sessions. For traders, it signals that the bearish move still has strength, and short positions are safer than anticipating a reversal.
When do On-neck pattern Candlestick Patterns occur?
On-neck patterns occur most effectively during established downtrends on daily or weekly charts. These timeframes reduce market noise and show clearer trend continuation signals.
On daily charts, the pattern is useful for swing traders who want to ride short- to medium-term moves. On weekly charts, it helps positional traders confirm that the larger bearish trend is intact.
Shorter timeframes like 15-minute or hourly charts sometimes show On-neck patterns, but they are less reliable. Intraday volatility and sudden news events distort the pattern, reducing accuracy to below 50%.
For better results, traders combine the On-neck pattern with tools such as below.
- Moving averages to confirm overall trend direction.
- RSI (Relative Strength Index) to ensure the market is not oversold.
- Volume analysis to confirm that sellers are active when the first bearish candle forms.
Traders improve the reliability of the On-neck pattern and avoid false signals by focusing on proper timeframes and using supporting indicators,
How to Identify a On-neck pattern
An On-neck pattern is identified within a downtrend when a long bearish candle is immediately followed by a small bullish candle that closes near the previous candle’s low. This structure confirms that the selling trend is intact despite a brief pause.

The previous trend must be clearly bearish. Prices should already be moving downward, showing lower highs and lower lows. Without this context, the pattern loses its meaning because it is designed as a continuation signal.
The candles and wicks provide the key details:
- The first candle is long, red, and shows strong selling momentum. Its open is near the high of the day, and its close is near the low.
- The second candle is small, green, and opens below the prior close. It manages to rise during the session but closes just at or slightly above the previous day’s low. The wick on the top is often short, showing limited upward push.
Confirmation comes in the following sessions. If prices fall below the low of the bullish candle on Day 2, the pattern is considered valid. Volume analysis adds weight to the signal—high selling volume on Day 1 and weak buying volume on Day 2 make the setup stronger.
What Does a On-neck pattern Pattern Indicate?
An On-neck pattern indicates that bearish pressure remains strong and the downtrend is likely to continue. It shows that buyers attempted a reversal but failed to change overall market sentiment.
The next movement expected after this pattern is further price decline. Traders interpret it as a signal to stay with short positions rather than expecting a rebound. The second candle’s inability to close higher highlights exhaustion among buyers.
In terms of buying and selling pressure, the first candle demonstrates panic selling or institutional unloading. The second candle represents weak buying, which quickly gets overpowered. Instead of shifting balance, the setup reinforces bearish control.
This pattern is not always highly reliable on its own, with studies showing a success rate of around 56%. However, when it appears with strong volume on the bearish candle and aligns with resistance or trend indicators, its significance improves.
For traders, the takeaway is straightforward—treat the On-neck as a continuation signal. Rather than trying to catch a reversal, it is safer to align with sellers and prepare for extended downside.
Example of On-neck pattern
Below is an example of On-neck pattern using IndusInd Bank stocks.

The setup begins with a strong bullish candle that shows clear buying strength. This is immediately followed by a bearish candle that opens with a gap up, giving the impression of further upward movement. However, the candle closes almost exactly at the high of the previous bullish candle. This inability of buyers to push higher signals exhaustion and creates the neckline, which is the defining feature of the On-neck formation.
In this example, the closing price of the second candle becomes the key reference point. Traders often treat this level as the potential entry price for long trades if the market manages to move above it with momentum. At the same time, a stop-loss is defined slightly below the low of the first bullish candle. This ensures risk control if the pattern fails and sellers take back control.
The chart also highlights how targets are determined. Based on a risk-to-reward approach, a higher level near ₹728 is identified as the exit objective. This offers a favorable balance, often two to three times the risk, making the trade setup attractive for disciplined traders. The pattern, therefore, is not just about recognizing two candles but about linking them to entry, stop-loss, and target planning.
How Reliable are On-neck pattern Candlestick Patterns?
On-neck candlestick patterns are only about 50% reliable as a continuation signal in downtrends, according to Thomas Bulkowski’s research. The structure shows a long bearish candle followed by a small bullish one that closes near the prior low, reflecting weak buying activity. While this indicates bearish control remains, the statistical edge is narrow.
A 2019 study published in the International Journal of Economics and Financial Issues analysed continuation candlestick setups and found On-neck patterns produced accurate bearish follow-through roughly half the time. The probability increased slightly when they formed during high-volume selling phases or within clear downtrends, but the effect was still modest.
Traders who rely on the On-neck pattern often use it as a supporting clue rather than a standalone trigger. Pairing it with momentum indicators like MACD or RSI, or with trend confirmation tools such as moving averages, strengthens its usefulness. For instance, if the pattern appears while RSI trends below 40 and prices remain under a declining 50-day average, the continuation signal holds more weight.
How to Trade Using the On-neck pattern Pattern
The On-neck pattern works best when you approach it step by step, from identification to exit, without treating it as a standalone signal.

- Identify a clear downtrend with consistent lower highs and lower lows.
- Look for the sequence of a long red candle followed by a small green candle that opens lower but closes almost exactly at the prior day’s low. This structure signals weak buying and continuation of selling pressure.
- Confirmation comes when the price action in the next session fails to push higher and instead slips below the neckline created by the second candle’s close.
- At this point, the probability of the downtrend extending increases. Traders often wait for this confirmation candle to close red before planning entries.
For example, consider Indiabulls Housing Finance in August 2023. The stock had been sliding steadily from ₹130 levels, and on 17th August, it printed a long bearish candle that closed near ₹118. The next session opened lower around ₹116 and formed a small green candle that closed almost at ₹118, creating a textbook On-neck structure. On 21st August, the stock confirmed the pattern with a close at ₹114, breaking below the neckline and validating the bearish continuation.
Entry in this case would be around ₹114–₹115, just after confirmation. A stop-loss would sit above the high of the green candle at ₹119. Price targets are generally set using recent support levels; here, the next visible support was near ₹105, which offered a reasonable risk-reward ratio of about 2:1. Exit could be taken partially at ₹108–₹110 and the rest at ₹105, locking in gains as the downtrend extended.
Risk management is essential because On-neck patterns do not deliver high success rates. Position sizing should limit exposure to 1–2% of capital. This ensures that even if the pattern fails and the stop-loss triggers, the loss remains manageable. By following identification, confirmation, disciplined entry, defined targets, and strict risk controls, the On-neck becomes a useful addition to a broader trading plan.
How to Combine On-neck pattern with other Technical Indicators?
The On-neck pattern delivers stronger results when it is confirmed through multiple technical indicators such as volume, RSI, moving averages, MACD, Bollinger Bands, support and resistance, and Fibonacci retracements.
| Indicator | Role with On-neck Pattern |
| Volume | Heavy volume on the bearish candle followed by lighter activity on the small bullish one highlights strong supply overwhelming weak demand. |
| RSI | RSI under 40 supports downside momentum; studies show oversold setups extend trends ~60% of the time. |
| Moving Averages (MA) | A falling 50-day or 200-day MA above the candles strengthens bearish context; rejection from these averages boosts conviction. |
| MACD | Negative histogram or bearish crossover validates selling pressure and adds a momentum filter. |
| Bollinger Bands | Pattern forming near the lower band with widening bands suggests volatility expansion and higher odds of continuation. |
| Support & Resistance | Formation below a previous support turned resistance often triggers selling as trapped buyers exit. |
| Fibonacci Levels | Neckline aligning with retracement levels like 38.2% or 50% increases the strength of breakdowns. |
The On-neck pattern works reliably only when cross-verified by multiple indicators. This multi-filter approach reduces noise, enhances accuracy, and provides traders with a structured execution plan.
What are the Pros vs Cons of Using On-neck pattern?
The On-neck pattern offers quick recognition in downtrends but suffers from limited reliability if used in isolation.
| Pros | Cons |
| Simple to identify with just two candles, reducing confusion for traders. | Success rate is modest, averaging around 50%, which limits confidence in trades. |
| Works as a continuation signal, aligning naturally with existing bearish momentum. | High risk of false signals, especially in sideways or low-volume markets. |
| Useful as a secondary confirmation when combined with volume, RSI, or moving averages. | Requires additional indicators for confirmation; alone it often lacks predictive strength. |
| Provides defined entry, stop-loss, and target levels, making trade planning straightforward. | Occurs frequently, which increases noise and makes filtering necessary. |
| Historically studied in technical analysis literature, offering statistical backing for use. | Less popular compared to stronger patterns like bearish engulfing or evening star, limiting trader confidence. |
The On-neck pattern works best as a supporting tool rather than a standalone strategy, improving accuracy when combined with other technical indicators.


 Previous Article


![15 Investing.com Alternatives [Free+Paid] You Should Use in 2026](https://www.strike.money/wp-content/uploads/2026/04/Investing.com-Alternatives.jpg "15 Investing.com Alternatives [Free+Paid] You Should Use in 2026 20")
![15 TradeStation Alternatives [Free+Paid] You Should Use in 2026](https://www.strike.money/wp-content/uploads/2026/04/TradeStation-Alternatives.jpg "15 TradeStation Alternatives [Free+Paid] You Should Use in 2026 21")
![15 Chartink Alternatives [Free+Paid] You Should Use in 2026](https://www.strike.money/wp-content/uploads/2026/04/Chartlink-Alternatives.jpg "15 Chartink Alternatives [Free+Paid] You Should Use in 2026 22")
: Overview, 10 Types of Indicators, Settings for Different Markets 24")

 : Definition, Formula, calculation, Uses, Advantages Vs limitations 26")


: How We Used This 70/30 Indicator in 6 High Win-rate Strategies 29")


No Comments Yet.