A Pin Bar is one of the candlestick patterns in technical analysis. A Pin Bar reflects a sharp rejection of price levels, often signaling potential reversals or continuations depending on the context.
Traders consider pin bars valuable because they provide clear insights into market psychology. They show where buyers or sellers lost control, and the other side gained momentum. This makes pin bars a favorite tool in price action trading.
Understanding the pin bar pattern involves studying its definition, formation process, and key market psychology. Once identified, traders use confirmations, such as trend direction or volume, before entering trades.
What is a Pin Bar?
A Pin Bar is a candlestick with a long tail (wick) and a small body that signals a rejection of price. The longer the tail, the stronger the signal, as it shows price tested a level but failed to sustain it.

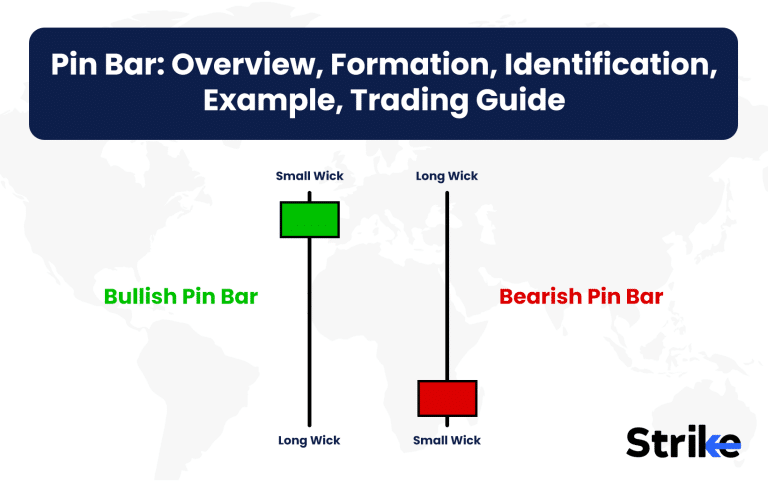
The structure includes a wick that makes up at least two-thirds of the candlestick’s total length. The small body stays close to one end of the candle. A bullish pin bar has a long lower wick and closes near the top, while a bearish pin bar has a long upper wick and closes near the bottom.
Pin bars represent a battle between buyers and sellers. The wick indicates where price attempted to move but was forcefully rejected. This rejection often points to a reversal or pause in the current trend.
How is the Pin Bar Candlestick Pattern Formed?
A Pin Bar forms when price tests a level, rejects it strongly, and closes near the opposite side of the candlestick. This formation shows aggressive rejection of higher or lower prices within a single session.
The psychology behind the pin bar explains market behavior. For instance, a bullish pin bar starts with sellers pushing the price lower. Buyers then regain control and push the price back up, leaving a long lower wick. This shows strong buying interest at lower levels.
Similarly, in a bearish pin bar, buyers initially drive the price higher. Sellers then overpower them, forcing the close near the bottom with a long upper wick. This shows sellers rejecting higher prices.
The longer the wick relative to the body, the stronger the message. A body that makes up less than 25% of the candle size is ideal for pin bar setups.
This rejection process highlights imbalance. Traders use this signal as an entry point when combined with broader market structure. For example, a bullish pin bar at a demand zone often aligns with institutional buying.
When do Pin Bar Candlestick Patterns occur?
Pin Bar patterns occur most effectively at key support, resistance, and trend reversal zones. These levels highlight where price is tested and rejected, creating high-probability trading opportunities.
On daily and weekly timeframes, pin bars are particularly reliable. A 2022 trading survey showed that pin bars on higher timeframes resulted in 65% more profitable setups compared to intraday ones. This is because daily and weekly candles include more data, making them less prone to noise.
Pin bars also occur during news events or high volatility sessions. For instance, in forex, Non-Farm Payroll (NFP) announcements often lead to pin bars as price rejects extreme levels quickly.
In trending markets, pin bars occur as continuation signals. A bullish pin bar within an uptrend suggests strong demand, while a bearish pin bar in a downtrend confirms selling pressure.
While pin bars appear in all timeframes, traders prefer 4-hour, daily, and weekly charts for consistency. Shorter timeframes create false signals due to market noise.
Therefore, identifying the context of a pin bar is critical. A pin bar in the middle of a choppy range holds little value, but the same pattern near a trendline or resistance zone is highly effective.
How to Identify a Pin Bar
A Pin Bar is identified by its long wick, small body, and occurrence after a trend. Without these elements, the candlestick is not classified as a true pin bar.
The main steps to identify are below.
- Check the previous trend: A bullish pin bar after a downtrend is a strong reversal signal. A bearish pin bar after an uptrend signals rejection of higher prices.
- Observe candle structure: The wick should make up at least 65%–70% of the candle length. The body should remain small and near one end.
- Look for confirmation: Additional signals such as volume spikes, support/resistance levels, or moving average alignments confirm the pin bar’s strength.
The wick direction tells the story. A long lower wick shows buyers rejecting lower prices, while a long upper wick shows sellers rejecting higher levels.
For example, a bullish pin bar with a large volume spike near 200-day moving average increases reliability.

Likewise, a bearish pin bar near Fibonacci resistance strengthens the case for a sell trade.

Identification goes beyond shape—it includes context. Without prior trend or key level rejection, the candlestick loses effectiveness.
By following this structured method, traders filter out false signals and focus on high-quality pin bar setups.
What Does a Pin Bar Pattern Indicate?
A Pin Bar pattern indicates a potential reversal or continuation depending on its location. The direction of the wick and close signals whether buyers or sellers dominate.
A bullish pin bar signals strong buying pressure. The long lower wick shows that sellers tried to push the price down but failed, as buyers stepped in aggressively. Conversely, a bearish pin bar indicates strong selling pressure. The long upper wick shows that buyers lost control, and sellers dominated the session.
Pin bars near resistance zones indicate price rejection from higher levels, suggesting downward momentum. At support zones, pin bars indicate rejection of lower levels, suggesting upward momentum.
Traders often view pin bars as “footprints” of institutional activity. Large players use liquidity at certain levels, causing sharp reversals reflected in the wick.
For example, in forex, a bullish pin bar at 1.2000 level in EUR/USD signals large buying interest. Similarly, a bearish pin bar at 18,500 in NIFTY suggests strong supply at that zone.
The implication of a pin bar depends on trend alignment. In uptrends, bullish pin bars confirm continuation, while in downtrends, bearish pin bars confirm selling strength.
Thus, pin bars indicate the next likely market movement through price rejection and pressure dominance.
Example of Pin Bar
An example of a Pin Bar is seen in Reliance Industries stock on the NSE in July 2022. After a strong rally, the price tested resistance near Rs. 2,800 and formed a clear bearish pin bar.

The candle showed a long upper wick with a small body near the low. This indicated buyers tried to push price higher but failed, as sellers gained control. Following this pin bar, Reliance fell nearly 6% over the next two weeks.
This case highlights how pin bars often emerge at psychological round numbers and significant resistance points.
For traders who combined the signal with volume analysis or moving averages, the bearish rejection became even more convincing. The move also underlines the importance of context, as the pin bar appeared after a sustained rally, making the probability of reversal stronger.
How Reliable are Pin Bar Candlestick Patterns?
Pin Bars are moderately reliable but not foolproof, with success rates around 55%–65% depending on context. Reliability improves when combined with confirmation tools such as support zones or volume.
A study by Thomas Bulkowski, a leading candlestick researcher, found that reversal candlestick patterns including pin bars worked about 60% of the time on daily charts. The reliability increased on weekly charts where false signals reduced.
However, pin bars in isolation are risky. Without a supporting trend or confirmation, they often fail. For instance, a bullish pin bar in a strong downtrend without support nearby has a low success rate.
How to Trade Using the Pin Bar Pattern
Trading a Pin Bar involves five steps: identification, confirmation, entry, stop loss, and exit. Following a structured process ensures disciplined and consistent trades.
Identification – Pin bar shape with context. Spot a bullish pin bar with a long lower wick and a small body near the top. Use the NIFTY example near 19,000 where price rejects lows and closes strong.

Confirmation – Align with structure and participation. Check support at the round number 19,000, trend bias turning up, and a volume pop relative to the prior three sessions. Treat an MA such as 50‑period as a dynamic support if price sits above it.
Entry – Trigger with precision. Take an entry near 19,050 either on close of the pin bar or on a mild intraday retest of the body area. Avoid chasing far above the close to preserve reward‑to‑risk.
Mark the entry as a horizontal line on Chart 1 for quick reference.
Stop Loss – Protect the idea, not the ego. Park the stop just beyond the wick low at 18,850 for this setup. This placement keeps the thesis intact only while the rejection holds.
Exit and Risk Management – Target, scale, and review. Set a first target at 19,400 for a reward of 350 points versus 200 points of risk, which yields R:R ≈ 1:1.75. Risk 1%–2% of equity per trade and size position using the formula Position size = Risk capital ÷ Stop distance.

A disciplined pin bar strategy with clear entry, stop, and target levels helps traders capture high-probability setups while keeping risk tightly controlled.
How to Combine Pin Bar with other Technical Indicators?
Pin Bars are more powerful when combined with volume, RSI, moving averages, and support/resistance. These tools confirm the strength of the rejection shown in the pin bar.
- Volume: A bullish pin bar with high volume at support confirms strong buying interest. A bearish pin bar with high volume at resistance confirms selling strength.
- RSI: When RSI shows oversold levels along with a bullish pin bar, reversal chances increase. Similarly, an overbought RSI with a bearish pin bar strengthens the case for downside.
- Moving Averages (MA): Pin bars near the 50-day or 200-day MA act as strong signals. A bullish pin bar bouncing off 200-day MA is highly reliable.
- Support and Resistance: Pin bars at key levels such as previous highs, lows, or Fibonacci retracements are more meaningful.
For example, in Tata Motors, a bullish pin bar near 400-day MA with RSI oversold led to a strong reversal. In forex, GBP/USD formed a bearish pin bar at resistance with RSI overbought, leading to a 300-pip fall.
Combining pin bars with other indicators reduces false signals and increases probability of success. Traders use this multi-confirmation method as part of a structured price action system.
What are the Pros vs Cons of Using Pin Bar?
Pin Bars offer quick, visual reversal or continuation signals, but reliability stays context‑dependent and needs confirmation. They work best near key levels with clear trend alignment and strict risk rules.
Backtests and practitioner studies place standalone win rates near 55%–65% on daily charts. Higher timeframes reduce noise yet still demand confluence for quality trades.
| Pros | Why it helps | Cons | Mitigation |
| Clear market psychology | Long wick shows strong rejection and intent | False positives in ranges | Trade only near defined support or resistance and active trend |
| Simple visual identification | One candle communicates the story fast | Subjective shape judgments | Enforce rules: wick ≥ 66% of candle, body ≤ 25% and close at one end |
| Works across assets and timeframes | Stocks, forex, crypto, and commodities respond to rejection | Lower reliability on very low timeframes due to noise | Prefer H4, Daily, or Weekly and demand level confluence |
| Attractive reward‑to‑risk setups | Wick‑based stops define invalidation cleanly | Wider stops increase position risk | Size by fixed risk percent and aim for ≥1:2 R:R |
| Early entry at turns | Signals appear soon after rejection | News spikes create traps and slippage | Avoid scheduled events or wait for candle close plus volume confirmation |
| Pairs well with tools | Volume, RSI, MAs, and S/R improve odds | Frequent appearances tempt overtrading | Require two confirmations and cap daily trades |
Use a checklist to standardize entries and exits. Treat the pin bar as a trigger supported by structure, not the entire thesis.


 Previous Article


![15 Investing.com Alternatives [Free+Paid] You Should Use in 2026](https://www.strike.money/wp-content/uploads/2026/04/Investing.com-Alternatives.jpg "15 Investing.com Alternatives [Free+Paid] You Should Use in 2026 28")
![15 TradeStation Alternatives [Free+Paid] You Should Use in 2026](https://www.strike.money/wp-content/uploads/2026/04/TradeStation-Alternatives.jpg "15 TradeStation Alternatives [Free+Paid] You Should Use in 2026 29")
![15 Chartink Alternatives [Free+Paid] You Should Use in 2026](https://www.strike.money/wp-content/uploads/2026/04/Chartlink-Alternatives.jpg "15 Chartink Alternatives [Free+Paid] You Should Use in 2026 30")
: Overview, 10 Types of Indicators, Settings for Different Markets 31")


 : Definition, Formula, calculation, Uses, Advantages Vs limitations 34")


No Comments Yet.