The Chaikin Oscillator is a popular technical analysis indicator that traders and investors use to measure the accumulation and distribution of moving average convergence-divergence (MACD). The Chaikin Oscillator combines volume and moving averages to measure the accumulation and distribution of money flow within a security. The Chaikin Oscillator sheds light on the degree of buying and selling pressure by analyzing the relationship between the short- and long-term moving averages of the Accumulation/Distribution Line (ADL).
The Chaikin Oscillator must be calculated in a number of steps.
1. The ADL is first calculated while accounting for the correlation between the closing price, high, low, and volume for each period.
2. The ADL’s shorter-term and longer-term exponential moving averages (EMA) are then calculated.
3. The Chaikin Oscillator is finally obtained by deducting the longer-term EMA from the shorter-term EMA.
The Chaikin Oscillator is one tool used by traders to produce trading indications.
A bullish signal is produced when the oscillator crosses above the zero line and indicates that there is more buying pressure.
A bearish signal is generated when the oscillator crosses below the zero line, indicating increasing selling pressure. Traders watch for divergences between the oscillator and price chart to spot probable trend reversals in the market.
The Chaikin Oscillator aids traders in a number of ways. It helps traders identify phases of equilibrium between buying or selling pressure ,it assists in the detection of probable trend reversals and confirming current trends. The oscillator is ideal for a variety of trading methods, including intraday trading and longer-term investing, and is used over a range of timescales.
The Chaikin Oscillator has certain drawbacks, though. It is not perfect and has the potential to provide misleading indications , just like other technical indicators. It also lags behind price changes, particularly in instances of volatile markets, rapid market activity or sudden reversals. In sideways or range-bound markets, when distinct trends are missing, the oscillator’s efficiency is diminished. Thus traders must experiment and undertake multiple time frame analysis, use other indicators to develop a suitable trading plan.
What is a Chaikin Oscillator?
Chaikin Oscillator is a technical analysis indicator used by traders to evaluate the concentration and distribution of money flow in a security. Chaikin Oscillator combines volume and moving averages to provide insights on the buying and selling pressure.

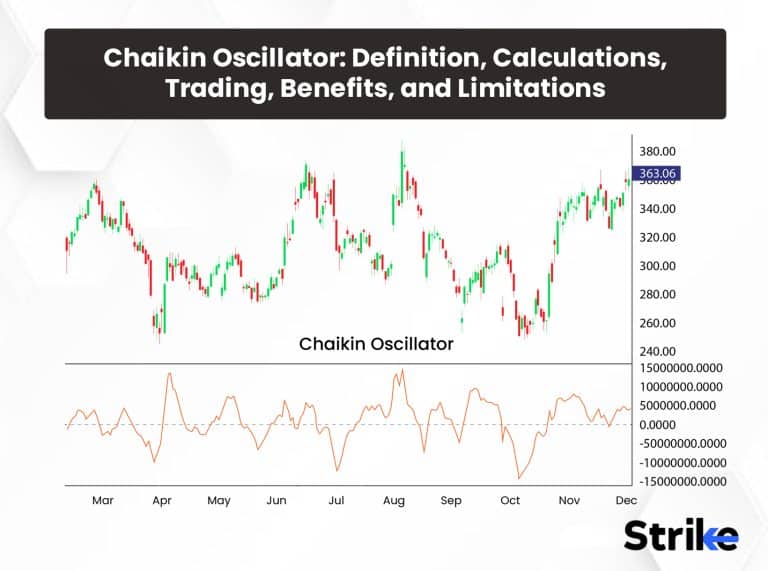
An increase in buying pressure is indicated by a bullish signal when the oscillator crosses over the zero line. It indicates increasing selling pressure when the oscillator crosses below the zero line. Identifying trade setups, spotting trading opportunities, and validating trends are all possible with the Chaikin Oscillator. The chart uploaded below is a Daily time frame chart of Nifty50 on which the indicator is applied. The red line is the Chaikin line and the dotted line is the zero line.
Who created the Chaikin Oscillator?
American stock market trader and analyst Marc Chaikin created the Chaikin Oscillator. He created the oscillator as a technical analysis tool to evaluate the accumulation and distribution of money flow in a security. The Chaikin Oscillator combines volume and moving averages in order to produce trading signals and aid in the detection of probable trend reversals.
The Chaikin Oscillator has grown in popularity as a trustworthy indicator in technical analysis. Besides the Chaikin Oscillator, the creator has also contributed significantly to the field of stock market analysis by developing multiple indicators that are still effectively used by the market makers/traders/investors.
How does a Chaikin Oscillator work?
The Chaikin Oscillator works by combining volume and moving averages to analyze the accumulation and distribution of money flow in security. Here’s a step-by-step explanation of how it functions:

The relationship between the closing price, high, low, and volume of the securities is taken into consideration while calculating the ADL for each period.
ADL = [(Close – Low) – (High – Close)] / (High – Low) * Volume
The longer-term EMA is determined over a second set period, usually 10 or 20 days, while the shorter-term EMA is calculated over a specific period (often 3 or 10 days). Exponential moving averages are more responsive to recent price changes because they give greater weight to current data.
The Chaikin Oscillator is obtained by subtracting the longer-term EMA from the shorter-term EMA.
Chaikin Oscillator = Shorter-term EMA – Longer-term EMA
The Chaikin Oscillator moves around the zero line, providing information about market sentiments.
The Chaikin Oscillator is also used by traders to produce trading signals, such as buying or selling when the oscillator crosses above or below the zero line. Indicators of impending trend reversals are also seen in divergences between the oscillator and the price chart.
How important is the Chaikin Oscillator in Technical Analysis?
The Chaikin Oscillator is regarded as a crucial instrument in technical analysis. Despite the fact that no single indication can ensure successful market forecasts, the Chaikin Oscillator has four major important advantages that make it useful for traders.
By crossing above or below the zero line, the oscillator can identify potential trend reversals. A probable bullish reversal and increased buying pressure are indicated when the oscillator crosses above zero whereas when it crosses below zero, it denotes increasing selling pressure and a possible bearish reversal. These signals become helpful to traders during formulation of a suitable trading plan.
The Chaikin Oscillator is used to reaffirm the viability and strength of current trends. The oscillator confirms that the trend is backed by volume and money flow if it moves in the same direction as the price trend (e.g., positive values during an uptrend, negative values during a downtrend). This affirmation boosts traders’ decision-making confidence.
The Chaikin Oscillator takes into account how price and volume are related by considering volume data obtained from the ADL. Grasp market dynamics require a grasp of volume, and adding volume to the oscillator makes trading signals more reliable.
The Chaikin Oscillator is useful for every style of trading, from intraday trading to long term investing. Though, in today’s era of markets, manipulation is at peak, thus, additional confirmations from other indicators and tools are supposed to be considered before placing trades.
It’s crucial to understand that the Chaikin Oscillator has limitations, just like any other technical indicator. In volatile or choppy in particular, it can produce misleading signals. It also takes a while to react to abrupt market changes, which would lessen its usefulness in chaotic or volatile situations. Taking interpretations from the Chaikin Oscillator and combining the signals and confluences from multiple time frame analysis, study of price action and signals from other indicators and tools can be gathered to postulate a suitable trading plan to place high probability trades.
What is the main purpose of the Chaikin Oscillator?
The main purpose of the Chaikin Oscillator is to provide insights regarding the accumulation and distribution phase of securities.
It aims to help traders and investors identify potential buying and selling opportunities in the market.
The three primary uses of the Chaikin Oscillator are the oscillator’s bouncing from 0 line or crossing the 0 line indicates potential market reversals. Extreme oscillator readings might point to overbought or oversold circumstances, pointing to potential price corrections, the oscillator can verify a price trend’s strength. Oscillator values that are rising during an uptrend or falling during a downturn confirm the direction of the price movement.
Traders can choose better entry, exit, and position management strategies by being aware of a security’s accumulation and distribution characteristics.
What is the Formula of the Chaikin Oscillator?
The formula for the Chaikin Oscillator involves three steps in the calculation process, as mentioned below.
1. Calculate Accumulation/Distribution Line:
ADL = Previous ADL + [(Close – Low) – (High – Close)] / (High – Low) * Volume
2. Evaluate the ADL average for a specified period (3 or 10 days):
ADL Average = Simple Moving Average (ADL, Period)
3. Estimate the Chaikin Oscillator by subtracting the longer-term ADL average from the shorter-term ADL average:
Chaikin Oscillator = Shorter-term ADL Average – Longer-term ADL Average
If you choose, for example, a 3-day ADL average and a 10-day ADL average, the formula would be:
Chaikin Oscillator = Simple Moving Average (ADL, 3) – Simple Moving Average (ADL, 10)
The resulting value is the Chaikin Oscillator, a tool for spotting market buying and selling opportunities.
What are the key inputs used in the Calculation of the Chaikin Oscillator?
The main purpose of the Chaikin Oscillator is to track a security’s distribution or accumulation. The following are the three steps involved in computing the Chaikin Oscillator.
1. The ADL is determined by adding or subtracting the volume of security depending on whether the closing price is higher or lower than the previous day’s closing price. It increases in volume over a set period of time.
2. Compute a moving average over a specified time period, often 3 or 10 days (oftenly used as default setting), to smooth the ADL. Take the longer-term ADL average and subtract the shorter-term ADL average.
3. The most frequent combination is the subtraction of a 3-day ADL average from a 10-day ADL average.
The resulting Chaikin Oscillator values are used to identify probable buy or sell signals based on the correlation between the oscillator line and the zero line.
How to Calculate the Chaikin Oscillator?
The process of calculation for the Chaikin Oscillator involves the following five steps. The details about each of these steps are listed below.
- Collect the required information: The stock or asset you want to analyze for daily closing prices and accompanying volumes should be gathered.
- Determine the Money Flow Multiplier (MFM): Multiply the normal price (the average of the high, low, and closing prices) by the corresponding volume to find the Money Flow (MF) for each day. Determine the Raw Money Flow (RMF) by adding the MF values for the given period.
- Make the Accumulation/Distribution Line (ADL) calculation: Initialize the ADL with a starting value of 0. Add the RMF value to the ADL for the day if the closing price is higher than the closing price from the prior day. Consider the RMF value in the event that the closing price is lower.
- Using exponential moving averages (EMA), smooth the ADL: Pick two time frames, usually a shorter time frame (like 3 days) and a longer time frame (like 10 days). Calculate the EMA for the shorter time using the ADL value for the current day and the EMA value from the previous day. Follow the same procedure the following day.
- Determine the Chaikin Oscillator’s value: Subtract the shorter-period EMA from the longer-period EMA (step 4). The Chaikin Oscillator is the value that results.
The Chaikin Oscillator is precisely calculated by adhering to these procedures, which are used to evaluate the momentum and buying/selling pressure in a stock or asset.
The calculation part stays a theoretical and mathematical concept as the indicator is available for free across all the popular charting platforms like tradingview, Strike.money etc.
How to use a Chaikin Oscillator in Trading?
These seven key steps and methods should be followed to effectively use the Chaikin Oscillator in trading.

Recognise how oscillator values are interpreted.
If the Chaikin Oscillator is in the positive territory, it indicates buying pressure whereas if the oscillator is in the negative territory, it indicates selling pressure. The values of the oscillator oscillate around the 0 levels. The crossover above and below the zero line suggests probable uptrend (buy signals) or downtrend (sell signals), respectively.
Use other technical indicators or chart patterns to support the trend. Watch for price breakouts above, to increase the accuracy of signals, or below support levels that coincide with Chaikin Oscillator crossings.
Keep an eye out for divergences between the stock price and the Chaikin Oscillator. This is a hint of a likely upward trend reversal and is known as a bullish divergence when the price makes lower lows while the oscillator makes higher lows. This is a sign of a likely downward trend reversal and is known as a bearish divergence when the oscillator sets lower highs while the price makes higher highs. The chart uploaded below is Daily time frame chart of Nifty50. The red indicator is the Chaikin Oscillator.
Look how the positive divergence occurred between the price and the indicator and later on, a double bottom on indicator got created suggesting the red line won’t pass the support on the indicator shown by a small horizontal blue line. After some days, The line crossed the 0 and went into the positive zone, simultaneously a bullish candlestick appeared on the charts suggesting possibilities of uptrend. This is how the indicator can be utilized to generate trading opportunities.
The Chaikin Oscillator can be applied on all the time frames, from lower time frames like 15 m – 1 h to higher time frames like daily and weekly. The indicator works better on a higher time frame.
Implement proper risk management techniques, such as setting stop-loss orders or trailing stops, to protect against potential losses. This ensures that you have predefined exit points in case the trade does not perform as anticipated.
The Chaikin Oscillator should be used in conjunction with multiple time frame analysis, study of price action, other technical indicators, chart patterns, and fundamental analysis in order to make informed trading decisions. Its usefulness can vary depending on market conditions. Review and improve your trading plan on a regular basis using data from the market and your own expertise.
How can the Chaikin Oscillator identify stock price trends and reversals?
The Chaikin Oscillator analyzes the momentum and accumulation/distribution of a stock to assist traders spot stock price trends and reversals. The Chaikin Oscillator signals that the stock is in an uptrend and offers buying pressure when it is positive. Positive numbers during this phase signal a bullish mood and probable price movement, so traders can seek opportunities to enter long positions or hold existing holdings. A negative oscillator implies selling pressure and a downward trend.

Traders think about taking short positions or tightening stop-loss orders because negative numbers represent bearish emotion and likely price movement downward. The chart uploaded below is an example of how the Chaikin Oscillator provided a shorting opportunity when the oscillator failed to sustain in the positive zone, it finally slipped below the 0 to suggest continuation of a downward.
The Chaikin Oscillator is used in concert with other technical analysis instruments to spot reversals. Divergences between price and oscillator suggests early warning signs of possibilities of change in the momentum shifts and trend change. A fading positive trend and a potential reversal to the downside could be indicated, for instance, if the oscillator is making lower highs while the stock price is making higher highs (bearish divergence). A bullish divergence (which occurs when the oscillator’s lows are higher than the stock price’s lows) indicates that the bearish trend is waning and that there is a chance it will reverse to the upside.
The validation of these signals by additional indicators, chart patterns, or fundamental research should also be taken into account by traders. The Chaikin Oscillator provides additional evidence of future trend changes or reversals when combined with multiple time frame analysis, price action study and other indicators such as moving averages, trendlines, or support/resistance levels.
The Chaikin Oscillator is a useful indicator for spotting stock price trends and potential reversals overall. Traders obtain insights into the current market sentiment and make wise trading decisions by evaluating its readings in combination with other technical indicators and taking the market environment into account.
How can traders use the Chaikin Oscillator most effectively?
Traders mainly utilize the Chaikin oscillator to spot potential trend reversals and trading signals. The Chaikin Oscillator crosses above the zero line signals accumulating momentum and possible uptrend initiation. This may present buying opportunities for traders depending on other confirmations. Conversely, crossing below the zero line indicates increasing distribution and possible start of a downtrend. Traders use this to close out long positions and adopt bearish stances.
Divergences between the Chaikin Oscillator and price indicate diminishing momentum, making it a highly effective Intraday Trading Indicator for identifying potential trend reversals. Traders focus on such divergences as advanced warning of potential trend weaknesses. The flexibility of this Intraday Trading Indicator on both short and long timeframes makes it an adaptable tool for intraday traders, swing traders, and investors alike when used prudently along with other signals. The chart uploaded below is a Daily time frame chart of Auropharma.

A bullish divergence is observed and an additional indicator known as bollinger bands are applied on the chart, to get a solidified perspective about the future movement. The bullish divergence plus the support from lower band acts as confluence to postulate a trading plan to place a long position. The Chaikin Oscillator provided a long opportunity again when the red line retraced at the 0 level to continue upside.
What are the best Chaikin Oscillator trading strategies?
Chaikin Oscillator is widely used by traders and analysts for technical analysis, and because of which traders use it to develop strategies for getting maximum benefits. Below is a list of five widely used strategies associated with the Chaikin Oscillator.
- Zero-line crossover strategy: This strategy focuses on the crossovers of the Chaikin Oscillator with the zero line. It indicates a bullish signal, suggesting buying opportunities when the oscillator crosses above the zero line. It suggests a bearish signal and potential selling opportunities when it crosses below the zero line. An example is attached below.

- Divergence strategy: Price action and Chaikin Oscillator divergences offer profitable trading indications. A bearish divergence, which suggests a probable trend reversal, is present when the oscillator is making lower highs while the price is reaching higher highs. A bullish divergence signals a probable trend reversal to the upside if the oscillator is making higher lows while the price is making lower lows. An example is attached below.

- Overbought/oversold conditions: Use the Chaikin Oscillator to spot overbought and oversold market circumstances. The oscillator indicates overbought conditions and a potential reversal or stops in the rally when it hits extraordinarily high positive readings. The oscillator indicates oversold circumstances similar to this, and a potential reversal or pause in the decline when it reaches exceptionally low negative values.
- Moving average crossover strategy: Traders often use moving averages crossover in conjunction with the Chaikin Oscillator. A popular approach is to use a short-term (e.g., 3-day) and a long-term (e.g., 10-day) exponential moving average of the oscillator. It generates a bullish signal, indicating a potential buying opportunity when the short-term EMA crosses above the long-term EMA. It indicates a potential selling opportunity when the short-term EMA crosses below the long-term EMA and generates a bearish signal. An example is attached below.

- Confirmation with other indicators: The Chaikin Oscillator is used in conjunction with other technical indicators to confirm trading signals and increase the likelihood that trades will be profitable, such as trendlines, support/resistance levels, or other oscillators.
It’s important to test and modify trading techniques to suit your trading style, risk tolerance, and market conditions because no trading strategy is a failsafe. It is essential to use appropriate risk management strategies while using the Chaikin Oscillator or any trading method, including placing stop-loss orders and controlling position sizes.
How does the Chaikin Oscillator work with other Indicators?
The Chaikin Oscillator substantially improves market research and produces trading signals that are more trustworthy when combined with other technical indicators. It is used mostly with these four indicators mentioned below in the following ways.
1. Moving Averages: Moving averages are used in conjunction with the Chaikin Oscillator to amplify signals. Trades are on the lookout for Chaikin Oscillator crossovers above the zero line that also occur at the same time as a bullish crossover of the short- and long-term moving averages. This combination lessens the possibility of misleading signals and adds confirmation to probable buy signals. An example is attached below.

2. Relative Strength Index (RSI): This momentum indicator, which gauges overbought and oversold levels, is quite popular. The Chaikin Oscillator and RSI together can offer additional proof of price reversals. A possible purchase signal is strengthened if the Chaikin Oscillator creates a bullish divergence while the RSI is in an oversold condition.
3. Moving Average Convergence Divergence (MACD): The MACD is another widely used moving average-based trend-following indicator. A thorough understanding of market trends obtained by combining the Chaikin Oscillator and MACD. The trend is strengthened and the signal’s dependability is increased when a bullish or bearish crossover is produced by the MACD and the Chaikin Oscillator confirms the same direction. An example is attached below. Look how the MACD lines gave a bullish crossover and at the same time the Chaikin Oscillator also moved in the positive zone to suggest a trend towards upside.

4. Volume-based Indicators: The Chaikin Oscillator is used effectively in conjunction with other volume-based indicators because it is derived from volume data. Traders combine the Chaikin Oscillator and the On-Balance-Volume (OBV) indicator. The signal is stronger, and more confidence is offered if the Chaikin Oscillator’s direction is supported by the OBV.
The Chaikin Oscillator is combined with other indicators to provide traders access to the synergy of many tools. It contributes to the validation of signals, the reduction of false alarms, and a deeper comprehension of market dynamics. It’s crucial to remember that no indicator combination is failsafe; therefore, traders should practice responsible risk management and take other market factors into account when making decisions.
Can a Chaikin Oscillator work well with the Relative Strength Index (RSI)?
Yes, the Chaikin Oscillator and the Relative Strength Index (RSI) can operate well together because they are complementing technical indicators that offer various viewpoints on market circumstances. The Chaikin Oscillator measures buying and selling pressure, while the RSI monitors the pace and change of market movements. Traders can develop a more thorough grasp of the market by combining them.
The dependability of the signals is increased when the Chaikin Oscillator and RSI confirm each other’s signals. A stronger buy or long signal would be indicated if the Chaikin Oscillator showed a bullish crossover above the zero line while the RSI showed an oversold position below 30. It is a sign of a divergence or a deteriorating trend when both indicators give conflicting indications.

An example is attached above. Multiple confluences are gathered from RSI, Price and the Chaikin oscillator to confirm a trade. This way traders validate trend strength, spot probable reversals, and improve the accuracy of their trading decisions by combining the Chaikin Oscillator and RSI. Prior to making trading decisions, it’s crucial to take other elements into account, use effective risk management, and undertake an in-depth study.
Can a Chaikin Oscillator work in combination with the Moving Average (MA)?
Yes, the Chaikin Oscillator can indeed be used in conjunction with Moving Averages (MA) as a component of a thorough technical analysis strategy. The three pieces of evidence for this are trend confirmation, crossings with Moving Averages, and divergence Confirmation.
What are the Benefits of the Chaikin Oscillator?
The Chaikin Oscillator offers five potential benefits for traders and analysts that help them make efficient trading decisions.
1. Determining the strength of buying and selling pressure: The Chaikin Oscillator aids in this process. Positive levels represent pressure to buy, while negative values represent pressure to sell.
2. Producing trade signals: The Chaikin Oscillator can provide trading signals using crosses above or below the zero line. Crossovers are viewed as potential long signals when they occur above the zero line and as potential sell/short signals when they occur below it.
3. Verifying price patterns: The strength of price trends are verified using the Chaikin Oscillator. The oscillator adds to the legitimacy of the price trend when it moves in the same direction as the trend. This confirmation can lessen erroneous signals and assist traders in making more educated judgements.
4. Discover Divergences: The Chaikin Oscillator can discover divergences between oscillator and price trend movements. Divergences happen when the oscillator moves counter to how the price is moving. A potential upward reversal is indicated by a bullish divergence, which happens when the price makes lower lows while the oscillator makes higher lows. When the oscillator makes lower highs while the price makes higher highs, this is known as bearish divergence and could indicate a future downward trend.
5. Customization for multiple timeframes: The Chaikin Oscillator is adaptable and is used on charts with numerous timescales, such as intraday, daily, weekly, or monthly charts. Traders change the input parameters to fit their desired timeframe and trading strategy.
It should be used in conjunction with other technical analysis tools and elements for thorough market analysis, although the Chaikin Oscillator offers insightful information.
What are the limitations of the Chaikin Oscillator?
The Chaikin Oscillator is a useful momentum indicator for traders, but like all indicators, it has five main drawbacks that users should be aware of.
1. Whipsaws and false signals
Oscillator signals are prone to whipsaws that may generate false trading signals during choppy price action. This leads to poor entry and exit timing.
2. Lagging indicator
Being based on moving averages, the oscillator lags price action and may signal after a trend has started. This delay risks missed opportunities.
3. Subject to price shocks
Sudden price spikes due to earnings or news events distort oscillator signals and require resetting parameters.
4. Range Bound/volatile markets
The oscillator tends to flatline during rangebound sideways markets providing little useful information.
5. Interpretation complexity
Multiple signal crossovers require experience to interpret optimally and combine with other indicators.
While the Chaikin Oscillator is a valuable momentum tool, traders should employ it in conjunction with other signals while being aware of its limitations in certain situations. A prudent trading approach is advisable when using the Chaikin Oscillator.
Is the Chaikin Oscillator accurate?
Yes, the Chaikin Oscillator is considered accurate as it provides valuable information about the accumulation and distribution of volume in a given financial instrument. The Chaikin Oscillator creates a number that oscillates above and below a zero line by analyzing the difference between the 3-day exponential moving average (EMA) and the 10-day EMA of the Accumulation/Distribution Line (ADL). While negative levels signify a gloomy mood, positive values indicate bullish sentiment.
Is the Chaikin Oscillator reliable?
Yes, the Chaikin Oscillator is considered reliable for several reasons. A well-liked momentum indicator that aids traders in determining market buying and selling pressure is the Chaikin Oscillator. It offers insightful information on the strength and trajectory of a trend. It can be combined with multiple time frame analysis, study of price action and adding other indicators and tools to further strengthen a trading plan.
What is the difference between the Chaikin Oscillator and the Chaikin Money Flow?
Marc Chaikin created two technical analysis instruments: the Chaikin Oscillator and the Chaikin Money Flow. There are three overall factors based on which these are differentiated, even if they share certain common fundamental concepts.
1. Objective:
The Chaikin Oscillator gauges the momentum of the accumulation/distribution line. It reveals the degree of market buying or selling pressure.
Chaikin Money Flow (CMF) combines price and volume data. The CMF calculates the amount of money that has accumulated and been distributed inside a security. In addition to spotting probable trend reversals, it tries to demonstrate the strength of buying and selling pressure.
2. Calculation:
The Chaikin Oscillator is calculated by taking the difference between two exponential moving averages (EMAs) of the accumulation/distribution line. A 3-day EMA and a 10-day EMA are generally used.
The CMF is calculated by multiplying the Money Flow Multiplier (MFM) by the volume and summing these values over a specified period. The MFM is determined based on the relationship between the close price and the high-low price range.
3. Interpretation:
A zero line is used by the Chaikin oscillator as a reference. Positive levels represent pressure to buy, while negative values represent pressure to sell. Potential buy or sell signals are regarded as crossovers above or below the zero line, respectively.
The Chaikin Money Flow varies between +1 and -1. Values over zero show accumulation and indicate purchasing pressure, while values below zero suggest selling pressure and suggest distribution. Divergences between price trends and the CMF also point to future reversals.
The Chaikin Oscillator primarily focuses on measuring momentum through the accumulation/distribution line, while the Chaikin Money Flow combines price and volume to evaluate the flow of money into or out of a security. Their computations, interpretations, preferred time frames, and the degree to which volume is taken into account vary. Analysts and traders can use both techniques to acquire insights into market trends and prospective trading opportunities.


 Previous Article


![15 Investing.com Alternatives [Free+Paid] You Should Use in 2026](https://www.strike.money/wp-content/uploads/2026/04/Investing.com-Alternatives.jpg "15 Investing.com Alternatives [Free+Paid] You Should Use in 2026 136")
![15 TradeStation Alternatives [Free+Paid] You Should Use in 2026](https://www.strike.money/wp-content/uploads/2026/04/TradeStation-Alternatives.jpg "15 TradeStation Alternatives [Free+Paid] You Should Use in 2026 137")
![15 Chartink Alternatives [Free+Paid] You Should Use in 2026](https://www.strike.money/wp-content/uploads/2026/04/Chartlink-Alternatives.jpg "15 Chartink Alternatives [Free+Paid] You Should Use in 2026 138")
: Overview, 10 Types of Indicators, Settings for Different Markets 139")


 : Definition, Formula, calculation, Uses, Advantages Vs limitations 142")


No Comments Yet.