The Keltner Channel Oscillator is a volatility based indicator in technical analysis that helps the traders identify the direction of the market and define price trends.
The Keltner Channel Oscillator is also used to identify trend reversals with the help of channel breakouts and channel direction. They also pinpoint overbought and oversold conditions in the market when the trend is flat.
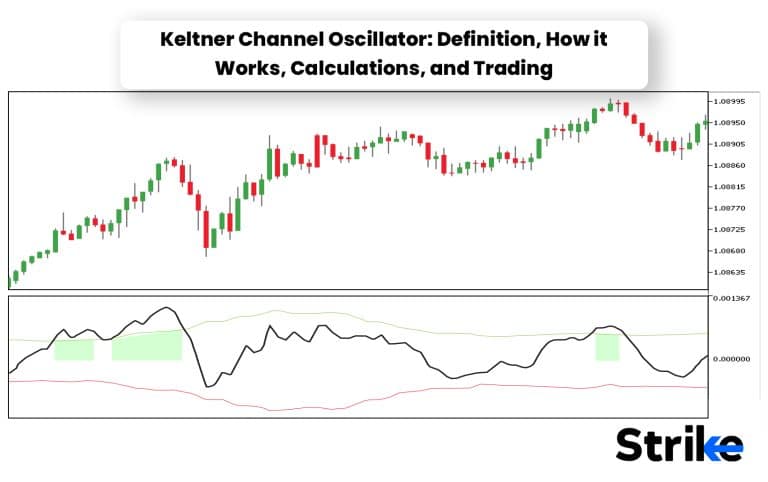
The Keltner Channel Oscillator is set up by the traders depending on their strategy and it delivers graphical price signals that can easily be deciphered by the traders.
The Keltner Channel Oscillator is used to identify trade opportunities in swing action depending on the movement of the price. The Keltner Channel Oscillator is similar to Bollinger Bands but the Keltner Channel oscillator uses the Average True Range (ATR) instead of Standard deviation (SD).
What is the Keltner Oscillator ?
The Keltner Channel Oscillator or KC is a technical indicator that consists of volatility-based bands which are also called channels set above and below a moving average. The channels are usually set two Average True Range (ATR) values above and below the Middle Line, which is usually a 20-period Exponential Moving Average (EMA). The Keltner Channel is used to signal possible price breakouts and provide overbought and oversold readings.
The Keltner channel consists of three separate lines similar to Bollinger Bands when plotted on a chart. The middle line is an exponential moving average of the price and the upper and lower lines are typically set at two times the average true range. The price moves between the upper and lower lines or bands which is called the channel. The direction of the channel helps in identifying the direction of trends. The price is considered rising when the direction of the channel is upwards and the price is considered falling when the direction of the channel is downwards. The price bands expand and contract as volatility increases and decreases.
Another term for Keltner Oscillator is Keltner Bands or Keltner channel indicator. Trading takes place within the band in a ranging market and an overbought and oversold strategy is used here.
A breakout Strategy or Trend pullback Strategy is used in a trending market. It is an important step for the trader to identify if the price is trending or ranging inorder to use the Keltner channel indicator. In the image uploaded below, the blue channel-like structure is the Keltner Channel Indicator that is applied on the candlestick bars.

Who developed the Keltner Channel ?
The Keltner Channel was introduced and developed by Chester W Keltner in the 1960s. Chester W Keltner was an American Trader who introduced the indicator in his book ‘How to Make Money in Commodities’. The original version had a 10 day Moving Average Trading rule. The original formula used simple moving averages (SMA) and the high-low price range to calculate the bands.
Linda Bradford Raschke introduced the newer version of Keltner Channels in the 1980s. This new version was similar to Bollinger Bands and it used a volatility based indicator called Average True Range (ATR). The Average True Range (ATR) method is commonly accepted and used by technical analysts and traders.
How does the Keltner Channel Oscillator work?
The Keltner Channel consists of 3 components. They are the Middle line, Upper envelope and Lower envelope. The upper envelope is above the middle line and the lower envelope is below the middle line. Here is an image of Keltner channel.

The Keltner Channels (KC) indicator is categorized as an indicator similar to Bollinger Bands (BB) and Moving Average Envelopes (MAE). Envelopes are technical indicators that are plotted with upper and lower bounds over a price chart.
The 3 lines move along with the price and the upper and lower envelopes are called channels.
The middle line is constructed by a 20 period exponential moving average of the price. The time period is changed depending on the trader’s strategy. A longer EMA signals more lag which means that the channels do not respond quickly to the price change and a smaller EMA responds quickly which means the direction is incorrect due to the frequent changes.
The Average True Range is calculated over a time period. This number is added to form the upper Keltner channel and subtracted to form the lower Keltner channel.
The Exponential Moving Average (EMA) helps the traders in determining the trend direction and the Average True Range (ATR) determines the channel width.
How does the Keltner Channel differ from other Technical indicators?
The Keltner Channel differs from other technical indicators as it is a volatility based technical indicator. The Keltner channel uses Average True Range (ATR) to measure the market’s trends and breakouts. The parameters of the Average True Range (ATR) changed unlike the other indicators. This allows the traders to use the indicator according to their preference and style. The flexible nature also helps get a clearer view of the different market conditions.
The three line structure provides a visual representation which is helpful for the traders to identify the market volatility and direction. The Keltner Channel is also suitable for every market and has different strategies depending on the type of market. It is used in both trending and ranging markets.
It does look somewhat like Bollinger Bands but a sect of traders find Kelter Channel to offer better breakout and retest strategy and pull back strategy.
Why is the Keltner Channel Oscillator important?
The Keltner Channel is important as it is used to analyze changes in price action and it can also measure volatility, identify trends, and provide support or resistance levels. This makes the Keltner Channel a valuable tool for traders as it helps them make informed trading decisions. Trends in the Keltner Channel start with strong moves in either direction where the price consistently trades above the upper band which indicates unusual strength and the opposite indicates unusual weakness.
Strong moves like this signal the end of one trend and the beginning of another.
The Keltner channel helps provide insights about the market conditions, price direction and trend reversals and breakouts. This helps the traders plan a proper strategy and help the investors and technical analysis with the necessary information.
How is the Keltner Channel Oscillator used in Technical Analysis?
The Keltner Channel Oscillator is used in technical analysis to identify the market volatility and direction. The volatility of the market is indicated by the space that exists between the upper and lower band. The market is said to be volatile when the space between the bands is wider. The market is considered to be in a non-volatile state or consolidating when the space between the bands is narrow. Another way the The Keltner Channel Oscillator is used in technical analysis is to identify the market direction.
The market direction is determined by following the direction of the middle line as well as the upper and lower band. Traders can easily interpret the price signals delivered by the Keltner channel oscillation in technical analysis. The slope of the channel denotes the price trend in the market. A rising channel indicates that an upward trend is in place and a falling channel indicates a downward trend. A flat or a sideways channel indicates a ranging market.
The price increases in an uptrend and constantly hits the upperline. The upward trend starts losing its momentum when the price starts hitting the lower line. This is similar for a falling channel. The upper line and lower line will act as resistance and support zones for a sideways channel. The middle line offers multiple trading opportunities if multi-time frame analysis is taken into consideration. Traders watch out for potential price breakouts when the channel is sideways.
How is the Keltner Channel Oscillator calculated?
The Keltner channel is a combination of two indicators. They are Exponential Moving Average (EMA) and Average True Range (ATR). The moving average is the average price for a certain number of periods and the Average True Range ( ATR) is a measure of volatility.
The Keltner Channels require three parameters:
- Select a length for the exponential moving average (EMA).
- Choose the time periods for the Average True Range (ATR).
- Choose the multiplier for the Average True Range (ATR).
Here is the formula to calculate The Keltner Channel.
Upper Band = EMA + (ATR x multiplier)
Middle Band = EMA
Lower Band = EMA – (ATR x multiplier)
The parameters change depending on the trader’s style and strategy. The EMA period is usually 20 but it is changed depending on the traders preference. An EMA is set to a length of 15 to 40.
The common multiplier for the ATR is 2 that is
Upper Band = EMA + (ATR 2)
Lower Band = EMA – (ATR 2)
The multiplier is changed to 1.5 or 2.5 depending on the trader’s preference and the information required by the trader for the asset that is being traded.
The ATR period is usually 10 or 20 but it is changed according to the traders preference.
The Keltner Channel can also be constructed using a Simple Moving Average (SMA) and ATR. Here is the formula to calculate the Keltner Channel.
Typical Price = (High + Low + Close) / 3
The 20 period SMA of the typical price will be the Middle Line (ML)
Upper Channel Line (UCL) = Middle Line (ML) + (ATR * 2)
Lower Channel Line (LCL) = Middle Line (ML) – (ATR * 2)
These are the two ways in which the Keltner Channel Oscillator is calculated using moving averages.
How to use Keltner Channel Trading?
The Keltner channel offers 3 strategies that can be employed to trade scripts.
Trend Breakout Strategy is used by the traders in a trending market. This Strategy is used by traders when the price breaks outside of the Keltner Channel. Strength is signaled when the price moves above the upper channel and weakness is signaled when the price moves below the lower channel. Strong moves like this can signal the end of one trend and the beginning of another.
The traders should start buying when the price breaks out and closes above the upper channel and should go long. Risk averse traders can anticipate a pull back on the broken upper envelope that may now act as a support, these traders can potentially find winning setups on taking trades on lower time frames. In the chart uploaded below, the black arrows represent potential breakout trading setups that got triggered. Traders may take long and short positions based on the breakout. Appropriate risk management is taken into consideration and confluences from other indicators and tools are taken to solidify a trading plan.

The traders should start selling when the price breaks down and closes below the upper channel and go short. The pullback of the broken lower envelope can be used to enter fresh shorts. In the image uploaded below, you can observe how the Keltner channel offers pullback strategies to take trades. The broken upper envelope will first act as a support and vice versa for the broken lower envelope acting as resistance. The image showcases the example of how retracement of price towards a broken upper envelope can be employed to take long setups. These trades are fine tuned on lower time frames.

The middle line is used as the exit and there is no profit target for this trade. The traders should simply exit whenever the middle line is touched even if there is a profit or loss. With risk management in consideration, traders may find ample trading opportunities around the middle line on lower time frames, these setups usually offer short term high probability trades.

In the image uploaded above, the purple boxes represent the long opportunities provided by the middle line retracement strategy. As the script was in an established uptrend. Each and every time the price pulled back at the middle line, it offered a potential high probability trading setup on a lower time frame, timely entry and a trading plan is supposed to be postulated.
The incorporation of ATR helps the traders ensure the Keltner channel is more effective when the volatility rises and helps filter out false signals. The best time to trade breakouts are when the Keltner Channel is indicating a sideways trend. This implies low volatility in the market. A Bullish Breakout is indicated when there is a breach of the upper line and a bearish breakout is indicated when there is a breach of the lower line. These breakouts take place when the volatility rises. Traders should buy during a bullish breakout and sell during a bearish breakout.
Trend Pullback Strategy is used by traders in a trending market. This Strategy is used by traders when the price is in a strong trend. Traders should start buying after confirming that the price remains in a strong uptrend. Traders should go long when the price pulls back to the middle line and place a stop loss about halfway between the middle line and lower channel. The profit target should be placed by the traders at or near the upper channel.
Traders should start selling after confirming after confirming that the price remains in a strong downtrend. Traders should go short when the price pulls back to the middle line and place a stop loss about halfway between the middle line and upper channel. The profit target should be placed by the traders at or near the lower channel. This Strategy should be used only when the price is an upward trend or downward trend. It is important that the traders should make sure that the price is not bouncing between the upper and lower channels and a clear trend is present. The image below uncovers an example of how shorting opportunities are generated by the middle line when the clean defined trend is identified. Purple boxes represent the no. of times a trading opportunity was generated. Trades are then executed by micro analysis on lower time frames.

Overbought and Oversold Strategy is used by traders in a ranging market. This Strategy is used when the price is trendless. Traders should trade in a range or sideways to identify overbought and oversold levels. Traders should buy when the price breaks out below the lower Keltner channel and wait until the price closes back inside the lower Keltner channel. Traders should sell when the price breaks out above the upper Keltner channel and wait until the price closes back inside the lower Keltner channel. Traders should also go short. Overbought and Oversold conditions are usually a sign of trend strength. Overbought means a strong uptrend and oversold means a strong downtrend. This strategy should be used by traders when the price is trading sideways or ranging.
When to use the Keltner Channel in Trading?
The Keltner Channel is used in trading for volatility analysis. The volatility of the market is indicated by the space that exists between the upper and lower band. Wider channels indicate high volatility and narrow channels indicate lower volatility. This helps the traders make appropriate decisions and use a proper trading trading strategy according to the market conditions.

What is the best Keltner Channel strategy?
The Keltner Channel Strategy depends on the type of the market. A trend pullback or breakout strategy is best incase of a trending market. The middle line strategy provides ample trading opportunities by micro-analyzing on a lower time frame, it offers a clean and clear picture of what trading action can be taken. An overbought and oversold strategy is best incase of a ranging market.
Does the Keltner Channel work well with Scalping Strategy?
Yes, the Keltner channel works well with Scalping Strategy. Scalping is a trading style that specializes in profiting off of small price changes and making a fast profit off reselling. The chart uploaded below is a 5 min chart of Nifty 50’s. The upper envelope acting as a resistance offered a shorting opportunity whereas the lower envelope acted as a support to provide long opportunities at that point. One can also observe how the middle line offered multiple pullback entries. Thus traders can use appropriate risk management and proper trades can be taken with the help of this indicator.

How can the Keltner Oscillator be used with other Indicators?
The Keltner Channel is a strong indicator but it is complemented with other indicators to confirm the trading signals. The Average Directional Index (ADX) is used along with the Keltner oscillator which will help identify false breakouts. Traders can also combine the Keltner oscillator with technical indicators like Stochastics Oscillator and the Relative Strength Index (RSI) to confirm oversold and overbought conditions. This provides a stronger signal for potential reversals or corrections.
In the image below, one can observe how the indicators complement each other and offer better understanding of the market activity. In the first instance, the RSI and Keltner channel provided information regarding overbought conditions, so traders could have avoided fresh long positions. The indicators offered multiple trading opportunities as highlighted in the chart by arrows.

Which Indicator works best with Keltner Channel?
The Average Directional Index (ADX) indicator works best with the Keltner channel. The Average Directional Movement Index (ADX) is a technical analysis tool used by traders to establish trend strength as well as trend direction. The average directional index (ADX) is used to determine when the price is trending strongly. The average directional index not only identifies trending conditions but also helps the trader find the strongest trends to trade.
What is the best setting for Keltner Channel?
The best setting for Keltner Channel is a 20 period Simple Moving Average (SMA) or 20 period Exponential Moving Average (EMA) and a multiplier 2 with a 10 or 20 period Average True Range (ATR).
Can the Keltner Oscillator be used for both short and long-term trading?
Yes, The Keltner Oscillator is used for both short term and long term trading. It is used for Scalping, Day trading, Swing Trading and Investing. The traders should adjust the period settings according to the time frame and their preferences.
Is the Keltner Channel leading or lagging?
The Keltner Channel is a lagging indicator and not a leading indicator. The Keltner Channel reacts slowly to price movements. Like many other Leading or Lagging Indicators, the information is based on past price data and does not forecast future price movements with absolute certainty. Traders should remember that the majority of Leading or Lagging Indicators are designed to summarize historical trends rather than predict the future.
What are the Advantages of the Keltner Channel?
The Keltner channel has potential advantages, There are 4 advantages to the Keltner channel. They are listed below.
- Measurement of Volatility: The Keltner Channel uses Average True Range (ATR) to measure market volatility. Narrow gaps between channels suggest lesser volatility while wider gaps suggest higher volatility.
- Identification of market trends: The Keltner Channel can help identify trends in the market. An upward trend is indicated when the price consistently trades above the middle line and a downward trend is indicated when it trades below the middle line. This helps a trader buy and sell easily according to the market trends.
- Confirmation of Breakouts: The Keltner Channel is used to confirm breakouts. A Bullish Breakout is indicated when there is a breach of the upper line and a bearish breakout is indicated when there is a breach of the lower line.. Traders can use this information to set a breakout strategy in a trending market.
- Overbought and Oversold Conditions: The Keltner Channel can help identify overbought and oversold conditions. A potential overbought or oversold situation is indicated when the price is far away from the middle line and close to the channel. This information helps the traders to make a strategy which is used when the price is trading sideways or ranging.
- Multiple Timeframes: The Keltner Channel is used on various timeframes.The Keltner Oscillator is used for both short term and long term trading. It is used for short term trading like Scalping and Day trading; medium term trading like Swing Trading; and long term trading like Investing.
These are the advantages of the Keltner Channel which is used by traders and investors to develop a successful trading strategy and make informed trading decisions. Traders can use the advantages to find the optimal setting that aligns with their trading strategy and risk tolerance.
What are the Disadvantages of the Keltner Channel?
There are 4 disadvantages to the Keltner Channel, stemming from the fact that it is a lagging indicator.
- Lagging Indicator: The Keltner Channel is a lagging indicator. The Keltner Channel reacts slowly to price movements. The information is also based on past price data and it does not forecast future price movements. This makes the Keltner channel an unreliable indicator for the traders.
- False Signals: The Keltner Channel can generate false signals in ranging markets. The lag in reacting to price changes results in many false signals generated by the indicator leading to many losses.
- Parameter Settings: The Keltner Channel’s parameters can be changed such as the period for the moving average and the multiplier for the ATR. The interpretations and conclusions from different traders will be different and it could be incorrect.
- Standalone Tool: The Keltner Channel is not a standalone solution for trading decisions. The Keltner Channel in conjunction with other indicators like Stochastic Oscillator, Relative Strength index (RSI) and Average Directional Movement Index (ADX)
These are the disadvantages, and it is important that traders and investors use. The Keltner Channel and other technical analysis tools and indicators to confirm signals and minimize the risk of poor trading decisions. Traders must also find the optimal setting that aligns with their trading strategy and risk tolerance.
Is the Keltner Channel reliable?
Yes, the Keltner Channel is reliable. As the channel offers important market insights. Multi-time frame analysis, price action analysis and other indicators can be used alongside to generate a high probability trading setup. Thus, the Keltner channel is reliable only when used alongside other tools. No indicator is reliable as a standalone indicator and they are prone to generate false signals. The reliability however depends on the market conditions, placement of bands and traders strategy.
Is the Keltner Channel accurate?
Yes, the Keltner Channel is accurate. The accuracy depends on the setting, the placement of the bands and the traders strategy. Generally the Keltner Channel does not provide misleading trade signals and helps in identifying trends and measuring volatility.
What is the difference between Keltner Channel and Bollinger Bands?
There are 3 main differences between Keltner Channel and Bollinger Bands.
| Keltner Channel: | Bollinger Bands: |
The Keltner Channel uses Average True Range (ATR) to measure market volatility. ATR uses the gap in the channel to determine the price and interpret the market conditions. | 1) Bollinger Bands uses standard deviation (SD) to measure market volatility.Standard deviation measures how widely prices are dispersed from the average price. |
The Keltner Channel is calculated using a moving average as the middle line and Average True Range (ATR) to define the upper and lower channel lines. | 2) Bollinger Bands consist of three lines which is a simple moving average (SMA) and two standard deviations bands placed above and below the middle line. |
The Keltner Channel helps in identifying price ranges and market trends as ATR provides a clear and definite signal from the channels. | 3) Bollinger bands are better suited to identify breakouts and market volatility as the bands expand and contract depending on the market volatility. |
Here are the basic differences between the Keltner channel and Bollinger Bands. Both these indicators have minor differences and is used by the traders and technical analysts to get a more clearer view of the market conditions and to make better decisions according to the trading strategy.


 Previous Article


![15 Investing.com Alternatives [Free+Paid] You Should Use in 2026](https://www.strike.money/wp-content/uploads/2026/04/Investing.com-Alternatives.jpg "15 Investing.com Alternatives [Free+Paid] You Should Use in 2026 64")
![15 TradeStation Alternatives [Free+Paid] You Should Use in 2026](https://www.strike.money/wp-content/uploads/2026/04/TradeStation-Alternatives.jpg "15 TradeStation Alternatives [Free+Paid] You Should Use in 2026 65")
![15 Chartink Alternatives [Free+Paid] You Should Use in 2026](https://www.strike.money/wp-content/uploads/2026/04/Chartlink-Alternatives.jpg "15 Chartink Alternatives [Free+Paid] You Should Use in 2026 66")
: Overview, 10 Types of Indicators, Settings for Different Markets 68")

 : Definition, Formula, calculation, Uses, Advantages Vs limitations 70")


: How We Used This 70/30 Indicator in 6 High Win-rate Strategies 74")


No Comments Yet.