The Rate of Change (ROC) indicator measures how rapidly asset prices are changing over a set period of time. Rate of change calculates the percentage increase or decrease in price between the current price and the price at the beginning of the lookback period.
ROC is a momentum indicator that shows the speed and steepness of price movements. An increasing ROC means upside price momentum is accelerating, signaling a strong uptrend. A decreasing ROC means downside momentum is building, which could foreshadow a trend reversal or consolidation.
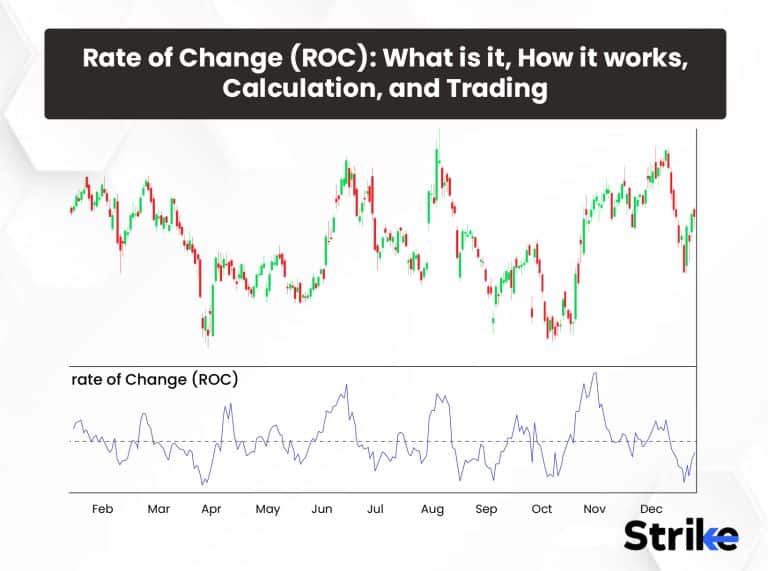
ROC oscillates above and below a centerline at zero.
Readings above zero indicate bullish momentum, while readings below zero indicate bearish momentum.
Crossing the zero line generates trading signals – a crossover from negative to positive territory signals rising prices, while a crossover from positive to negative signals falling prices.
The ROC indicator was developed in the late 1940s by market technician Morton Baratz. It was one of the first momentum oscillators created for analyzing price charts. By quantifying the rate of change in prices, ROC aimed to identify market trends, potential turning points, and whether prices were gaining or losing upside/downside strength. This is how the ROC blue line is applied on the chart.
What is the Rate of Change (ROC)?
Rate of Change (ROC) is a technical momentum indicator that measures the percentage change in price over a given period of time. ROC calculates the speed at which prices are rising or falling, which indicates the strength and steepness of the current trend.
ROC is an oscillator that fluctuates above and below a centerline, usually at zero. ROC above zero signifies that prices are gaining strength and momentum is increasing. ROC below zero indicates that selling momentum is intensifying and prices are weakening. Take a look at the picture below.
The distance of the ROC from the centerline represents how strong the momentum is rising or falling. A ROC reading near zero shows a lack of directional momentum, while an extreme reading signifies momentum may be overstretched. Crossing above the centerline generates a buy signal, as it shows upside momentum is accelerating. Crossing below the centerline generates a sell signal, indicating downside momentum is intensifying.
ROC can also be used to spot potential reversals. When the ROC diverges from the price movement, it signals a change in momentum that could foreshadow a trend reversal. For example, if prices continue rising but the ROC starts falling, it indicates upside momentum is weakening and a sell-off may be imminent. Below uploaded chart is an example of how ROC can be utilized to generate market information.
: What is it, How it works, Calculation, and Trading 41")
The time period used to calculate ROC determines how sensitive the indicator will be. A shorter period like 10 days will produce a volatile ROC oscillator that generates frequent signals. A longer period like 20 or 30 days will result in a smoother ROC line better suited to identifying longer-term trend changes and reversals.
ROC provides useful insights into the momentum behind price moves. Combined with other indicators like moving averages, RSI or trend lines, it gives a clearer picture of trend direction and strength. ROC’s long history and continued popularity show that momentum is a key factor driving price changes in the market. By measuring the rate of change, ROC helps traders anticipate when trends may start or end.
Who invented ROC indicator?
Morton Baratz invented the Rate of Change (ROC) in the late 1940s during his career as an American technical analyst who pioneered momentum indicators as an analysis method in financial markets. ROC was one of the earliest momentum oscillators designed for technical analysis.
It measured percentage price changes over a given time period in order to assess speed and acceleration in price moves, thus helping identify trend direction, reversals, or potential turning points within markets. Initially Return On Capital (ROC) was calculated using closing prices and displayed as an oscillator with its centerline set to zero. A rising ROC above zero indicated increasing buying momentum while falling ROC below zero indicated increasing selling momentum; crossing over from either extreme resulted in buy and sell signals.
ROC became more widely adopted among analysts in four other ways.
- Utilize signal lines for more precise trading signals – crossing above zero line triggers a buy signal, for instance.
- Applying Relative Cost (ROC) to prices other than just closing prices – such as intraday prices, moving averages or other indicators – provided a more robust momentum analysis.
- Comparing Relative Odds Ratio across multiple timeframes helps provide a comprehensive view of trend momentum and detect reversals more readily. Conflicting ROC signals between time frames indicated a greater likelihood of an imminent change.
- ROC and Price Divergences can help identify potential trend reversals. Price rising while ROC falling indicates slowing upside momentum and suggested potential sell-off.
ROC remains an invaluable indicator in short-term trading strategies focused on momentum and trend capture. When combined with other indicators like RSI and MACD, it offers a powerful means of analyzing momentum as well as anticipating price reversals or breakouts.
Morton Baratz made an immense contribution to technical analysis through his creation of Rate of Change Indicator (ROC). By quantifying rate changes in prices, Baratz provided analysts with an objective way of measuring trend strength and detecting reversals; his work revolutionized momentum-based trading strategies which remain relevant today – all thanks to Baratz. ROC stands as an impressive testament of Baratz’s influence on technical analysis.
How does the Rate of Change (ROC) indicator work?
The Rate of Change (ROC) indicator works by measuring the percentage change in price over a specific time period. It calculates the speed and acceleration at which prices are rising or falling to determine momentum and trend strength. ROC is displayed as an oscillator that fluctuates above and below a centerline, typically at zero. Refer to the picture below.
: What is it, How it works, Calculation, and Trading 42")
In the chart uploaded above, one can observe how ROC responds to price activity. When the blue line crosses the dotted line (0) into the positive zone, a bullish momentum is kicked in. The pullback method can also be applied on the indicator. The second dotted vertical line represents the time when ROC retraced to 0 line and bounced from that point indicating continuation of the bullish trend, this information is highly useful when traders do multi-time frame analysis. When the ROC shifts in below the zero line, a bearish side is kicked in as represented by the red arrow.
ROC above the centerline indicates that prices are gaining momentum and the trend is getting stronger. ROC below the centerline signifies that selling pressure is intensifying and the downtrend is accelerating. The further the ROC moves above or below the centerline, the stronger the trend momentum becomes. An ROC reading near the centerline shows a lack of clear directional momentum. Extreme high or low ROC levels indicate the trend may have become overextended and is prone to reversal.
: What is it, How it works, Calculation, and Trading 43")
Crossing above the centerline generates a buy signal, as it shows upside momentum is strengthening. Crossing below the centerline triggers a sell signal, indicating downside momentum is gaining force. The ROC time period used impacts how often signals are generated. A short period like 10 days will produce frequent signals, while a longer 20-day ROC will generate signals highlighting stronger, more sustained trend changes.
The divergence between ROC and price also signals a trend reversal. Prices continue rising but ROC starts falling indicates upside momentum is weakening. This bearish divergence suggests a sell-off may be coming. The opposite is true for bullish divergence where prices are falling but ROC starts rising. The chart uploaded below shows classic example of how bearish divergence can help traders fine tune the setup and also avoid fake trades. The bearish candlestick pattern could have acted as a strong indication of bearish momentum. Such way, multiple confluences are added to solidify a trade setup.
: What is it, How it works, Calculation, and Trading 44")
ROC works best when used with other indicators like moving averages, trend lines or RSI. For example, when ROC crosses above its centerline at the same time price crosses above a key moving average, it provides confirmation of an uptrend reversal or breakout. Such combinations enhance the predictive power of ROC for trading.
How is Rate of Change (ROC) used in Technical Analysis?
Rate of Change (ROC) is used in technical analysis to identify trends, and spot reversals, and generate trading signals. ROC indicates the direction and strength of the current trend. ROC above its centerline signifies an uptrend with accelerating momentum. ROC below its centerline indicates a downtrend is gaining strength. The further ROC moves from the centerline, the stronger the trend becomes. Below are other ways ROC is used in TA.
Spotting Reversals
ROC signal when a trend may be ending. This includes:
1. Divergence
Price continues rising but ROC starts falling suggesting upside momentum is slowing and a downturn may be coming. The opposite is true for bullish divergence. An example of divergence between price and ROC is explained.
: What is it, How it works, Calculation, and Trading 45")
2. Extreme Levels
High ROC levels indicate an uptrend may be overextended, while low ROC levels signify a downtrend may have become overdone. Reversal is more likely when ROC reaches extreme overbought or oversold territory. The chart uploaded below signifies how ROC reacts from extreme points to generate trading opportunities.
: What is it, How it works, Calculation, and Trading 46")
3. Volatility Spike
A sudden spike in ROC upside volatility sometimes precedes a downtrend. High volatility means the trend is becoming unstable and prone to reversal.
Trading Signals
ROC generates buy and sell signals when it crosses above or below its centerline.
– Buy Signal
ROC crossing above centerline, indicates upside momentum is accelerating and a new uptrend may be starting. This signals an opportunity to buy.
– Sell Signal
ROC crossing below centerline signifies downside momentum is intensifying and a downtrend may be beginning. This signals an opportunity to sell short or close long positions. An example of how crossing above or below zero line generates buy and sell signals.
Secondary Confirmation
ROC works best when combined with other indicators. For example, in a price chart showing a breakout, ROC crossing above its centerline at the same time provides confirmation that upside momentum is strengthening and the breakout may be valid. ROC failing to confirm the breakout indicates the move lacks momentum and may be false.
Multiple Timeframe Analysis
Comparing 10-day ROC to 20-day ROC provides a broader view of trend momentum across timeframes. When ROC signals agree between timeframes, it indicates a stronger overall trend. Conflicting signals between time frames suggest the trend may be losing steam and a reversal is more likely. The indicator works well on higher time frames like Daily, weekly and monthly.
What is the purpose of the Rate of Change Indicator?
The primary purpose of the ROC indicator is to identify potential trend reversals, overbought or oversold conditions, and generate trading signals based on the momentum of price movements. The ROC indicator is calculated by comparing the current price of a financial asset to its price a specified number of periods ago. The resulting value is usually expressed as a percentage.
What is the formula for the Rate of Change (ROC)?
The formula for calculating the Rate of Change (ROC) indicator is
ROC = ((Current Price – Previous Price) / Previous Price) x 100
Where:
Current Price = The latest price period’s close
Previous Price = The close of the price period “n” number of periods ago
For example, if calculating the 10-day Rate of Change:
ROC = ((Today’s Close – Close 10 Days Ago) / Close 10 Days Ago) x 100
How is the Rate of Change (ROC) calculated?
The Rate of Change (ROC) indicator is calculated as follows
ROC = ((Current Price – Previous Price) / Previous Price) x 100
For example, if calculating the 10-day ROC for a stock:
Today’s Close = Rs. 120
Close 10 Days Ago = Rs. 100
ROC = ((Rs. 120 – Rs. 100) / Rs. 100) x 100 = 20%
So the 10-day ROC is 20%, indicating the price has gained momentum by rising 20% over the past 10 days.
Below is how ROC can be calculated and interpreted.
1. Select a time period for ROC that suits your needs, e.g. shorter 5-day or 10-day ROC for short-term analysis or longer 20-day or 30-day ROC for identifying longer-term trend changes.
2. Take the closing price for the current period and subtract the closing price for the previous time period. For example, subtract today’s close from the close 10 days ago for 10-day ROC.
3. Divide the difference by the previous period’s closing price. For example, (Today’s Close – Close 10 Days Ago) / Close 10 Days Ago.
4. Multiply the result by 100 to convert to a percentage. For example, (Difference / Previous Close) x 100.
5. The resulting ROC value indicates the percentage increase or decrease in price over that time period. A positive ROC means the trend is up, while a negative ROC means the trend is down. The further ROC moves from zero in either direction, the stronger the trend.
6. When ROC crosses above/below zero, it generates a buy/sell signal respectively as momentum changes direction. Divergence between price and ROC can also signal an impending reversal.
7. Compare shorter and longer-term ROC to get a broader view of trend momentum. For example, rising 10-day ROC combined with rising 20-day ROC shows an uptrend with strong, accelerating momentum. Conflicting signs between ROC timeframes suggests weakening momentum or potential trend change.
8. For overbought/oversold levels, watch for ROC higher than +50-70% (for uptrend) or lower than -50-70% (for downtrend). Extreme ROC levels indicate the trend may have become overextended and vulnerable to reversal.
The key to using ROC effectively is determining momentum trends, spotting trend reversals as early as possible based on ROC divergences or extreme overbought/oversold levels, and utilizing ROC buy/sell signals in conjunction with other indicators to confirm price breakouts or breakdowns. Comparing ROC across multiple timeframes also provides a more robust analysis of trend dynamics.
How does the Rate of Change (ROC) Indicator used in Trading?
Trading involves crafting a trading plan. A trading plan consists of understanding of the market activity, identification of the trend and list of confluences are gathered to formulate an actionable trading plan that involves taking long or short setups, the plan also includes the entry price, the take profit price and the stop loss. Below attached is an example of how ROC as an indicator is applied on the chart to get information regarding the script. A long trade is taken as an example of trade generated with the help of ROC.
: What is it, How it works, Calculation, and Trading 48")
ROC generates buy and sell signals when it crosses above or below the zero line. A cross above zero signifies upside momentum is accelerating and indicates an opportunity to buy, as an uptrend may be starting. A cross below zero signifies downside momentum is increasing and signals an opportunity to sell short or close long positions, as a downtrend could be beginning.
ROC confirms trend breakouts and supports more robust trading decisions. Price breaks out to new highs and ROC also crosses above zero confirms upside momentum is actually building and making the breakout more valid. Price breaks down but ROC does not cross below zero indicating the breakdown lacks momentum and could be a false signal.
ROC also spot potential trend reversals in advance. Price continues rising but ROC starts falling showing upside momentum is slowing and a reversal to the downside may be coming. Price keeps falling but ROC begins rising signifies downside momentum is weakening and a rebound could be approaching.
What trading strategies work best with a Rate of Change (ROC)?
ROC generates buy and sell signals when it crosses above or below the zero line. A cross above zero signifies upside momentum is accelerating and indicates an opportunity to buy, as an uptrend may be starting. A cross below zero signifies downside momentum is increasing and signals an opportunity to sell short or close long positions, as a downtrend could be beginning. Below are five trading strategy examples.
Crossovers
Look for crossovers of the ROC line above and below the zero line. When the ROC crosses above zero, it indicates price momentum is accelerating and signals a buy opportunity. When it crosses below zero, it indicates price momentum is decelerating and signals a sell.
Extreme levels
Check for readings in extreme negative or positive territory, such as -10% or +10%. Very high positive ROC readings signal an overbought market where the price rose too quickly, indicating a correction is likely. A high negative ROC signals an oversold market where the price fell too rapidly, indicating a relief rally could soon start.
Divergence
Look for divergences between the price and ROC. When the price makes a new high but the ROC fails to make a new high, it indicates weakening momentum and signals a possible trend reversal. Similarly, when the price makes a new low but the ROC fails to make a new low, it indicates momentum is strengthening and signals the correction may soon end.
Trend strength
Use ROC to determine the strength and sustainability of the current trend. An uptrend accompanied by increasing ROC shows momentum is accelerating and indicates the trend should continue higher. A downtrend with falling ROC indicates momentum is slowing and the trend could soon reverse higher.
Crossovers of swing highs/lows
Look at the ROC during previous price swings to identify important highs and lows. When ROC crosses above a previous swing high, it signals momentum has strengthened and indicates an acceleration of the trend. When ROC crosses below a previous swing low, it signals momentum has weakened and could foreshadow a trend reversal.
When to use the Rate of Change (ROC) in Trading?
The ROC indicator is also used in spotting reversals. Look for divergences between the price and the ROC. The price is making a new high/low but ROC does not indicate weakening momentum and a reversal could be forming. Also, watch for the ROC to cross above its previous swing high or below its previous swing low. This signals an acceleration or deceleration of momentum and trend reversal. The ROC indicator is also helpful in identifying overbought and oversold levels.
Extremely high ROC readings signify an overbought market where the price rose too quickly, indicating a correction is likely. A very low negative ROC reading signifies an oversold market where the price fell too rapidly, indicating a relief rally may start. The price is moving within a trading range indicates that the ROC indicator is used to spot trading range breakouts. Look for the ROC to break through its previous swing high or low. This indicates momentum is building up and the price could soon break out of its range. Enter a trade in the direction of the ROC breakout in anticipation of the price also moving out of its range.
The ROC indicator is also used to spot crossovers at the zero line. Look for the ROC to cross above or below its zero line. The ROC crossing above zero indicates upside momentum is accelerating and entering a buy position could be considered. ROC crossing below zero indicates downside momentum is accelerating and entering a sell position could be considered. This works best in conjunction with other signals like trend strength or reversals.
How effective is the Rate of Change (ROC) in different trading markets?
The Rate of Change (ROC) indicator is effective in different trading markets.
Stock trading
The ROC indicator works well for trading stocks. In an uptrend, a rising ROC confirms the trend and signals momentum is strengthening, indicating buying opportunities. In a downtrend, a falling ROC confirms the trend and signals momentum is strengthening, indicating shorting opportunities. Look for reversals when the price makes a new high/low but ROC does not. This indicates weakening momentum and a potential trend reversal. Stocks often experience strong momentum shifts, so the ROC is useful for spotting trend changes.
Forex trading
The ROC indicator is also useful in forex markets. Currencies often display strong trends, so the ROC helps determine trend strength and spot reversals. Look for the ROC to break above a previous swing high in an uptrend or below a previous swing low in a downtrend. This signals accelerating momentum and the potential for a large price movement. Also watch for divergences between price and ROC to spot reversals against the main trend.
Commodity trading
Commodity markets also exhibit strong trends, so the ROC indicator is helpful in gauging trend strength and reversals. Look for the ROC to make higher swing highs or lower swing lows to confirm the trend. When ROC starts moving in the opposite direction, it often signals a trend reversal. Commodities also experience sharp reversals, so the ROC detects changes in momentum early. Watch for divergences between the commodity price and ROC.
Index trading
The ROC indicator works with stock indexes to confirm the prevailing trend. Rising in an uptrend and falling in a downtrend, the ROC shows momentum is strengthening. Look for reversals or loss of momentum based on the ROC flattening or moving in the opposite direction of the trend. Indexes cover a basket of stocks, so the ROC captures broad momentum changes in the overall market or industry groups. Divergences between an index and its ROC signal impending reversals.
Options trading
For options trading, the ROC indicator detects when momentum is accelerating or decelerating sharply. It confirms trends for trading in the direction of an established trend or spot potential reversals. Confirm trend strength by looking for the ROC to make higher swing highs or lower swing lows. A reversal signal occurs when there is a divergence or the ROC crosses above/below its previous swing high/low. The ROC’s ability to measure strong momentum surges makes it useful for trading volatile options.
How does the Rate of Change differ from other Indicators?
The Rate of Change (ROC) indicator measures the percentage change in price over a set period, distinguishing itself from other indicators in key ways. Below is a comparison with four main indicators.
Moving Averages Vs Relative Oscillators (ROCs)
Moving averages are static measures that provide average prices over time. as such they lag current price action and may take time to respond to trend reversals or changes. On the other hand, Relative Oscillator Coefficients (ROCs) track price changes dynamically by measuring momentum behind price movements and can quickly identify acceleration in trends earlier than moving averages can. they also provide meaningful percentage calculations as opposed to simple averages provided by moving averages.
Relative Strength Index vs ROC
The Relative Strength Index (RSI) measures price momentum and speed of recent price changes to identify overbought or oversold conditions, oscillating between 0 and 100. In comparison, the Relative Oscillator Coefficient (ROC) expresses momentum as a percentage rather than as an absolute number between 0 and 100 for easier interpretation at a glance. additionally, it responds faster to trend changes since an RSI requires multiple periods to calculate its average gain/loss calculations while its counterpart requires multiple periods one period can use more responsively by its creator compared with its counterpart RSI counterpart. both oscillate between 0 and 100.
ROC vs MACD
The Moving Average Convergence Divergence (MACD) indicator compares two moving averages by measuring their convergence or divergence from each other, while ROC measures percentage change over a single time period without comparing between periods. Furthermore, it’s better at spotting small momentum changes compared to MACD which requires two lines crossing over to generate a signal. with just a simple change of direction, a change in momentum can be signalled with the latter indicator.
Stochastics vs ROC
Stochastics measure momentum by comparing a stock’s closing price to its price range over time and indicate overbought or oversold conditions when its indicator moves above 80 or below 20. By contrast, ROC expresses momentum using percentage change rather than on a scale from 0-100 and does not necessarily signal overbought or oversold levels at fixed values but rather requires analysis of current reading relative to past readings compared with stochastics which uses smoothed moving average calculations in its calculations compared with stochastics which uses smoothed moving average calculations in its calculations. ROC is more responsive compared with stochastics which use smoothed moving average calculations for calculations.
What are the Limitations of using the Rate of Change Indicator?
ROC is prone to certain limitations as well. Below are four of its main limitations.
Prone to false signals
The ROC generates false signals, especially in volatile or range-bound markets. It detects even small changes in momentum, and it signals a reversal that does not materialize. It is best used with other indicators to confirm signals and avoid false turns.
Requires optimization
The ROC period needs to be optimized for the asset and timeframe you are analyzing. A period that is too short generates excessive signals, while a period that is too long miss short-term turns. You have to experiment with different periods to find the one that balances signal frequency with accuracy. This is time-consuming.
Does not indicate overbought/oversold levels
The ROC only measures momentum and does not provide overbought or oversold readings on a standard scale. Extreme ROC levels must be interpreted based on historical values and the current market context. This requires more analysis to determine ifthe price has moved too far too fast.
Deteriorate during trading ranges
The ROC will oscillate back and forth during extended trading ranges, generating multiple buy and sell signals. Range-bound price action causes the indicator to weaken, and it performs best when there are clear trends. Using additional indicators to determine trading range vs trending conditions helps avoid false ROC signals.
Only measures short-term momentum
The ROC uses data from a single time period, typically a short period of days or weeks. This makes it useful for gauging short-term momentum and turning points but it misses the longer cycle. For the best analysis, the ROC should be used on multiple timeframes simultaneously, from short to long term. This provides more context and confirms when both short and long-term momentum are aligned.
The limitations of the ROC indicator can be mitigated by using other indicators like moving averages, RSI, trendlines to confirm ROC signals and trend direction.
Is ROC a leading indicator?
Yes, the Rate of Change (ROC) indicator is considered a leading indicator in some respects, but it also has some lagging characteristics. ROC has three main qualities that makes it a leading indicator. The ROC measures momentum and acceleration in price changes. It detects shifts in momentum early and signals a potential trend reversal or continuation.
This ability to spot momentum changes makes it a leading indicator. The ROC uses a single period to measure the rate of change in price. This makes it very responsive to short-term momentum shifts and turns. Its sensitivity allows it to lead price action. The ROC signals overbought or oversold conditions before a reversal occurs based on extreme momentum readings. This also demonstrates leading qualities.
Is ROC a good indicator?
It is difficult to definitively say whether the Rate of Change (ROC) indicator is good or bad. The effectiveness of any indicator depends on several factors. The ROC is useful for some objectives like spotting short-term momentum shifts or reversals but less effective for long-term investing. It depends on what you are trying to analyze or achieve.
It is suited for active traders looking to capitalize on volatility or catch turns early. Indications from ROC can help short term active traders to take the benefit by finding trading opportunities by diving deep in lower time frame and gathering confluences from different indicators and tools. But for passive investors, it likely generates too many signals and could lead to overtrading.
Your personal style impacts whether ROC is a good fit. The ROC can be used in many ways, including spotting trend reversals, confirming trend strength, identifying overextended momentum moves, etc. Its effectiveness depends on how well you are able to incorporate it into your trading methodology and interpret its signals.
What is the difference between ROC and RSI?
The Rate of Change (ROC) and Relative Strength Index (RSI) are both momentum indicators that measure the speed and change of price movements. However, there are four key differences between ROC and RSI.
| ROC | RSI |
| ROC calculates the percentage change in price over a specific time period. It expresses momentum as a straightforward percentage. ROC uses a simpler percentage calculation | RSI calculates average upward and downward price changes over a period of time. It expresses momentum on a scale of 0 to 100. RSI provides a normalized scale. |
| ROC depends on a single time period for its calculation making it sensitive to changing momentum. This sensitivity makes ROC prone to generating false signals during volatility or trading ranges. | RSI uses multiple periods in its average gain and loss calculation which provides smoothing making it less sensitive to changing momentum. RSI is better for general trend analysis rather than spotting quick turns. |
| ROC does not have standard overbought or oversold levels | RSI has commonly used overbought and oversold threshold levels at 70 and 30 respectively. |
| ROC is also used to spot divergences between price and momentum. ROC divergences are tough to spot and It requires you to spot the divergence visually on the chart. | RSI also highlights divergences. RSI divergences are also more significant and prone to lead to larger reversals. |
Divergences
•ROC is also used to spot divergences between price and momentum. For example, if price makes a higher high but ROC makes a lower high, it signals weakening momentum and the potential for a reversal. However, ROC signals divergences with just a visible difference between swing highs and lows. It requires you to spot the divergence visually on the chart.
•RSI also highlights divergences, but it clearly shows when it is in overbought or oversold territory based on its 0-100 scale. This makes divergences easier to identify with RSI compared to visually spotting loss of momentum with ROC. RSI divergences are also more significant and prone to lead to larger reversals.
ROC and RSI are both momentum oscillators, but RSI is better suited for general trend analysis and spotting overextensions with its predefined overbought/oversold levels and scale of 0 to 100. ROC, on the other hand, is better suited for active traders looking to spot quick turns or catch moves very early based on its higher sensitivity to price changes.
ROC requires more visual interpretation but is effective for shorter-term strategies. For most traders, RSI is probably easier to use and interpret compared to ROC, but combining the two provide a more comprehensive view of both immediate and longer-term momentum. Used together, ROC and RSI provide both confirmation and warning of when trends are strong or ready to reverse.


 Previous Article


![15 Investing.com Alternatives [Free+Paid] You Should Use in 2026](https://www.strike.money/wp-content/uploads/2026/04/Investing.com-Alternatives.jpg "15 Investing.com Alternatives [Free+Paid] You Should Use in 2026 52")
![15 TradeStation Alternatives [Free+Paid] You Should Use in 2026](https://www.strike.money/wp-content/uploads/2026/04/TradeStation-Alternatives.jpg "15 TradeStation Alternatives [Free+Paid] You Should Use in 2026 53")
![15 Chartink Alternatives [Free+Paid] You Should Use in 2026](https://www.strike.money/wp-content/uploads/2026/04/Chartlink-Alternatives.jpg "15 Chartink Alternatives [Free+Paid] You Should Use in 2026 54")
: Overview, 10 Types of Indicators, Settings for Different Markets 55")


 : Definition, Formula, calculation, Uses, Advantages Vs limitations 58")


No Comments Yet.