Risk-return analytics is a fundamental concept that seeks to explain the relationship between risk and return on investments. Risk-return analytics provides a framework for assessing the balance between the potential risk of loss and the potential for financial returns.
Risk-return analytics is based on the principle that higher the risk, the higher the potential return, and vice versa. This principle guides investors in making decisions about where to put their money. The risk-return relationship is an integral part of any investment decision-making process because it aids in the identification and analysis of potential risks and returns.
Risk-return analytics commences with identifying an example of risk and return in a particular investment. Risk, in financial management, refers to the uncertainty that an investment will yield the expected returns. Returns, on the other hand, are the gains or losses made from an investment over a certain period.
The risk of a portfolio is measured using different statistical techniques such as standard deviation or variance. These measures show the degree of volatility or risk associated with the investment. The return on investment is typically calculated as a percentage of the initial investment.
After identifying the potential risks and returns, investors use risk-return analytics to make informed decisions about their investments. They compare the potential returns against the risks, aiming for an optimal balance between the two.
Risk-return analytics should be used whenever an investment decision needs to be made. It’s especially beneficial when dealing with complex investments like stocks, bonds, or mutual funds. This analytic tool is also essential when diversifying a portfolio, as it helps determine the risk-reward ratio of different investments.
What is Risk-Return Analytics?
Risk-Return Analytics, as a field, is centred on understanding the relationship between the risk of an investment and its expected return. Risk-return analysis in financial management is based on the theory that higher risk is associated with a greater possibility of higher returns, and vice versa.
Now let us understand Risk-Return Analytics in the context of investments, where ‘Risk’ refers to the uncertainty or potential deviation from an expected outcome, often measured by the standard deviation. It is the likelihood that an investment’s actual returns may not align with the expected returns, with the standard deviation providing a quantitative measure of this variability. ‘Return’, on the other hand, is the gain or loss made on an investment over a certain period. It comprises income received from the investment such as interest, dividends, and any change in the price of the asset. Risk-return analytics, therefore, is the process of quantitatively studying this risk, often through the lens of standard deviation, and return to make informed decisions. It helps investors choose investments that best align with their risk tolerance level and expected return, using standard deviation as a key metric for assessing risk.
How Does Risk-Return Analytics Work?
Risk-return analytics, incorporating information analysis, works by seeking to understand the relationship between potential profit and the inherent risks associated with a particular investment. Essentially, it is the process of measuring and quantifying the potential rewards and drawbacks of an investment through rigorous information analysis. Risk-return analytics have one primary goal: helping investors create investment strategies that suit them by managing risk and return so they can maximize their return while managing risks associated with their investments. Risk is the uncertainty that the actual return of an investment will differ from its expected return, while return is the profit or loss an investor realizes from an investment over a certain period. Both play a critical role in choosing an investment; in general, investments with higher expected returns carry higher risks and vice versa. This emphasizes the importance of information analysis in evaluating the balance between risk and return.
When to Use Risk-Return Analytics?
Risk-return analytics should be used whenever there’s a need to make informed financial decisions, particularly in the realm of investment. This tool is used in the analysis of individual securities, portfolio management, and strategic asset allocation. It is a crucial component in financial planning and wealth management, helping to balance the potential returns against the inherent risks
What are Examples of Risk-Return Analysis?
Sharpe ratio and Treynor ratios are two examples of risk-return analysis. Let us take a close look at each.
Sharpe Ratio, named after William F. Sharpe, is a risk-adjusted measure of return that is used to evaluate the performance of an investment portfolio. It is the average return earned in excess of the risk-free rate per unit of volatility or total risk. The Sharpe Ratio quantifies the return you could receive for the extra volatility you endure for holding a riskier asset.
The equation for the Sharpe Ratio is
Sharpe Ratio = (Rp – Rf) / σp
Where
Rp is the expected portfolio return
Rf is the risk-free rate
σp is the standard deviation of the portfolio’s excess return
What Is the Relationship Between Risk and Return in Risk-Return Analytics?
Risk and return are two interdependent elements. This relationship is often described as direct and proportional: the higher the potential return, the greater the associated risk. To elaborate, risk pertains to the chance of an investment not attaining its expected outcome or yield, including the possibility of losing the initial investment. Return, on the other hand, is the gain or loss made from an investment over a particular period, often expressed as a percentage.
The relationship between risk and return is a fundamental concept in finance and investment. Investors frequently face the dilemma of balancing these two aspects. Generally, investments with a high return potential carry a higher risk factor. This is because such investments are more susceptible to market volatility and uncertainties. On the other hand, investments that carry a lower risk often provide a comparatively lower return.
This relationship is often visualized on a risk-return spectrum, where the risk and return are plotted on a graph. The upward slope of the graph indicates that as the risk increases, so does the potential return.
For instance, government bonds are considered low-risk investments but offer relatively low returns. Conversely, stocks are high-risk investments with the potential for high returns.
Therefore, when making investment decisions, an investor must consider their risk tolerance – the degree of uncertainty they are willing to take on in exchange for potential returns.
This intricate dance between risk and return in risk-return analytics helps investors make informed decisions about their investments, shaping their portfolios according to their financial goals and risk tolerance.
What are the Different Models Used for Risk-Return Analytics?
Models are used to evaluate risk and return, providing valuable insights into the likely performance of an investment. The five key models include the Capital Asset Pricing Model (CAPM), the Sharpe Ratio, the Sortino Ratio, Value at Risk (VaR), and the Conditional Value at Risk (CVaR).
1. Capital Asset Pricing Model (CAPM)
The Capital Asset Pricing Model (CAPM) is a widely used model that describes the relationship between expected return and risk. According to CAPM, the expected return of a security or a portfolio equals the rate on a risk-free security plus a risk premium. The risk premium is the market return minus the risk-free rate, multiplied by the Beta of the security or portfolio. Beta measures the sensitivity of the expected excess asset returns to the expected excess market returns.
2. Sharpe Ratio
The Sharpe Ratio, developed by Nobel laureate William Sharpe, measures the performance of an investment compared to a risk-free asset, after adjusting for its risk. It’s calculated as the difference between the returns of the investment and the risk-free rate, divided by the standard deviation of the investment returns. A higher Sharpe ratio implies a better risk-adjusted return.
3. Sortino Ratio
The Sortino Ratio is a modification of the Sharpe Ratio that differentiates harmful volatility from general volatility by using the standard deviation of negative asset returns, called downside deviation. The Sortino Ratio is a useful way for investors, analysts, and portfolio managers to evaluate an investment’s return for a given level of bad risk.
4. Value at Risk (VaR)
Value at Risk (VaR) is a statistical technique used to measure and quantify the level of financial risk within a firm, portfolio, or position over a specific time frame. VaR is often used by risk managers to highlight the maximum potential loss expected on an investment, given a particular degree of confidence. VaR models are parametric, historical, or Monte Carlo simulations.
5. Conditional Value at Risk (CVaR)
Conditional Value at Risk (CVaR), also known as Expected Shortfall, is a risk assessment measure that quantifies the potential extreme losses in the tail of a distribution of possible returns. Unlike VaR, which considers the worst expected loss over a given horizon at a given confidence level, CVaR considers the average of all losses exceeding the VaR. CVaR provides a more accurate measure of tail risk, which is the risk of extreme investment outcomes.
Each model offers unique insights and is suitable for different situations. Investors and financial analysts should understand the strengths and limitations of each model to use them appropriately in their risk-return analysis.
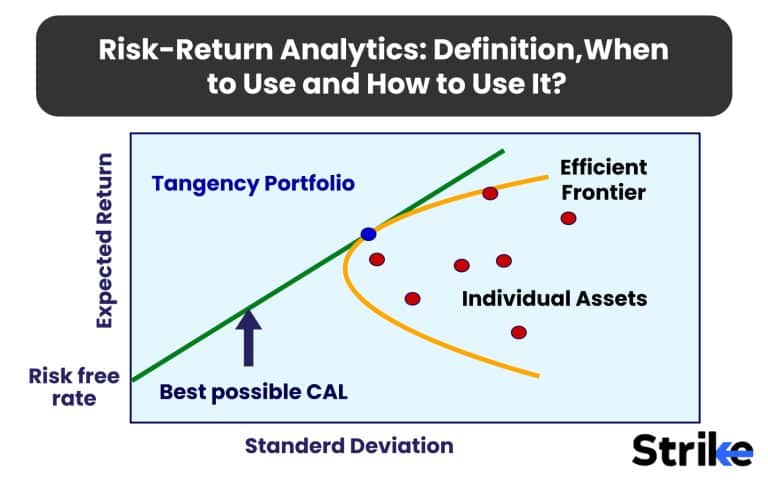
What Chart is Best for Risk-Return Analytics?
The most suitable chart for risk-return analysis is the Scatter Plot.

This chart type is particularly effective because it allows for a clear and concise visual representation of the risk-return trade-off, which is an essential aspect of investment decision-making.
Scatter plots excel in displaying the relationship between two numerical variables, in this case, risk and return. Each point on the plot represents an investment, with its position determined by its risk and return characteristics. The x-axis typically represents a risk, while the return is shown on the y-axis. Refer to the image below.
This layout allows for easy comparison between different investments or asset classes, enabling investors to determine at a glance the risk and return relationship of each. For instance, investments plotted towards the top left of the chart represent high returns with low risk, which are generally the most desirable.
Alongside scatter plots, three other charts are also effective for risk-return analysis. These include – bar charts, line graph and pie charts. Bar Charts help compare the returns of different investments over a specific period. However, they do not highlight the potential risks involved. Line graphs show the performance of an investment over time, illustrating its volatility and therefore its risk. However, they may not as clearly show the risk-return trade-off as scatter plots. Pie Charts are useful for displaying the distribution of a portfolio among various investments. Yet, they do not indicate the risk-return relationship.
Each of these chart types has its merits and contributes to a comprehensive risk-return analysis, but the scatter plot stands out for its ability to clearly and concisely depict the risk-return trade-off, making it the best choice for this purpose.
What are the Advantages of Risk-Return Analytics?
Superior decision making, refined portfolio management, amplified risk mitigation etc. are the main advantages of Risk-Return Analytics.
Optimal Investment Decision Making
Risk-return analytics allow investors to fully comprehend the varied risks associated with different investment opportunities, meaning they can select investments that most appropriately combine with their risk tolerance and return expectations.
Superior Portfolio Management
By appraising potential risks and rewards, portfolio managers can effectively diversify their portfolios, minimising the impact of investments that may experience losses and enabling more stable, consistent returns with a decreased likelihood of significant losses.
Proactive Risk Mitigation
Risk-return analytics paint a picture of the potential risks that exist across an investment portfolio. This transparency allows investors to identify potential risks and act against them to prevent their realisation, protecting against losses by ensuring portfolio stability.
Enhanced Predictability
Historical data and statistical models are drawn upon in order to accurately forecast both future returns and risks, vastly improving the predictability of investment outcomes.
Increased Returns
Investors can now use risk-return analytics to optimise their returns (maximising the return for a given level of risk) by understanding the risk-return tradeoff and allocating their capital in the way that achieves the most satisfying return for a desirable level of risk.
Regardless of the size or nature of an investment, risk-return analytics is an invaluable tool for all investors to consider incorporating into their decision-making process. By leveraging these insights, investors can successfully navigate the intricacies of investing and attain their financial objectives.
What are the Disadvantages of Risk-Return Analytics?
Risk return analysis is not without its drawbacks. Understanding these disadvantages will help you make a more informed decision when using risk-return analytics.
Misunderstanding of Risk
One of the main disadvantages of risk-return analytics is the misunderstanding of risk. The model assumes that investors are entirely rational and understand and can accurately assess risk. This is simply not always the case. Many studies have shown that investors often have a very skewed perception of risk; they either overestimate or underestimate it. This can lead to faulty conclusions and poor investment decisions.
Dependence on Historical Data
Risk-return analytics also have a heavy dependence on historical data to predict future returns. However, assuming that history will always repeat itself is a very risky supposition. Conditions in the market change all the time, and past performance, though a good, general guide for what is likely to happen in the future, is never a guarantee of future returns. Depending solely on historical data inevitably leads to wrong predictions and bad investment decisions.
Difficulty Measuring Risk
Risk is never something that is easy to measure. There is more to risk than just its volatility, but risk-return analytics make volatility the be all end all of their analysis. There are other entities like liquidity risk, credit risk, etc., that gets missed, and this leads to an underestimation on the total amount of risk that the investment carries.
Overemphasis on Quantitative Analysis
Risk-return analytics is a quantitative tool, which means it just uses numbers and statistical methods. This has a lot of benefits, but it comes with a lot of downsides too. It tends to miss a lot of the qualitative; the activities of management, the trends of the industry, the atmosphere and culture at that company. All of these have a very big impact on the return and the risk associated with any particular company, and the quantitative analysis usually comes up with incomplete and potentially misleading conclusions.
Investors should be aware of these disadvantages and consider them when using risk-return analytics. As with any tool, it should not be used in isolation but rather as part of a broader investment strategy.
How to Use Risk-Return Analytics?
Risk-Return Analytics is best used to analyze potential investments. It enables investors to gauge investments against their projected returns along with the risk that they take on. Among the main metrics are the Sharpe Ratio which measures returns compared to volatility and risk. A second popular model — the CAPM model — uses betas in coming up with the risk of single securities vis-à-vis the larger indexes of the entire market.
Which Model is Suitable for Risk-Return Analytics?
The Capital Asset Pricing Model (CAPM) is an ideal model for risk-return analytics. It provides a methodology to quantify the relationship between risk and expected return for individual securities, making it a valuable tool in portfolio management. CAPM considers the risk of a specific investment (systematic and unsystematic risk), the risk-free rate of return, and the expected return of the market to calculate a security’s expected return. This allows investors to evaluate potential investments in the context of their risk tolerance and expected return.
Does Risk-Return Help Investors Determine If the Risk Taken was Worth the Reward?
Yes, Risk-return analysis is a concept that helps investors figure out which investment is best for them on the basis of risk. They determine how much risk they are willing to take, then they work to match that risk level with the potential return on investment.
Does Risk-Adjusted Return Measure the Investment’s Return?
Yes, a risk-adjusted return is a measure of an investment’s return that accounts for the risk involved. Risk-adjusted returns are used to compare investment choices with different risk levels. It is also utilized to determine the right investment for a particular investor.
Are there Several Methods of Risk-Adjusting Performance for Risk-Return Analytics?
Yes, the most commonly used measure is the Sharpe ratio, which measures the excess return of an investment over the risk-free rate per unit of risk. Other methods include the Treynor ratio, the Jensen ratio, and the Sortino ratio.


 Previous Article


![15 Investing.com Alternatives [Free+Paid] You Should Use in 2026](https://www.strike.money/wp-content/uploads/2026/04/Investing.com-Alternatives.jpg "15 Investing.com Alternatives [Free+Paid] You Should Use in 2026 16")
![15 TradeStation Alternatives [Free+Paid] You Should Use in 2026](https://www.strike.money/wp-content/uploads/2026/04/TradeStation-Alternatives.jpg "15 TradeStation Alternatives [Free+Paid] You Should Use in 2026 17")
![15 Chartink Alternatives [Free+Paid] You Should Use in 2026](https://www.strike.money/wp-content/uploads/2026/04/Chartlink-Alternatives.jpg "15 Chartink Alternatives [Free+Paid] You Should Use in 2026 18")
: Overview, 10 Types of Indicators, Settings for Different Markets 20")

 : Definition, Formula, calculation, Uses, Advantages Vs limitations 22")


No Comments Yet.