The advance-decline line is a market indicator that traders use to estimate the overall strength or weakness and the breadth of the stock market. The advance-decline line helps in monitoring how many stocks are presently trading above or below the close of the previous day.
The advance-decline line chart serves as a suitable indicator for determining the current market trend for traders who wish to have a deeper insight into the market trend analysis. It also helps in understanding the direction of the market in the short term and how strong is the current trend.
The advance-decline indicator is usually produced for a single stock index or the whole market and may be shown on a chart as a line that rises when the number of advancing stocks exceeds the number of sinking stocks and falls when the reverse occurs.
This article elaborates on the fundamentals of the advance-decline line, its uses, benefits, limitations, how it works, its formula, and its calculations.
What is Advance-Decline Line?
The Advance-Decline Line is a technical analysis tool that tracks the net number of advancing stocks (those that close higher than the previous day) minus the net number of falling equities (those that finish lower than the previous day) over a certain time period.
This indicator is cumulative with a positive number that is added to the previous number or subtracted from the previous number if the number is negative. Advances and declines in the stock market refer to the number of stocks that are closed at a higher and that closed at a lower price respectively than the previous day.
Stocks go up and down in certain indexes. However, it does not refer to the fact that all stocks will move in a similar direction, just because some stocks are moving in one direction. Sometimes it gets difficult for investors to determine whether the market direction is being influenced by a majority of stocks pushing the markets in one particular direction or by larger stocks holding more weight in an index.
Let, the capitalization-weighted stock index shows a rise of 3%. Then it becomes important for investors to understand whether the rise of the index was because of a majority of increasing stocks or if it’s driven by a company’s strong performance with a large weight on the index when.
The purpose of the A/D line is to check how it correlates with the index’s price movement that the investors compare. Traders follow these changes over time to forecast the stock market’s direction.
How does Advance-decline Line work?
The Advance-Decline Line (ADL) is a technical analysis technique that works by comparing the number of advancing stocks to the number of falling stocks to determine market breadth. The ADL is computed by subtracting the number of advancing issues from the number of declining issues and adding this value to the previous day’s ADL.
Here we have mentioned how it works.
- Identifying number of stocks: Determine the number of stocks that are advancing and the number of stocks that are dropping for a specific index or market. For example, you might look at the NYSE Composite Index for the day and tally the number of stocks that climbed in price (advancing) and those that declined in price (declining).
- Difference between the stocks: Determine the difference between the number of stocks that are rising and those that are falling. The difference between 1500 advancing stocks and 1000 falling stocks is 500.
- Determining the new ADL value: Add the difference to the ADL value from the previous day. If the ADL value the previous day was 10,000 and the change today is 500, the new ADL value is 10,500.
- Drawing ADL: Draw the Advance-Decline Line using the ADL values on a chart. The ADL line can be used to identify market trends. If the ADL line is rising, it implies that there are more advancing stocks than sinking stocks, indicating a healthy market.
If the ADL line is dropping, it indicates that there are more declining equities than advancing stocks, indicating a worse market. Traders and investors may use the ADL to corroborate other technical indicators like as moving averages and momentum indicators. If the ADL moves in the same way as these indicators, it might lend confirmation to a trend or indication.
What is the Formula for Advance-decline Line?
The Advance-Decline Line formula is straightforward. It entails computing the difference between the number of advancing and decreasing stocks on a particular day and then adding that difference to a running total.
Here is the formula.
A/D = Net Advances + PA, when the PA value exists and 0, when the PA value does not exist
where:
PA= Previous Advances= Prior indicator reading
Net Advances= Difference between the daily number of ascending and descending stocks
The traders determine the Advance-Decline ratio by comparing the value of stocks that have increased with the value of the stocks that are falling. The formula for determining ADR is
Advance-decline ratio= The number of advancing stocks/ The number of the declining stocks
Investors compare this ratio with the market trend and then the company trends that they seek to invest in for accessing whether to buy or sell the security. This gives an understanding of the upcoming trend that investors use in identifying the most-suitable entry as well as exit points.
How to Calculate the Advance-decline Line?
Calculating the A/D line involves subtracting the declining stocks of the current day from the advancing stock of the current day and then adding the A/D line value of yesterday.
Below mentioned are the steps involved.
- Calculate Net Advances for the first day: Subtract the number of stocks that finished lower on a day from the number of stocks that finished higher on that particular day. You will get the Net Advances. The Net Advances will act as the first value that you use for the indicator if this is the first time you are calculating the average.
- Calculate Net Advances for the next day: On the next day, the task is to calculate the Net Advances for that day and add it to the total from the previous day if positive. Subtract if it is negative.
- Repeat the first and third steps daily: Repeat the process for each trading period to create a time-series of the Advance-Decline Line, which can be plotted on a chart to identify trends and reversals in the market’s breadth.
What are the benefits of the Advance-decline Line?
The Advance-Decline Line (AD Line) is a technical analysis tool used by traders and investors to measure the strength or weakness of a market trend. Here are some of the benefits of using the AD Line:
Provides a broad market perspective: The AD Line measures the difference between the number of advancing and declining stocks in a given market index. This provides a broader view of the overall market trend, rather than focusing on a specific stock or sector.
Indicates possible trend reversals: Traders can discover potential trend reversals by monitoring the AD Line. For example, if the AD Line is rising even while the market falls, this might indicate that the market is likely to turn around and begin rising.
Aids in trend confirmation: The AD Line may also be used to confirm the strength of an established trend. If the AD Line rises with the market, it signals that the trend is strong and likely to continue. If, on the other hand, the AD Line is heading down while the market is still rising, this might indicate that the trend is losing momentum and may reverse.
The AD Line is frequently used in conjunction with other technical indicators, like as moving averages or momentum oscillators, to offer a more full view of market conditions. Overall, the AD Line is a valuable tool for traders and investors who want to assess the strength of a market trend and spot probable trend reversals.
What are the limitations of the Advance-decline Line?
While the Advance-Decline Line (AD Line) is a valuable technical analysis tool, traders and investors should be aware of its limitations. The following are some of the main limitations of the AD Line:
1. May miss market nuances: The AD Line is based purely on the number of advancing and falling stocks in a market index, and does not account for other factors that may influence market patterns. As a result, subtleties in market patterns, such as changes in sector performance or swings in investor mood, may be missed.
2. May give misleading indications: The AD Line, like every technical indicator, can provide false signals, especially during moments of market volatility or uncertainty. The AD Line should be used in conjunction with other indicators by traders and investors to confirm signals and reduce the danger of false positives.
3. Limited applicability in highly concentrated markets: The AD Line may be less beneficial in highly concentrated markets when a small number of stocks or sectors influence overall market performance. In such instances, the AD Line may not adequately reflect the market’s strength or weakness.
4. Restricted historical data: Because the AD Line is based on previous market data, its prediction value may be limited under quickly changing market conditions or during periods of major economic or political events.
Thus, while the AD Line may be a useful tool for understanding market movements, traders and investors should be aware of its limits and combine it with other technical indicators and fundamental analysis to make well-informed investment decisions.
What are examples of Advance-decline Line?
Traders use the A/D line in helping them decide which trades to place next.
For example, when the market shows more declining stocks than advancing stocks, it refers to the fact that a majority of stocks are closed at a lesser value than their prior day’s close. So, the traders can anticipate that in the near term, the market will fall. They can choose to sell as the market trend has been moving in a bearish course.
The A/D line enables the investors to look at the stocks on a level playing field. For example, when a market rises, the A/D line shows the investors whether the rise is driven by a majority of the stocks increasing or it is caused by a few selected stocks that hold a bigger weight in the index.
Traders use the A/D line for comparing it to the index’s price movements.
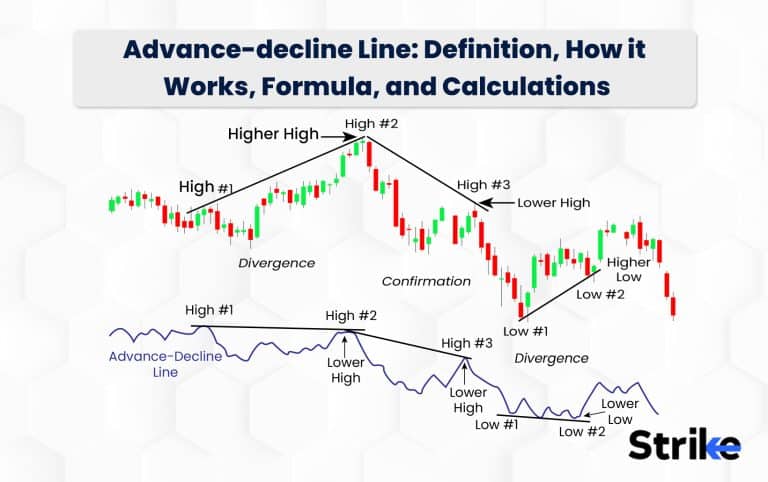
For example, the A/D line moves to new highs to confirm the direction of the index when an index that a trader is monitoring is moving to new highs. The market hits a bullish trend, if the A/D line and the index both hit a new high,
Now let the A/D line reaches a lower peak than the prior rally but the stock market reaches a new peak. This means fewer stocks are participating in a higher move and the rally can come to an end.
Here are a few examples of how to utilise the AD Line in practise.
1. Bullish divergence: A bullish divergence happens when the AD Line rises while the market falls. This might indicate that the market has been oversold and is due for a comeback. For example, during the March 2020 market slump, the AD Line for the S&P 500 had a bullish divergence, indicating that the market was likely to recover.
2. Market trend confirmation: The AD Line may also be used to validate the strength of a market trend. . For example, if the AD Line for the NASDAQ Composite Index rises with the market, it shows that the trend is strong and likely to continue.
3. Possible market reversals: The AD Line can predict probable market reversals. For example, if the Dow Jones Industrial Average AD Line is heading lower while the market is still increasing, it might indicate that the trend is losing momentum and may reverse.
4. Sector analysis: The AD Line may be used to examine the performance of particular market sectors. For example, if the AD Line for the technology sector rises while the whole market remains level, it implies that the technology sector outperforms the broader market.
How to use Advance-decline Line in Technical Analysis?
The Advance-Decline Line (AD Line) is a widely used technical analysis technique for determining the strength of a market trend. Following are some guidelines for employing the AD Line in technical analysis.
1. Determine the AD Line: The AD Line is computed by dividing the number of decreasing stocks in a market index by the number of advancing stocks, and then adding the result to the previous day’s AD Line value. The outcome is the AD Line on that particular day.
2. Plot the AD Line: Once you’ve computed the AD Line, plot it alongside the market index you’re looking at on a chart. This will show you how the AD Line is changing in respect to the market.
3. Look for divergences: Looking for divergences between AD Line and the market index is one technique to utilise AD Line in technical analysis. For example, if the market is reaching new highs but the AD Line is not, this might indicate weakness and a possible market reversal.
4. Employ the AD Line to validate trend strength: The AD Line may also be used to confirm the strength of a market trend. If the AD Line rises with the market, it signals that the trend is strong and likely to continue. If, on the other hand, the AD Line is heading down while the market is still rising, this might indicate that the trend is losing momentum and may reverse.
5. Mix the AD Line with other technical indicators: To offer a more full view of market conditions, the AD Line may be utilised in combination with other technical indicators such as moving averages or momentum oscillators.
6. Regularly monitor the AD Line: The AD Line is a dynamic indicator that can alter quickly in reaction to market conditions. It is critical to watch the AD Line on a frequent basis and change your trading strategy appropriately if you want to use it effectively in technical analysis.
Overall, the AD Line is an effective instrument for providing useful insights into market patterns and assisting traders in making better informed investment decisions. The aim is to search for divergence between an index and its underlying components. A healthy market, typically, will display wide participation when the majority of the constituents of an index are participating. An unhealthy market, by comparison, is where stocks are driving the index prices higher while several of the other constituents of the index are declining in price.
How to read the Advance-decline Line chart?
The Advance-Decline Line (AD Line) is a technical indicator that may be used to determine the strength of a market trend. Below we have mentioned the guidelines to read the AD Line chart.
1. Examine the scale: The AD Line is often represented on a chart with a vertical axis displaying the AD Line’s value. Examine the scale to see which values are utilised and how they are spread.
2. Keep an eye out for trends: The AD Line chart will illustrate how the AD Line has changed over time. To gain a feel of how the market is functioning, look for patterns in the AD Line, such as upward or downward moves.
3. Detect divergences: Identifying divergences between the AD Line and the market index is one of the most important applications of the AD Line. Watch for situations where the AD Line moves in the opposite direction of the market index, since this might signal probable market reversals.
4. Search for crossovers: Another approach to utilise the AD Line is to search for crossovers with other technical indicators, such as moving averages. For example, a crossing above a moving average uncertain wordsbe seen as a bullish indicator, but a crossover below a moving average could be interpreted as a bearish signal.
5. Keep an eye on the slope: The slope of the AD Line can be a good indication of market developments. If the AD Line is rising at a sharp angle, it signals that the market is strong and will likely continue to rise. If, on the other hand, the AD Line is heading downward at a high angle, it suggests that the market is weak and may be about to fall.
Overall, interpreting an AD Line chart necessitates paying close attention to the AD Line’s movements over time, as well as watching for divergences and crosses with other technical indicators. Traders may acquire significant insights into market patterns and make better educated investment decisions by using the AD Line in conjunction with other tools and strategies.
What are the other Technical Indicators besides Advance-decline Line?
Traders employ a variety of technical indicators to assess financial markets and make investing decisions. Here are a few examples of popular technical indicators.
- Moving Averages
The moving average technical analysis tool levels out the price data by creating a continuously updated average price. On a price chart, the moving average creates a single, flat line. This eliminates any variations effectively due to random price fluctuations.
- Moving Average Convergence Divergence (MACD)
This is a kind of oscillating indicator that varies over time with a band. This is both a momentum as well as a trend-following indicator. The MACD fluctuates above and below zero, above and below a centerline. A basic MACD strategy is looking at which side of the zero the MACD lines are on.
- Relative Strength Index (RSI)
This is another oscillating indicator acting as a metric for the price change. This indicator oscillates between 0 and 100. Traders advert the signs when they look for divergence and also when the indicator crosses over the centerline. The traders see the price as overbought when the indicator is above 70. And they see it as oversold when the indicator is below 30.
- On-Balance-Volume (OBV)
OBV takes a substantial amount of volume information and compiles that into one single one-line indicator. This measures the cumulative selling and buying pressure by adding the volume on the ‘up’ days and similarly, subtractive the volume on the ‘down’ days.
Is the Advance-decline Line indicator the most popular Market Breadth Indicator?
Yes, the Advance-decline indicator is among the most popular, reputable, and widely used market breadth indicators. The AD Line is frequently used by traders and analysts to assess the strength of a market trend by comparing the number of advancing stocks against those that are dropping.
Is Advance-decline Line accurate?
The accuracy of the Advance-Decline Line (AD Line) as a technical indicator is affected by a number of factors, including the data utilised, the time range examined, and market circumstances.
The AD Line is often regarded as a trustworthy indication of market breadth and can give important insights into market dynamics. The AD Line can show if the market is experiencing broad-based strength or weakness by comparing the number of advancing stocks against falling stocks.
Nevertheless, the AD Line, like any technical indicator, is not always reliable and should be used in conjunction with other tools and approaches to validate market trends and probable entry and exit locations. It’s also worth noting that the AD Line is a lagging indicator, which means it may not give real-time information on market changes.
Ultimately, the accuracy of the AD Line as a technical indicator is determined by how and in what context it is utilised. To make educated investing selections, traders should thoroughly analyse their trading methods and aims, as well as employ different indicators and other tools.
What is the difference between Advance-decline Line and the Advance-decline Line ratio?
The advance-decline line or A/D line is a technical indicator that analyses the difference between the number of advancing as well as declining stocks daily. The A/D line indicator is cumulative with one positive number being added to the prior number or it is subtracted from the prior number if the number is negative. This line shows the market sentiments and tells the traders whether more stocks are rising or falling.
The advance-decline ratio, on the other hand, is the technical analysis of the stock market trends. It is calculated by dividing the number of advancing shares by the number of declining shares. It can be calculated on different periods like one month, one week, or one day. The advance-decline ratio, on a standalone basis, reveals whether the market is overbought or oversold. Looking at the trend of the A/D ratio reveals whether the market is in a bullish or bearish trend.


 Previous Article


![15 Investing.com Alternatives [Free+Paid] You Should Use in 2026](https://www.strike.money/wp-content/uploads/2026/04/Investing.com-Alternatives.jpg "15 Investing.com Alternatives [Free+Paid] You Should Use in 2026 4")
![15 TradeStation Alternatives [Free+Paid] You Should Use in 2026](https://www.strike.money/wp-content/uploads/2026/04/TradeStation-Alternatives.jpg "15 TradeStation Alternatives [Free+Paid] You Should Use in 2026 5")
![15 Chartink Alternatives [Free+Paid] You Should Use in 2026](https://www.strike.money/wp-content/uploads/2026/04/Chartlink-Alternatives.jpg "15 Chartink Alternatives [Free+Paid] You Should Use in 2026 6")
: Overview, 10 Types of Indicators, Settings for Different Markets 8")

 : Definition, Formula, calculation, Uses, Advantages Vs limitations 10")


No Comments Yet.