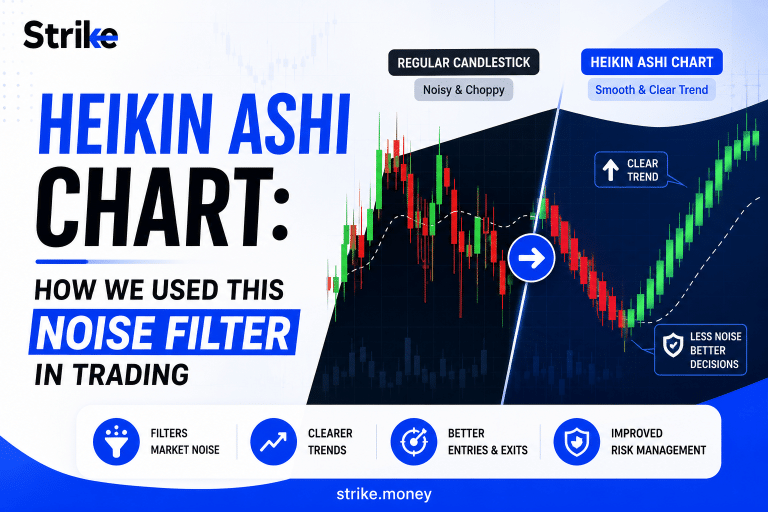
Heikin Ashi is a Japanese charting technique that smooths price movement by using averaged price data. Traders use Heikin Ashi to reduce market noise and read trends more clearly.
The main value of Heikin Ashi is trend clarity. Green candles with small or no lower shadows often show a strong uptrend. Red candles with small or no upper shadows often show a strong downtrend. Small candles with shadows on both sides usually show indecision or possible reversal.
This guide explains what Heikin Ashi means, how its formula works, how to read Heikin Ashi candles, how to trade with them, how they compare with regular candlesticks, and where traders should be careful.
What is Heikin Ashi?
Heikin Ashi is a type of charting method in technical analysis known for its smooth price movement and clear market trend identification. It reduces market noise and suggests a clear pitcher of market trend by calculating average price instead of plotting the exact market prices like traditional candlestick charts. The word Heikin Ashi comes from the Japanese word Heikin means “average” and Ashi means “bar” or “candlestick”.
Heikin Ashi is a Japanese charting method that means “average bar” or “average pace.” It comes from Japanese candlestick analysis, which is widely associated with 18th-century rice trader Munehisa Homma. Heikin Ashi uses averaged price values to create smoother candles than traditional candlestick charts.
Heikin Ashi looks like a normal candlestick chart, but it calculates each candle differently. A regular candlestick shows the actual open, high, low, and close. A Heikin Ashi candle uses modified open, high, low, and close values based on the current and previous candle.
In trading, Heikin Ashi is not a candlestick pattern. It is a chart type that helps traders see trend direction and trend strength with less noise.
How Does Heikin Ashi Work?
Heikin Ashi works by averaging current price data with previous Heikin Ashi candle data. This calculation smooths price movement and makes trends easier to see.

Regular candlesticks can change colour often during small pullbacks. Heikin Ashi reduces this noise by creating smoother candle sequences. This helps traders stay in a trend longer instead of reacting to every small red or green candle.
Heikin Ashi prices look different because they are calculated values. The Heikin Ashi close is an average of the current candle’s open, high, low, and close. The Heikin Ashi open is based on the previous Heikin Ashi open and close. This is why traders should not use Heikin Ashi alone for exact entry price, stop-loss price, or order placement.
Heikin Ashi Formula
Heikin Ashi candles are calculated using modified OHLC values. The 4 main formulas are below.
- HA Close = (Open + High + Low + Close) / 4
Heikin Ashi Close is the average of the current candle’s open, high, low, and close. - HA Open = (Previous HA Open + Previous HA Close) / 2
Heikin Ashi Open is calculated from the previous Heikin Ashi candle. This makes the chart smoother. - HA High = Max(High, HA Open, HA Close)
Heikin Ashi High is the highest value among the actual high, Heikin Ashi open, and Heikin Ashi close. - HA Low = Min(Low, HA Open, HA Close)
Heikin Ashi Low is the lowest value among the actual low, Heikin Ashi open, and Heikin Ashi close.
These formulas make Heikin Ashi candles smoother than regular candles. They also create one important limitation. Heikin Ashi candles do not always match the real market open and close prices.
How to Read Heikin Ashi Candles
Heikin Ashi candles are read through colour, wick structure, body size, and candle continuity.

A series of green Heikin Ashi candles usually shows an uptrend. Green candles with little or no lower shadow show stronger buying pressure. Traders read this as a sign that buyers remain in control.
A series of red Heikin Ashi candles usually shows a downtrend. Red candles with little or no upper shadow show stronger selling pressure. Traders read this as a sign that sellers remain in control.
Small-bodied candles with upper and lower shadows show indecision. These candles often appear when a trend is slowing, pausing, or preparing for a possible reversal.
The basic reading is simple.
- Green candle with no lower wick: Strong uptrend.
- Red candle with no upper wick: Strong downtrend.
- Small candle with both wicks: Indecision or reversal warning.
- Colour change after a long trend: Possible trend shift.
- Consecutive same-colour candles: Trend continuation.
Heikin Ashi is useful because it makes trend strength visible. Traders can quickly see whether the market is trending smoothly or losing momentum.
What is Heikin Ashi Buy and Sell Signals?
Heikin Ashi buy and sell signals are based on candle colour, wick structure, and trend context.
A common buy signal appears when Heikin Ashi candles turn green after a decline or pullback. The signal becomes stronger when green candles have little or no lower wick.
A common sell signal appears when Heikin Ashi candles turn red after a rally or uptrend. The signal becomes stronger when red candles have little or no upper wick.
A reversal warning appears when small-bodied candles form with upper and lower shadows. This shows indecision and possible trend exhaustion.
Use these signals with confirmation. Support-resistance, trendlines, moving averages, RSI, MACD, and volume can help filter weaker signals.
Pros & Cons of Trading with Heikin Ashi
| Pros of Trading with Heikin Ashi | Cons of Trading with Heikin Ashi |
| Reduces market noise by smoothing small price fluctuations. | Does not show actual open and close prices because candles use calculated values. |
| Shows trend direction clearly through continuous green or red candles. | Can lag behind real price movement because it uses averaged price data. |
| Helps traders stay in trends longer by filtering minor pullbacks. | May delay entries and exits during fast reversals. |
| Makes trend strength easier to read when candles have little or no opposite-side wick. | Can hide price gaps, especially in stocks. |
| Works across markets such as stocks, forex, crypto, commodities, and indices. | Is not ideal for precise stop-loss placement because actual price levels may differ. |
| Supports beginners by making charts visually cleaner. | Can give false signals in sideways markets where trends lack direction. |
| Combines well with indicators like EMA, RSI, MACD, VWAP, volume, and support-resistance. | Should not be used alone as a complete buy or sell system. |
How to Trade Using Heikin Ashi
Trade Heikin Ashi by using it as a trend filter first. Do not use it as a blind buy or sell system.

First, identify the trend direction. Consecutive green candles show bullish pressure. Consecutive red candles show bearish pressure.
Secondly, check the wick structure. Green candles with no lower wick show a stronger uptrend. Red candles with no upper wick show a stronger downtrend.
Thirdly, enter only after trend continuation is visible. For a long trade, traders may enter when green candles continue after a pullback. For a short trade, traders may enter when red candles continue after a weak recovery.
Fourthly, watch for exit signs. Small candles with wicks on both sides show indecision. A colour change after a long trend can warn traders to exit or reduce the position.
Finally, use the actual price chart for stop-loss. Heikin Ashi prices are averaged, so they should not be used blindly for order placement.
Long trade logic
A long setup forms when Heikin Ashi candles turn green, stay green for multiple sessions, and show little or no lower wick. The signal becomes stronger when price also trades above support, moving averages, or breakout levels on the regular chart.
Short trade logic
A short setup forms when Heikin Ashi candles turn red, stay red for multiple sessions, and show little or no upper wick. The signal becomes stronger when price breaks support or stays below a falling moving average.
4 Heikin Ashi Trading Strategies We Use at Strike Money
Heikin Ashi works best when traders use it with a clear strategy. The common strategies we use are mentioned below.

1. Trend-following strategy
This is the most common Heikin Ashi strategy. Traders stay long during consecutive green candles and stay short during consecutive red candles.
A strong uptrend has green candles with small or no lower shadows. A strong downtrend has red candles with small or no upper shadows.
2. Reversal strategy
A reversal signal appears when candle colour changes after an extended trend. A green-to-red shift after a long rally can warn of weakness. A red-to-green shift after a long fall can suggest recovery.
This strategy needs confirmation because Heikin Ashi can lag.
3. Pullback strategy
A pullback strategy waits for the trend to pause and resume. In an uptrend, traders wait for small candles or brief red candles, then enter when green candles return. In a downtrend, traders wait for weak green candles, then enter when red candles return.
4. Breakout strategy
A breakout strategy combines Heikin Ashi with support and resistance. Traders look for a breakout on the regular chart and use Heikin Ashi to confirm trend continuation.
Best Indicators to Use with Heikin Ashi
Heikin Ashi becomes stronger when traders combine it with confirmation tools. The best indicators depend on the trading style.
Moving Averages
Moving averages help confirm trend direction. The 20 EMA can help short-term traders. The 50 EMA can help swing traders. A Heikin Ashi green trend above a rising EMA is stronger than a green trend below a falling EMA.
Relative Strength Index (RSI)
Relative Strength Index (RSI) helps identify momentum and overbought-oversold zones. Heikin Ashi with RSI can help traders avoid buying weak momentum or shorting oversold conditions.
Moving Average Convergence Divergence (MACD)
Moving Average Convergence Divergence (MACD) helps confirm trend momentum. It works well with Heikin Ashi when traders want to confirm trend continuation or weakening momentum.
Bollinger Bands
Bollinger Bands help identify volatility and price extremes. Heikin Ashi signals near band edges can help traders study reversals or continuation setups.
Volume
Volume confirms participation. A Heikin Ashi trend with rising volume is more reliable than a smooth candle sequence with weak participation.
Support and Resistance
Support and resistance remain essential. Heikin Ashi becomes more useful when its signals appear near important chart levels.
How to Use Heikin Ashi for Intraday Trading
Heikin Ashi can be used for intraday trading on 5-minute, 15-minute, and 1-hour charts. It helps day traders avoid reacting to every small candle change.
Intraday traders often use Heikin Ashi to stay with a trend during the day. A series of green candles can help traders hold long trades. A series of red candles can help traders hold short trades.
Lower timeframes still create false signals. This is why intraday traders should confirm Heikin Ashi with VWAP, volume, opening range, previous day high-low, or regular candlestick price levels.
For day trading, 5-minute and 15-minute charts are popular. The 1-hour chart gives cleaner signals but fewer trades.
How to Use Heikin Ashi for Swing Trading
Heikin Ashi is popular for swing trading because it filters short-term noise. Swing traders often use daily or 4-hour charts to follow trends for several days or weeks.
A swing trader may hold a long trade while Heikin Ashi candles remain green. The trader may exit or reduce the position when candles become smaller, wicks appear on both sides, or the colour changes from green to red.
Swing traders should not rely only on candle colour. They should check the regular price chart, trendline, moving average, support-resistance, and volume before entering or exiting.
Daily Heikin Ashi charts usually provide cleaner swing signals than very short intraday charts.
Heikin Ashi vs Renko vs Regular Candlesticks
Heikin Ashi, Renko, and regular candlesticks all show price movement, but they show it in different ways.
| Chart Type | What It Shows | Best Use | Limitation |
| Heikin Ashi | Averaged candles | Trend smoothing | Does not show exact OHLC |
| Renko | Price movement by fixed box size | Filtering time-based noise | Can hide timing and real price action |
| Regular Candlesticks | Actual OHLC prices | Entries, exits, gaps, price action | More noise |
Heikin Ashi is better for smooth trend tracking. Renko is better for filtering small price fluctuations based on box size. Regular candlesticks are better for exact market prices and precise trading decisions.
For trend trading, Heikin Ashi and Renko can both help. For order execution, regular candlesticks are more reliable.
Is Heikin Ashi better than Candlestick?
Heikin Ashi is better for trend clarity. Traditional candlesticks are better for exact price action, entries, exits, gaps, and stop-loss planning.
How Accurate is Heikin Ashi?
Heikin Ashi accuracy depends on the market, timeframe, rules, and confirmation tools. It works better in trending markets and weaker in sideways markets.
Heikin Ashi smooths price movement, so it helps traders read trend continuation but can delay reversals. Investopedia notes that it helps identify trends and reversals, but does not show real-time prices and works better with other indicators.
Backtests show mixed results. “A Simple, Profitable Heikin-Ashi Trading System” by Mark Ursell of Tradinformed tested Heikin Ashi on EUR/USD 4-hour charts from 2000–2014 with MACD confirmation. TradeAlgo’s 12-year backtest across 200 liquid stocks reported a 59% win rate and 2.34 profit factor using Heikin Ashi with a moving-average filter, but the named author could not be verified from a primary page.
Heikin Ashi does not repaint after a candle closes. The live candle can change until closing. It can be profitable inside a tested framework, but becomes weak when traders use colour changes alone.
Common Mistakes Traders Make with Heikin Ashi
Heikin Ashi makes trends look cleaner, but this smoothness can also mislead traders. Most mistakes happen when traders forget that Heikin Ashi is a trend-reading chart, not an execution chart.
1. Trading the “phantom price”
The biggest mistake is placing orders from Heikin Ashi candle prices. The open and close on a Heikin Ashi candle are calculated values, not actual traded prices. A green Heikin Ashi candle may show a close at ₹1,500, while the real market price may be different.
Use Heikin Ashi for trend bias. Use regular candlesticks or the order book for entry, exit, stop-loss, and target placement.
2. Ignoring invisible gaps
Heikin Ashi can smooth out gaps because it modifies open and close prices. This can hide important moves caused by earnings, overnight news, global events, or weekend gaps.
Always check the regular candlestick chart before taking a trade, especially in stocks and indices where gaps matter.
3. Using Heikin Ashi for fast scalping
Heikin Ashi can lag on 1-minute and 5-minute charts. By the time the candle changes colour, a large part of the move may already be over.
Scalpers should use Heikin Ashi only as a quick trend filter. Actual entries should come from raw price action, VWAP, volume, and support-resistance.
4. Following colour changes blindly
A red-to-green change does not always mean buy. A green-to-red change does not always mean sell. Sideways markets can create repeated colour changes and false signals.
Confirm the signal with trend direction, key levels, volume, and momentum indicators.
5. Placing stop-loss on Heikin Ashi levels
Heikin Ashi highs and lows can differ from actual price behaviour. A stop-loss based only on Heikin Ashi candles may sit at the wrong level.
Place stop-loss using actual swing highs, swing lows, support, resistance, or Average True Range (ATR) on the regular price chart.
How to Backtest a Heikin Ashi Strategy
Backtest a Heikin Ashi strategy before using it in live trades. A backtest shows whether the rules actually work on historical data.
Use these steps.
- Define the strategy. Buy when Heikin Ashi turns green above the 50 EMA. Exit when it turns red.
- Choose the asset and timeframe. Example: Nifty 50 stocks on daily charts for 5 years.
- Set entry rules. Define whether entry happens on colour change, breakout, EMA confirmation, or candle close.
- Set exit rules. Define whether exit happens on colour change, fixed risk-reward, trailing stop, or support-resistance.
- Use actual prices for execution. Use real candlestick OHLC prices for entries, exits, and stop-loss testing.
- Record key metrics. Track win rate, profit factor, average profit, average loss, maximum drawdown, and average risk-reward.
- Compare with regular candlesticks. Check whether Heikin Ashi improves the strategy or only makes the chart look smoother.
- Test out-of-sample data. A strategy is more useful when it works beyond one selected period.
A good Heikin Ashi backtest uses fixed rules. Changing rules after seeing results creates false confidence.
Is Heikin Ashi good for Beginners?
Heikin Ashi is good for beginners because it makes trends easier to see. Beginners should still learn regular candlesticks because Heikin Ashi does not show exact prices.
Does Heikin Ashi show the Real Price?
Heikin Ashi does not show exact real open and close prices. It uses calculated values based on current and previous candle data.
Is Heikin Ashi Lagging?
Heikin Ashi is lagging because it smooths price using averages. This helps reduce noise but may delay entries and exits.
What timeframe is Best for Heikin Ashi?
Choosing the right timeframe is essential for success; daily and 4-hour charts work well for swing trading. In contrast, a shorter timeframe like the 5-minute or 15-minute chart can work for intraday trading when combined with VWAP, volume, and actual price confirmation.


 Previous Article


![15 Investing.com Alternatives [Free+Paid] You Should Use in 2026](https://www.strike.money/wp-content/uploads/2026/04/Investing.com-Alternatives.jpg "15 Investing.com Alternatives [Free+Paid] You Should Use in 2026 52")
![15 TradeStation Alternatives [Free+Paid] You Should Use in 2026](https://www.strike.money/wp-content/uploads/2026/04/TradeStation-Alternatives.jpg "15 TradeStation Alternatives [Free+Paid] You Should Use in 2026 53")
![15 Chartink Alternatives [Free+Paid] You Should Use in 2026](https://www.strike.money/wp-content/uploads/2026/04/Chartlink-Alternatives.jpg "15 Chartink Alternatives [Free+Paid] You Should Use in 2026 54")
: Overview, 10 Types of Indicators, Settings for Different Markets 55")


 : Definition, Formula, calculation, Uses, Advantages Vs limitations 58")


No Comments Yet.