The Williams %R Indicator, also known as Williams Percentage Range or simply Williams R, is a popular momentum indicator in technical analysis. Williams %R Indicator was developed by Larry Williams, a renowned commodities trader.
The indicator primarily focuses on identifying overbought and oversold market conditions, offering traders valuable insights into potential reversal points in price movements.
It is a momentum oscillator that shows the current closing price in relation to the high-low range over a certain period of time, usually 14 days. Williams %R identifies trading opportunities when an asset is trading at extreme levels, indicating a potential chance of reversal is likely. It is often used to confirm trends and spot divergences that lead to corrections.
Here is an quick video analysis of William %R indicator.
We will explore the Williams %R indicator in depth, including how it is calculated, how it is used in trading, its advantages and limitations, and how to combine it with other indicators for the best results.
What does the Williams %R Indicator indicate?

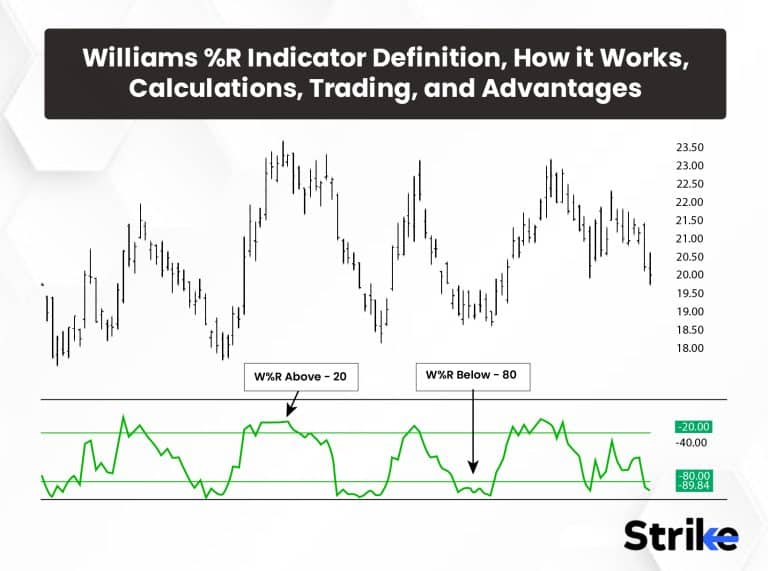
Williams %R Indicator’s primary function is to identify overbought and oversold conditions in the market, offering traders an insight into the possible turning points in price action. The Williams %R Indicator is a momentum oscillator that moves between 0 and -100. It measures the momentum of a price, comparing the stock’s closing price to the range of its prices over a predetermined time period, typically 14 periods.
Its values are inverted to see the oversold and overbought situations in a more typical way. The Williams %R takes the highest high and subtracts it from the closing price, taking the result and dividing it by the highest high minus the lowest low. High readings (above -20) could indicate that the market is overbought, while low readings (below -80) might signal that the market is oversold.
What is the other term for Williams’s %R?
The other term for Williams %R is “Williams Percentage Range.“
Who developed the Williams %R Indicator?
The Williams %R Indicator is developed by Larry Williams, the famed trader. Larry, a man who has been called one of the absolute greats of technical analysis, has been a force in the world of commodity and stock trading for multiple decades. His brand of thinking, and brand of trading, alongside his experience and keen market understanding, have led to many indicators, with the Williams %R being one that absolutely rises to the top.
How does Williams %R work?
The Williams %R Indicator works by comparing a particular closing price of a security to the high and low prices over a specified period, typically 14 periods. The outcome is then used to measure whether the script is overbought or oversold. It measures the level of the close relative to the range of a specified number of prior trading periods. The close is at the top of the range means the indicator reads close to 0. The close is at the bottom of the range means the indicator reads close to -100. The chart uploaded below is a daily time frame chart of banknifty on which Williams %R is applied. The rectangular boxes represent the intersection of overbought or oversold regions in the indicator versus the price of the script.

How important is the Williams %R Indicator in Technical Analysis?
Williams %R Indicator in Technical Analysis is important because it provides insights for making informed decisions. It helps identify potential reversal points in trends by generating overbought and oversold readings. The chart uploaded below is of Banknifty’s Daily time frame. And Williams %R is applied on the chart. Look how divergences are observed and potential trend reversal from bearish to bullish side got kicked in. In some instances, when prices were hovering at 48000 level, williams %R kept giving early signs of an overbought region and potential chance of bearish side upcoming. Also note that the indicator may generate false signals also, thus multiple indicators and tools should be combined to solidify a view.

What is the formula for Williams’s %R?
The formula for the Williams %R Indicator is
Williams %R = (Highest High – Close)/(Highest High – Lowest Low) * -100
Highest High refers to the highest price achieved in the look-back period, typically over 14 periods. Close is the most recent closing price. Lowest Low refers to the lowest price traded during the same look-back period.
How to calculate Williams’s %R?
The first step is to decide on the look-back period. The standard period used by Larry Williams, the developer of this indicator, is 14, but traders will be able to adjust this to align with their trading strategies.
Over your chosen period, identify the highest high. In the Indian stock market, for example, if you’re looking at Reliance Industries over a 14-day period, you would identify the highest price that the stock reached during this period.
Calculate the Lowest Low: Similarly, identify the lowest low over the same period.
Calculate Today’s Closing Price: Determine the closing price for the current day.
Plug These Values into the Formula: Williams %R = [(Highest High – Today’s Close) / (Highest High – Lowest Low)] * -100
The Williams %R oscillates between 0 and -100. A reading above -20 is typically considered overbought, meaning the asset’s price soon declines, while a reading below -80 is considered oversold, suggesting that the price soon increases.
The calculation part remains a theoretical and mathematical concept; as the indicator is available for free in all the charting platforms like tradingview, strike.money etc.
What time-frame is best for trading Williams’s %R?
The most common time-frame is best for trading Williams %R is 14 days. Examining the Williams %R across multiple time periods provides valuable insight into both short-term and long-term trends and potential reversals.
How can the Williams %R be used in combination with other Indicators?
One of the most frequently employed combinations is Williams %R with Moving Average Convergence Divergence (MACD). MACD is a trend-following momentum indicator which displays changes in strength, direction, momentum and duration of a trend in stock price movements. Williams %R indicates overbought or oversold conditions and MACD provides confirmation signals in either direction often strengthening these indications and increasing the accuracy of trader predictions.
The chart uploaded below is of Banknifty’s Daily time frame. Both the indicators are applied. The black boxes and vertical blue line represents the intersection of price, MACD and Williams %R showing significant signals simultaneously. The signals from MACD and Williams %R can be combined to solidify a trading plan. This is how high probability trading setups can be identified by combining multiple indicators and tools.

Williams %R is often combined with Bollinger Bands as an additional volatility indicator. These bands use simple moving averages as the central line, while their outer lines represent standard deviations away from it. Coupled with Williams’s %R and price action touching one or both upper or lower bands it could signal potential price reversals.
Additionally, the Williams %R is often combined with the Stochastic Oscillator. Both oscillators serve as range-bound momentum oscillators using slightly different calculations. Stochastic measures how close prices compare to their range over a specific time frame whereas Williams measures whether closes match high/low ranges. when both oscillators fall within overbought or oversold territory it could indicate stronger evidence for potential price reversals.
Below is an attached example of Williams %R and Stochastic giving a clean indication for upside.

Although combining the Williams %R with other technical indicators brings advantages, traders should keep in mind that no indicator is infallible. each has limitations and generates false signals. Therefore, using Williams %R alongside other indicators should not be seen as a surefire path to successful trading but instead, serve as a tool that helps inform more informed decisions.
Can Williams %R work well with Fibonacci Retracements?
Yes, the Williams %R indicator works well with Fibonacci Retracements. Both indicators can complement each other in a trading strategy. The Williams %R indicator identifies potential overbought and oversold levels, signaling possible price reversals. Meanwhile, Fibonacci Retracements provide possible support and resistance levels based on historical price action. By combining both, traders can find high-probability entries and exits.
For instance, a trader looks for a situation where the price is at a key Fibonacci level and the Williams %R indicates an overbought or oversold condition. This could suggest the price is likely to reverse, providing an opportunity to enter or exit a trade. Below is an example of a trade that showed likelihood of an upside after williams %R showing signs of bouncing from the oversold region. At the same time, price managed to take support from critical fibonacci ratios like 61.8% and 50%. This is how a plan is strengthened by combining multiple tools and indicators to take high probability trade setups.

Can Williams %R work in conjunction with Bollinger Bands?
Yes, Williams %R and Bollinger Bands work well together. Williams %R and Bollinger Bands are two indicators used to detect overbought or oversold conditions, respectively. Using them together helps you get stronger reversal signals when both indicators reach extremes; for example, Williams %R dropping below -80 (oversold) while the price reaches the lower Bollinger Band at once signasl that an upward reversal is imminent as both indicators confirm each other – the Williams %R signal being confirmed by Bollinger Band.

What is the success rate of the Williams %R Indicator?
The success rate of the Williams %R indicator depends on the trading strategy and time frame used. On average, Williams %R can accurately predict overbought and oversold levels around 70-80% of the time. But no indicator is 100% accurate, so Williams %R should always be used in combination with other technical analysis tools for optimal results.
Can Williams’ %R be used in a Stock Market?
Yes, the Williams %R indicator is indeed used in the stock market, to gauge momentum and identify potential buy or sell signals. By analyzing the position of a stock’s closing price in relation to its high-low range over a specific period, this indicator provides insights that are valuable for traders navigating the stock market‘s fluctuations.
What are examples of Williams’s %R used in trading?
One of the most common applications of the Williams %R indicator in the Indian market is to identify overbought and oversold levels. By indicating potential overbought or oversold conditions, it helps traders predict price reversals for profitable trading opportunities.
Williams%R can be useful in trading and the stocks should be identified based on certain conditions of their respective Williams %R profile. For example, williams %R above or below -20, -50 and -80 level. Or williams %R crossing above and crossing below -20, -50 and -80 levels.
Strike.money is one of a kind scanner that scans all the stocks based on the conditions users can select.
In the image below, Strike.money has sorted and presented the list of stocks that are indicating the Williams %R above -20 level. The scanner enables users to sort the list based on hourly, daily, weekly and monthly time frames.


Strike.money enables users to select appropriate time frames and above mentioned conditions like Above, Below, Crossing above and Crossing below important levels like -20, -50 and -80. It is extremely useful to find stocks this way to save analysis time and focus on finding the right fit for the trade setup accordingly.
Another popular use of the Williams %R indicator is to trade divergences. This is when the price of a stock and the Williams %R indicator are moving in opposite directions. Traders use divergences to identify potential trend reversals. Chart uploaded below is an example of how the bullish divergence is observed on the chart; where the price of the script named banknifty formed Lower Lows and Williams %R shows higher lows to suggest the bullish momentum may kick in to respect the bullish divergence reflected by arrows. Candlestick patterns and other factors are taken into account to solidify a trading plan towards upside with appropriate risk management.

What are the advantages of Williams %R?
The Williams %R helps market participants make informed decisions by analyzing price movements. Below are five key advantages of the Williams %R indicator and how it significantly improves your trading strategy.
Identification of Overbought and Oversold Conditions
The Williams %R oscillates between 0 and -100, with readings from 0 to -20 considered overbought, and those from -80 to -100 considered oversold. It’s worth noting that these levels are not absolute; they change based on market conditions.
Trading Divergences 1
The Williams %R is also used to spot divergences between the indicator and the asset’s price, which often suggests a potential reversal in the trend. A bullish divergence occurs when the stock price achieves lower lows, while the Williams %R forms higher lows.
Easy to Understand and Use
One of the significant advantages of the Williams %R is its simplicity. The overbought and oversold levels are clearly defined, allowing traders to quickly recognize potential trading opportunities.
Enhances Other Trading Strategies
The Williams %R is not meant to be used in isolation. Instead, it works best when combined with other technical analysis tools, such as trend lines, different time frame analysis, candlestick patterns, price action, moving averages, and support and resistance levels. Used in conjunction with these tools, the Williams %R provide more reliable and robust trading signals.
Effective in Various Market Conditions
The Williams %R is effective in both trending and range-bound markets. In trending markets, the Williams %R help identify potential reversal points, allowing traders to enter or exit trades at the most opportune times. In range-bound markets, the Williams %R help identify overbought and oversold levels, potentially offering profitable trading opportunities.
The Williams %R is a versatile and user-friendly technical analysis tool that significantly enhances a trader’s decision-making process. It’s straightforward to understand and use, provides valuable insights into overbought and oversold conditions, and is used in conjunction with other trading strategies to improve their effectiveness.
What are the disadvantages of Williams %R?
There are certain disadvantages of Williams’s %R indicator as well. Below are six main disadvantages to look out for.
False Signals
Williams %R is known to produce false signals, particularly in range-bound or sideways markets,
Subjectivity
Williams %R levels between -20 and -80 are subjective and need to be adjusted depending on the security or market being traded.
Limited Information
Williams %R measures the relationship between an asset’s closing price and its high-low range over a given timeframe, without taking into account other key variables like volume, market sentiment or macroeconomic trends that have an effect on price movements.
Time Frame Sensitivity
Williams %R success can vary significantly depending on the timeframe chosen. Shorter time frames tend to have higher noise and lower success rates while longer ones provide more reliable signals but offer fewer trading opportunities.
No Standalone Tool
Williams %R should not be used alone as an indicator.
Understanding the above disadvantages doesn’t make Williams %R a bad indicator, but rather enables the trader to strategise accordingly to make maximum profits.
Is the Williams %R considered to be a lagging indicator?
No, the Williams %R indicator is not considered a lagging indicator. Instead, it is categorized as a momentum oscillator, a type of leading indicator. This means it often signals changes in market trends in advance, helping traders predict future price movements. However, like all indicators, its predictions are not 100% accurate and it should be used in conjunction with other technical analysis tools to increase the reliability of the signals it generates.
Does the Williams %R perform poorly in markets with low volatility?
Yes, like most momentum oscillators, the Williams %R can perform poorly in markets with low volatility. This is because these oscillators thrive on price movement and volatility to generate signals. In a low-volatility market, the price movements are minimal, which can result in fewer, less reliable signals. Therefore, it’s always wise to use Williams %R in conjunction with other analysis tools and indicators to improve its effectiveness, especially in low volatility markets.
Can the Williams %R generate false signals in choppy or sideways markets?
Yes, the Williams %R can indeed generate false signals in choppy or sideways markets. This is because it is a momentum oscillator that measures overbought and oversold conditions, which can be misleading in range-bound markets. The indicator may produce numerous false signals when the market lacks a clear trend, suggesting a change in trend direction that doesn’t truly exist. Therefore, it’s crucial to use additional confirmation from other technical analysis tools when trading in choppy or sideways markets.


 Previous Article


![15 Investing.com Alternatives [Free+Paid] You Should Use in 2026](https://www.strike.money/wp-content/uploads/2026/04/Investing.com-Alternatives.jpg "15 Investing.com Alternatives [Free+Paid] You Should Use in 2026 112")
![15 TradeStation Alternatives [Free+Paid] You Should Use in 2026](https://www.strike.money/wp-content/uploads/2026/04/TradeStation-Alternatives.jpg "15 TradeStation Alternatives [Free+Paid] You Should Use in 2026 113")
![15 Chartink Alternatives [Free+Paid] You Should Use in 2026](https://www.strike.money/wp-content/uploads/2026/04/Chartlink-Alternatives.jpg "15 Chartink Alternatives [Free+Paid] You Should Use in 2026 114")
: Overview, 10 Types of Indicators, Settings for Different Markets 115")


 : Definition, Formula, calculation, Uses, Advantages Vs limitations 118")


: How We Used This 70/30 Indicator in 6 High Win-rate Strategies 121")


No Comments Yet.