15 Best Indicators for Intraday Trading That Provide Accurate Buy & Sell Signals

 Author

 Editor
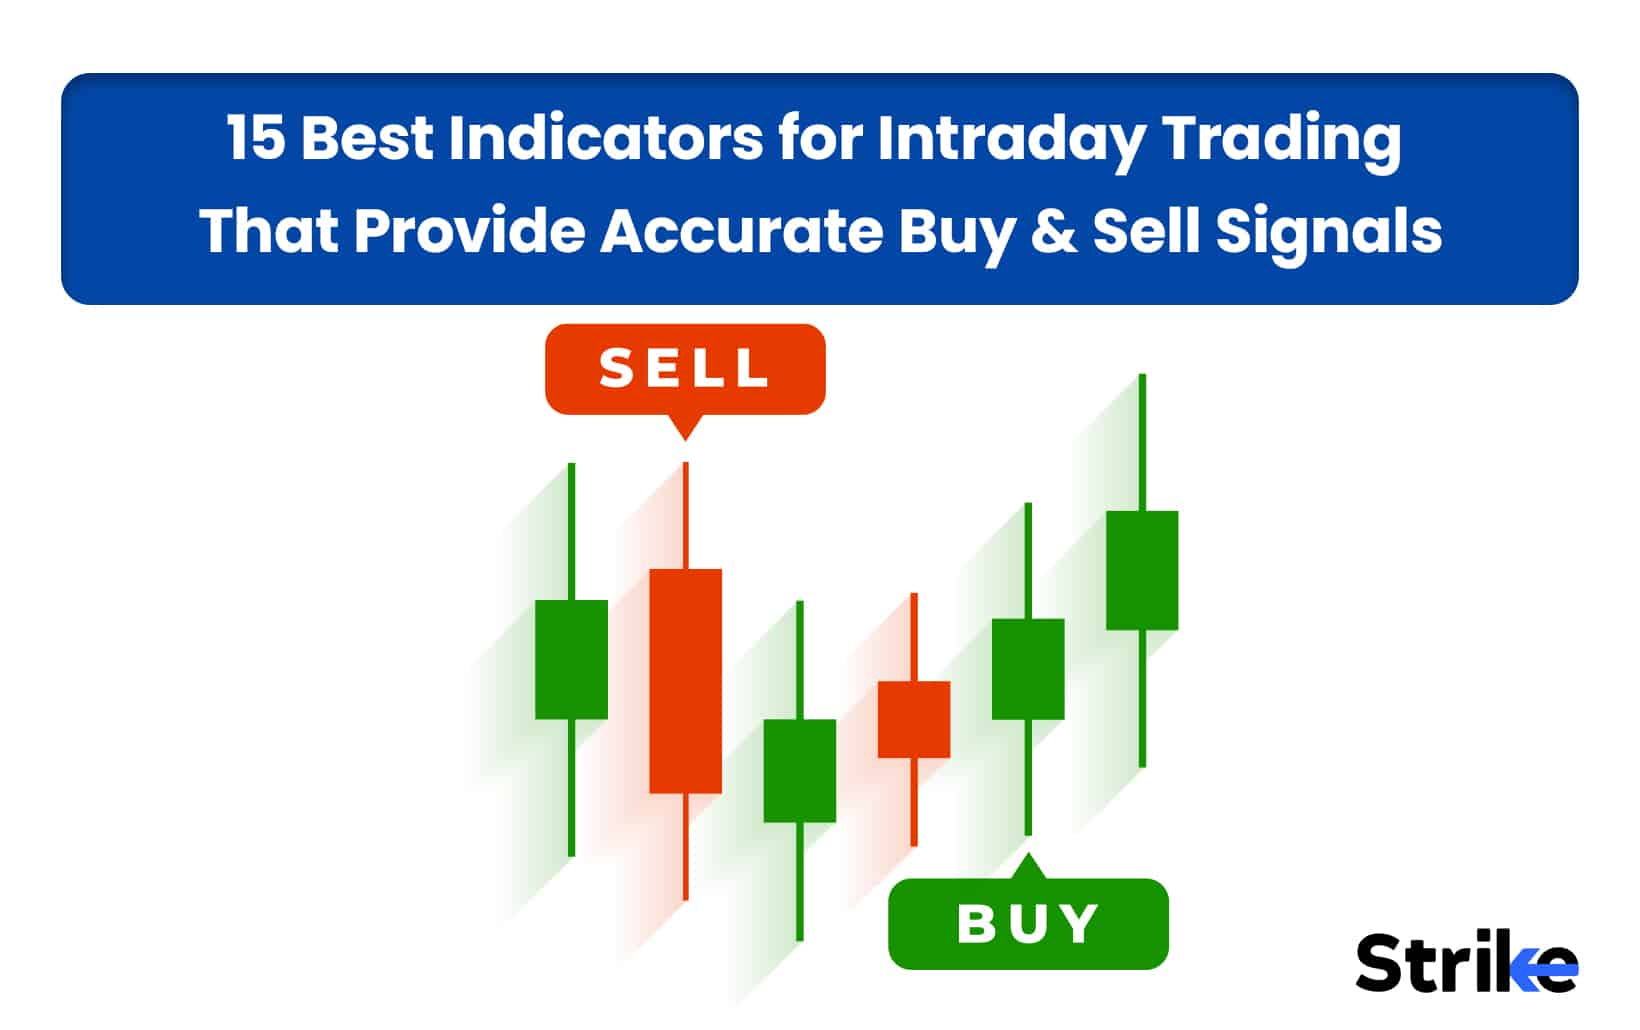
Intraday trading indicators are technical analysis tools mainly used to analyse the behaviour of the market on a shorter timeframe to make buy and sell decisions. Intraday indicator helps you analyse price, volume, volatility, and momentum data to understand market strength, overbought or oversold conditions, and possible reversals.
Every indicator serves a different purpose, like RSI and MACD are used for momentum and moving averages and VWAP are used for trend identification. However, no single indicator is perfect, hence traders use them in combination. By combining indicators from different classes, you can increase the probability of winning. In this blog we are going to discuss 15 commonly used indicators in intraday trading.
Comparison of Best Intraday Trading Indicators
The table given below is the quick comparison of 15 intraday trading indicators.
| Indicator | What It Measures | Type of Signal | Best Use in Intraday | Strengths | Limitations |
|---|---|---|---|---|---|
| Relative Strength Index (RSI) | Momentum oscillator (0–100 scale) | Overbought (>70), Oversold (<30) | Quick entry/exit timing | Simple to use, strong reversal signals | Can give false signals in strong trends |
| Moving Average Convergence Divergence (MACD) | Trend-following momentum | Bullish/bearish crossovers, divergence | Identifying trend shifts | Works well in trending markets | Lagging in sideways/choppy markets |
| Stochastic Oscillator | Compares closing price to price range | Overbought (>80), Oversold (<20) | Spotting intraday reversals | Sensitive, fast signals | Too many false signals without filters |
| Exponential Moving Average (EMA) | Weighted moving average | Trend confirmation & dynamic support/resistance | Setting short-term trend direction (e.g., 9/21 EMA) | Reacts quickly to price changes | More prone to whipsaws than SMA |
| Average Directional Index (ADX) | Trend strength (0–100 scale) | Above 25 = strong trend, below 20 = weak | Confirming if trend is worth trading | Filters out weak trends | Doesn’t show direction, just strength |
| On-Balance Volume (OBV) | Cumulative volume flow | Confirms trend with volume | Spotting trend strength behind moves | Simple, volume-based | Can diverge without immediate effect |
| Volume Weighted Average Price (VWAP) | Average price weighted by volume | Price above VWAP = bullish, below = bearish | Institutional benchmark for day trades | Widely used by pros, solid intraday reference | Resets daily, not for long-term analysis |
| Bollinger Bands | Volatility bands (±2 std dev) | Overbought/oversold, squeeze breakouts | Identifying volatility contractions & breakouts | Adapts to volatility | Can mislead in low-volume markets |
| Market Profile | Distribution of volume by price level | Value area, POC (Point of Control) | Spotting key intraday support/resistance | Great for identifying trading ranges | Complex, requires experience |
| Money Flow Index (MFI) | Price + volume oscillator (0–100) | Overbought (>80), Oversold (<20) | Confirming reversals with volume | Adds volume to RSI logic | Less effective in low-volume stocks |
| Choppiness Index | Degree of market consolidation | High = sideways, low = trending | Avoiding trades in choppy zones | Helps filter false signals | Not predictive, only descriptive |
| Darvas Box Theory | Price channels/boxes | Breakouts above box = buy, below = sell | Intraday breakout strategy | Works well with momentum stocks | Less effective in sideways markets |
| Ichimoku Cloud | Multi-component trend + momentum | Bullish/bearish cloud zones | Intraday trend identification & support/resistance | Comprehensive, combines signals | Complex to interpret for beginners |
| Average True Range (ATR) | Market volatility | Higher ATR = higher volatility | Setting stop-loss levels | Excellent for risk management | Doesn’t show direction, just volatility |
| Cumulative Delta | Net buying vs. selling pressure (order flow) | Positive = buying dominance, negative = selling | Intraday scalping with order flow | Very precise in spotting order imbalances | Requires real-time order flow data |
1. Relative Strength Index (RSI)
RSI is a momentum indicator which measures the speed and magnitude of the price movement on a scale of 0 to 100. This indicator helps traders to identify overbought/oversold zones, finding reversal points, and confirming the trend strength.
Between scale 0 to 100, RSI level 70 and 30 are the most critical levels.
- RSI Above 70: It indicates a strong buying momentum or a potential price reversal to the downside.
- RSI Below 30: It indicates a strong selling momentum or a potential price reversal to the upside.
- RSI Between 50: During this time the market is considered to be neutral or sideways.
RSI indicator is versatile and can be used differently in different market conditions, like trending market, sideways market, and momentum breakout trading. There are four ways to use RSI in intraday trading which is briefly discussed below.
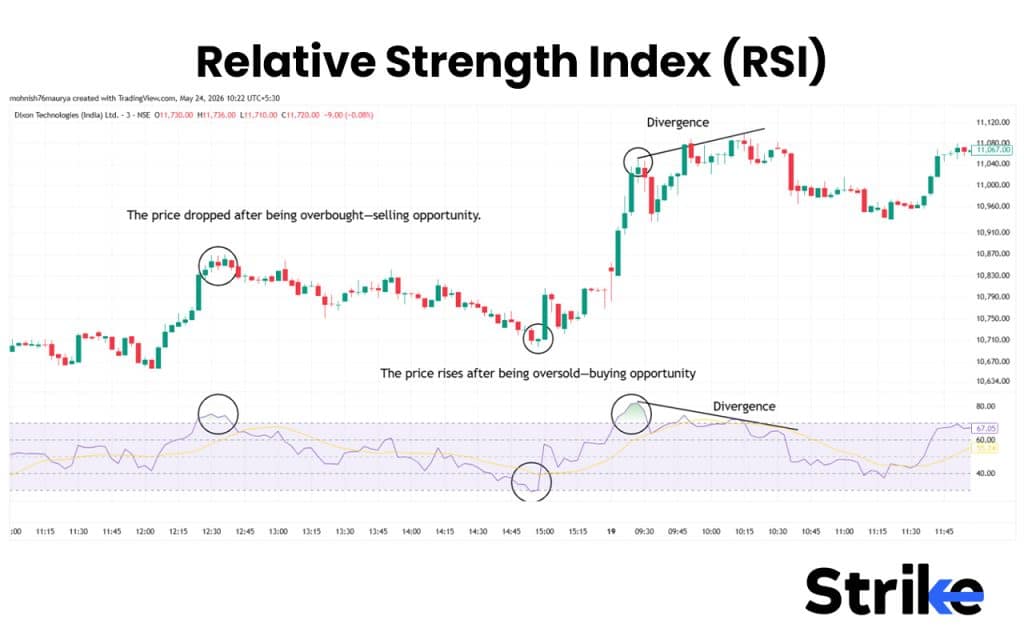
- Oversold Bounce Entry: When RSI falls below 30 due to overextended price fall, price tends to bounce back. This is where traders plan for a long entry to capture the bullish reversal. However, it is important to note that RSI below 30 is not always an automatic buy signal. RSI can stay below 30 for a long period of time if the market is strongly bearish. Hence only enter after a bullish confirmation pattern.
- Overbought Reversal Entry: When RSI rises above 70 due to overextended price rise, price tends to reverse back. This is where trades plan for short entries to capture the bearish reversal after a strong price rise. Trading overbought reversal also involves bearish reversal confirmation patterns before entering the trade, because RSI can stay above 70 for a long period of time in a strong bullish market.
- RSI Divergence: RSI divergence is another way to trade reversals. When price and indicator both move in different directions, it suggests loss of momentum and potential trend reversal. For instance, when the price makes a new high but RSI makes a lower high, it signals loss of bullish momentum and a potential bearish reversal.
- Trend Trading: In a strong bullish trend, RSI stays above 50, where RSI level 40 to 50 acts as a buying zone for trend traders. Whereas, in a strong bearish trend, RSI stays below 50, where RSI 50 to 60 acts as a selling zone.
The default RSI setting is usually 14 periods, but intraday traders often use shorter settings like 7, 9, or 11 for faster signals. A backtest of mean reversion strategy by Larry Connors found win rate between 65%-80%.
| RSI Summary Table | |
|---|---|
| Category | Momentum Oscillator |
| Type | Leading Indicator |
| Best Use | Momentum, Reversal & Trend Strength Identification |
| Market Condition | Range-bound & Moderately Trending Markets |
2. Moving Average Convergence Divergence (MACD)
Moving Average Convergence Divergence (MACD) is a momentum based trend following indicator which combines the trend detection and momentum measurement in a single indicator. Traders widely use this indicator to detect trend, confirm trend, catch momentum breakouts, and reversals.
The MACD indicator is made up of three components which includes MACD line, a signal line, and a histogram. Interaction of these components generates actionable signals for trading which are briefly discussed below.
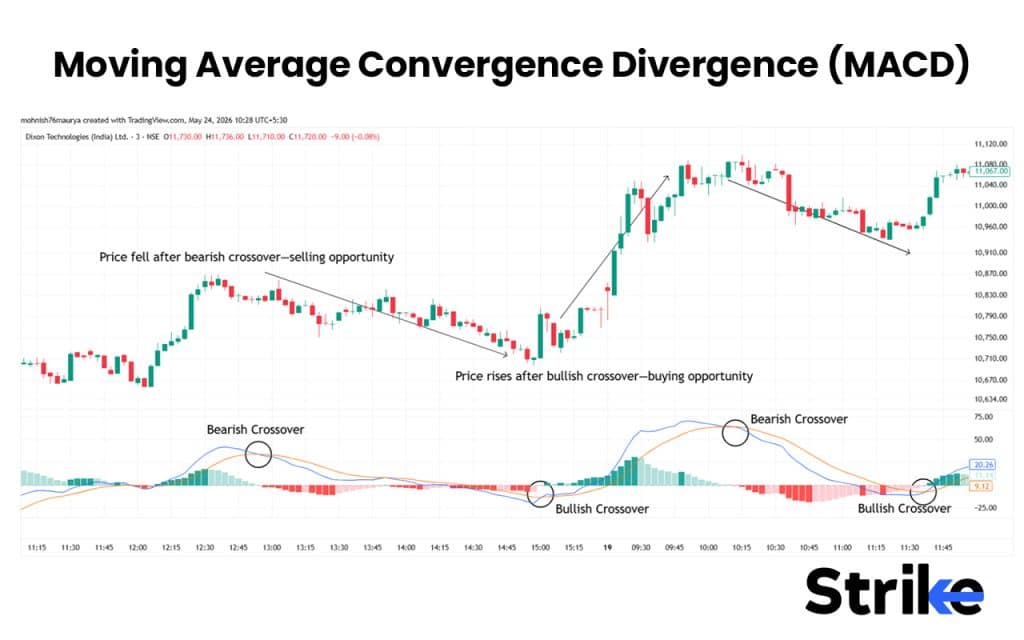
- Bullish Crossover: When the MACD line crosses above the signal line it suggests a bullish momentum shift where traders plan for a long trade. This signal gets stronger when it appears below zero line.
- Bearish Crossover: When the MACD line crosses below the signal line, it suggests bearish momentum shift, where traders look for a sell trade. This signal gets stronger when it appears below zero line.
- MACD Divergence: This helps traders to spot and trade reversals. When price and indicator both move in opposite directions, it suggests loss of momentum and potential shift in trend.
- Histogram: MACD histogram bar helps in understanding the acceleration of the momentum. A large histogram bar indicates strong momentum, whereas a shrieking or short histogram bar indicates weakening of momentum.
A study on equity indices by arXiv showed MACD crossover systems had win rates around 45%–56%, but larger average winning trades created profitability despite lower accuracy. MACD’s real edge lies in his histogram slope and its expansion.
| MACD Summary Table | |
|---|---|
| Category | Trend-Following Momentum Indicator |
| Type | Lagging Indicator |
| Best Use | Trend Direction, Momentum & Crossover Signals |
| Market Condition | Trending Markets |
3. Stochastic Oscillator
A stochastic oscillator is a momentum indicator that measures the security’s closing price to its price range over a specific period, typically 14 days. Stochastic oscillator value bounces between 0 and 100, suggesting overbought and oversold condition. Along with this it also helps identify momentum shift, trend reversals and short-term entry exit points.
Stochastic oscillator consists of two components, %K line (the main momentum line)
and %D line (3 period moving average line of %K line). Crossover of these two lines generate buy and sell signals.
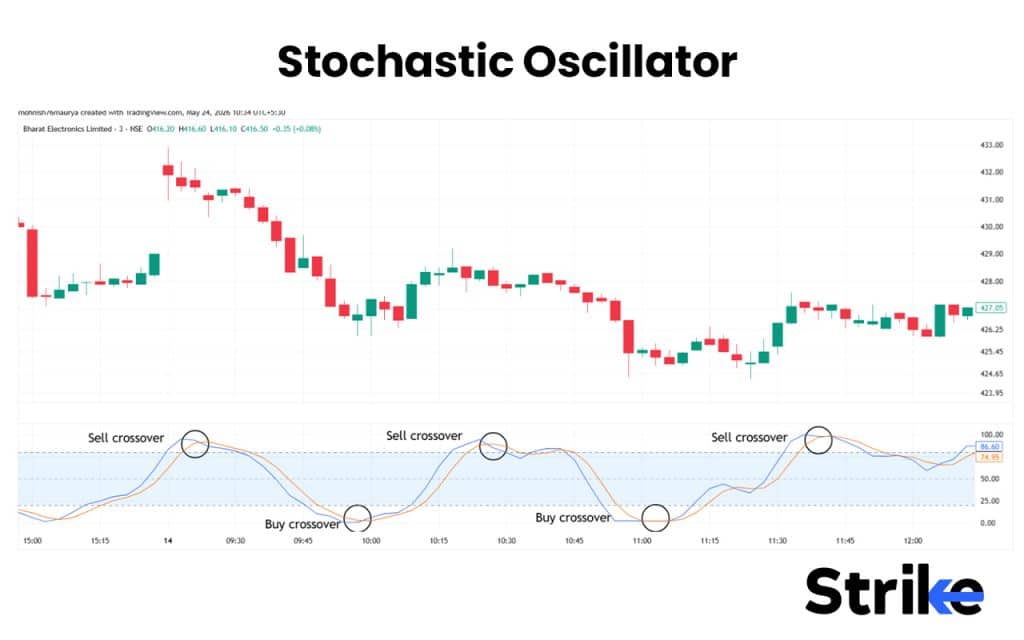
- Buy Signal: When %K line crosses above %D line while stochastic is below 20, it generates buy signal.
- Sell Signal: When %K line crosses below %D line while stochastic is above 80, it generates sell signal.
- Overbought/Oversold condition: Stochastic above 80 suggests overbought condition, while stochastic below 20 suggests oversold condition. This condition suggests potential trend reversals in the market.
- Divergence: When indicator and price moves in different directions, it signals the weakening of momentum and potential trend reversal.
The stochastic performs best in range market with win rate going upto 55-70%, but in trending market performance of stochastic drops.
| Stochastic Oscillator Summary Table | |
|---|---|
| Category | Momentum Oscillator |
| Type | Leading Indicator |
| Best Use | Overbought/Oversold & Reversal Identification |
| Market Condition | Range-bound & Sideways Markets |
4. Exponential Moving Average (EMA)
Exponential Moving Average (EMA) is a trend following indicator that measures the average price of the asset over a specific time period and plots the average price line on the price chart. While calculating average, EMA gives more weightage to recent price change which increases the indicator responsiveness.
EMA is also a versatile indicator which can be used in different ways. There are three different ways to use EMA in day trading, which are briefly discussed below.
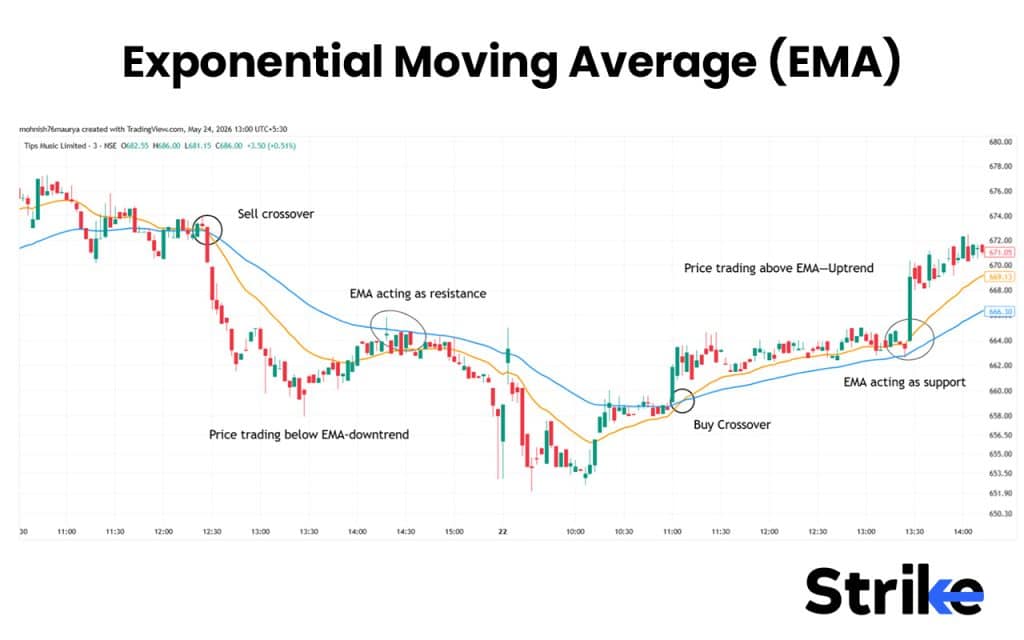
- Trend Identification: When the price is trading above moving average, it is considered as an uptrend, where traders prefer taking only long entries. Whereas, when the price is trading below moving average, it is considered as a downtrend, where traders prefer taking only short entries.
- EMA Cross: EMA cross uses a combination of two EMA of different periods to generate buy and sell signals. When a short period moving average crosses above a long period moving average, it generates a buy signal. When a short period moving average crosses below the long period moving average, it generates a sell signal.
- Support and resistance: EMA acts as a dynamic support and resistance, specially in trending markets, where pullback traders use them for entry. EMA acts as a support during an uptrend while during a down trend EMA acts as a resistance.
EMAs are mostly used for trend identification and momentum shift, instead of buy and sell signals, hence the EMA crossover systems usually have modest win rates around 35%–55% as a buy and sell signal.
| EMA Summary Table | |
|---|---|
| Category | Trend Indicator |
| Type | Lagging Indicator |
| Best Use | Trend Direction, Dynamic Support/Resistance & Pullback Trading |
| Market Condition | Trending Markets |
5. Average Directional Index (ADX)
Average directional index (ADX) is used to measure the strength of the market trend regardless of its direction. Traders use ADX to avoid a sideways market, identify strong trends, and confirm breakout strength. ADX moves between 0 to 100 where ADX above 20 indicates improving trend strength. ADX mainly rises above 20 when either buyers or sellers start dominating the market.
Although ADX only tells us the strength of the trend, but does not tell the direction, the trend can be determined by Directional Movement Indicators (DMI) which comes along with ADX. By combining DMI and ADX, we can use ADX in four different ways in intraday trading.
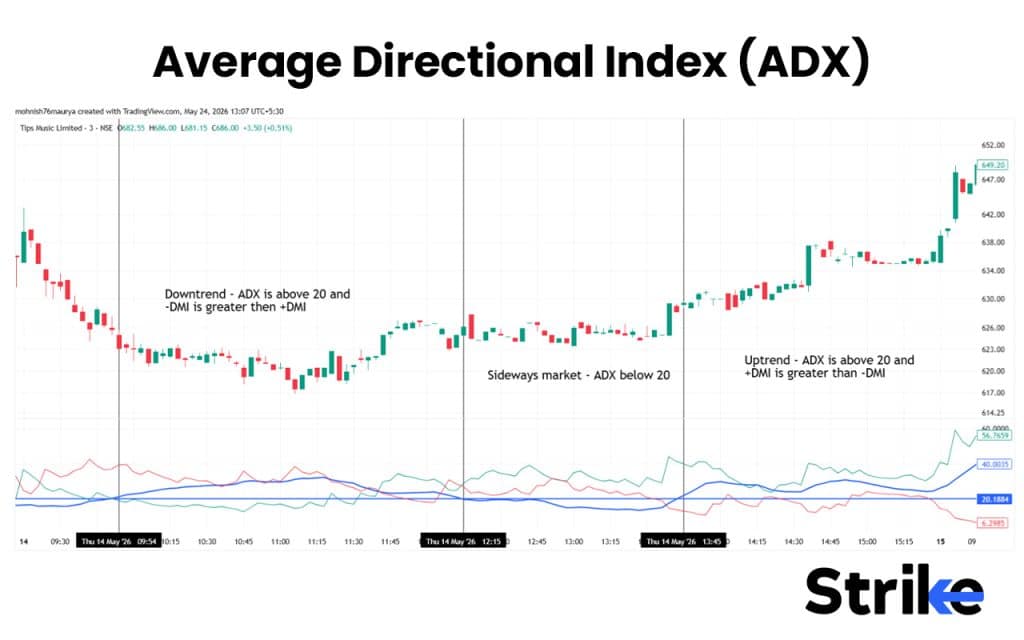
- +DMI and -DMI crossover: Traders use +DMI and -DMI crossover as a buy/sell signal. When the +DMI line crosses above the -DMI line, it gives a buy signal. When the -DMI line crosses above the +DMI line, it gives a sell signal. Note that ADX should be above 20 when the buy and sell signal occurs to avoid false signals in the sideways market.
- ADX Breakout Confirmation: When ADX starts rising above 20 after the break of key support and resistance level, the probability of the trend continuation in the direction of breakout increases.
- ADX Trend Exhaustion: When ADX starts falling after reaching very high levels, it shows the momentum slowdown after which price may consolidate or reverse.
The most important ADX behavior is not high ADX itself but rising ADX from low levels. This transition often signals volatility expansion before major directional moves begin.
| ADX Summary Table | |
|---|---|
| Category | Trend Strength Indicator |
| Type | Lagging Indicator |
| Best Use | Measuring Trend Strength & Identifying Strong Trends |
| Market Condition | Strong Trending Markets |
6. On-Balance Volume (OBV)
On-Balance Volume (OBV) is a volume based indicator that measures and plots a cumulative volume line by adding volume on up days and subtracting volume on down days to understand buying and selling pressure. These indicators help traders to understand accumulation and distribution of smart money, identify the strength behind the trend, and confirm the breakout.
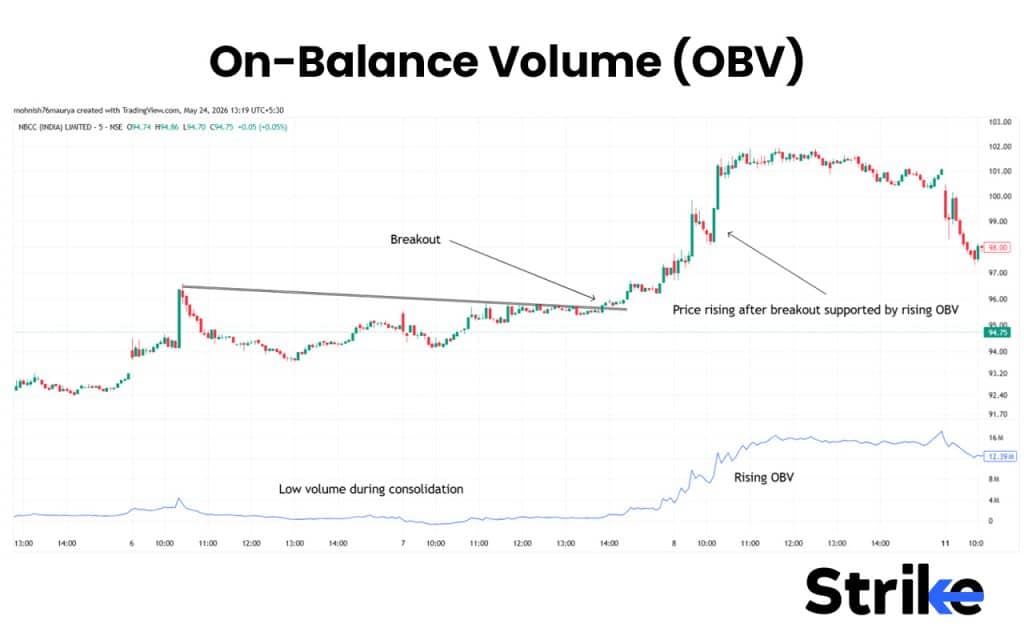
Traders use OBV indicators in trading in four different ways which are briefly discussed below.
- Trend Confirmation: When price rises supported by rising OBV, it confirms the uptrend. Whereas, when price falls along with OBV, it confirms the downtrend.
- OBV DIvergence: When OBV and price both move in opposite directions, it suggests a weakening of momentum. For instance, if the price makes a new high but OBV makes a lower high, it suggests bearish divergence (price will fall after an exhausted uptrend).
- Breakout Confirmation: When OBV rises sharply after breakout, it confirms that the breakout is driven by strong participation. If OBV remains flat after breakout, the breakout may be fake.
- Accumulation and Distribution: OBV is very helpful in finding out hidden accumulation and distribution activity. If OBV rises but the price remains sideways, it suggests a potential accumulation of smart money. If OBV falls while price remains stable, it suggests a potential distribution of smart money.
OBV frequently breaks resistance before price does. This happens because institutional accumulation often appears in volume flow before visible price breakout. Traders therefore use OBV for confirmation and divergence rather than direct entries.
| OBV Summary Table | |
|---|---|
| Category | Volume Indicator |
| Type | Leading Indicator |
| Best Use | Confirming Trend Strength & Detecting Volume Divergence |
| Market Condition | Trending & Breakout Markets |
7. Volume Weighted Average Price (VWAP)
Volume Weighted Average Price (VWAP) is also a volume based indicator that measures the average price of a stock weighted by trading volume. VWAP is an intraday indicator popularly used by institutions and algorithms to identify fair value for entry. It helps trades to identify trend direction and dynamic support resistance level.
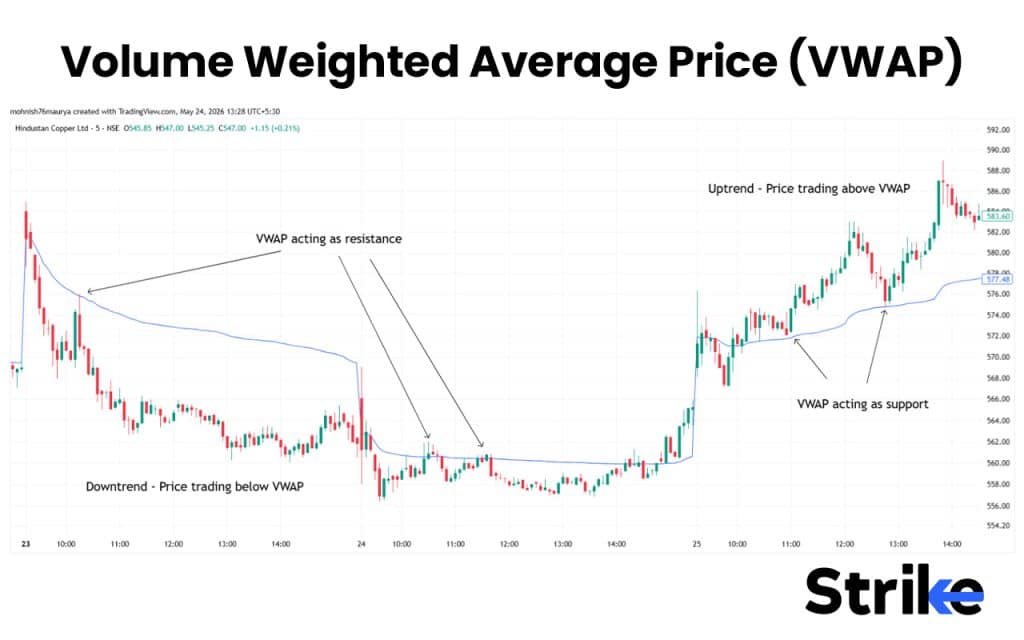
Traders use VWAP in three different ways for intraday trading which are briefly discussed below.
- For Trend Identification: VWAP acts as an intraday trend filter. Price sustaining above VWAP suggests an uptrend, while price sustaining below VWAP suggests downtrend.
- For Pullback Trading: During an uptrend, traders usually plan to enter long when price pullbacks to VWAP and form a strong bullish candle or pattern, whereas during downtrend, trades plan to sell when price retrace back to VWAP and form strong bearish candle or pattern.
- VWAP Mean Reversion: This strategy works on a mathematical concept of mean reversion, which means the market will return to its VWAP after extremely deviating away from it. After extreme expansion away from VWAP, price often retraces back toward the average traded price.
Mean reversion setup fails in trending markets because price keeps moving away from the VWAP. Intraday mean-reversion systems around VWAP have shown a 55%–70% win rate in liquid markets because prices naturally gravitate toward fair-value execution zones.
| VWAP Summary Table | |
|---|---|
| Category | Price & Volume Indicator |
| Type | Lagging Indicator |
| Best Use | Intraday Trend Identification & Dynamic Support/Resistance |
| Market Condition | Intraday Trending Markets |
8. Bollinger Bands
Bollinger Band is a volatility based indicator that measures the market volatility using +2 and -2 standard deviation of 20-period moving average. Bollinger band consists of three bands, which is the upper band (+2SD), middle band (20 period SMA), and a lower band (-2SD). The middle band (20 SMA) acts as base for SD calculation and also acts as a dynamic support and resistance.
Trade use bollinger bands in trading to understand market volatility, overbought and oversold conditions and breakout points.
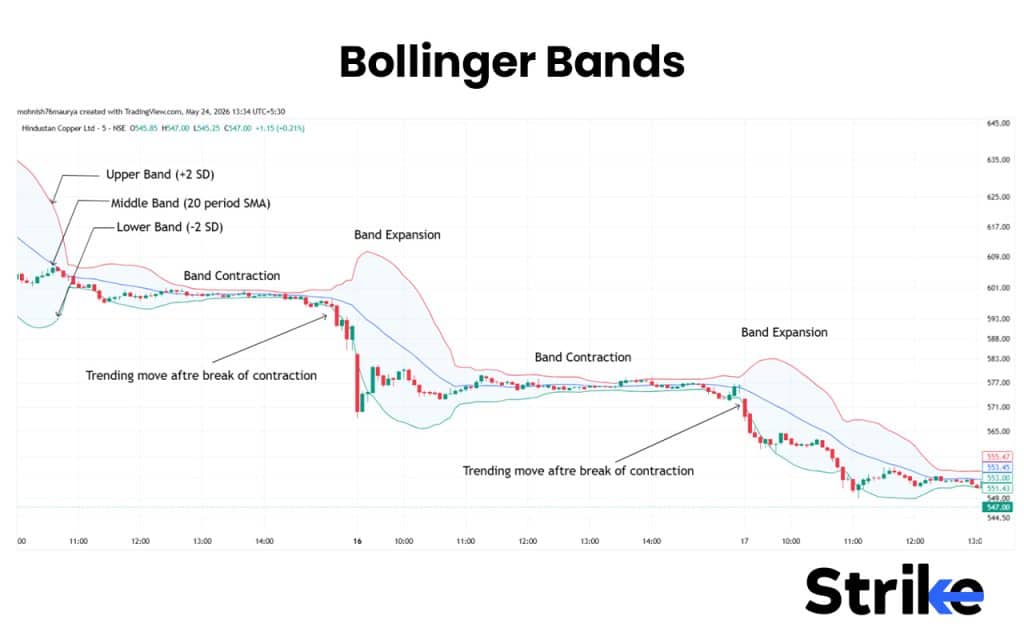
- Bollinger Band Bounce Strategy: This setup works on mean reversion concept. In a rangebound market, when price reaches one of the bands, either upper band or lower band, price often moves back to the middle band. However, trending market prices can keep moving on upper and lower bollinger bands for a long period of time instead of reversing, hence it is important to enter reversal trade only after confirmation.
- Bollinger Band Squeeze Strategy: Bollinger band contracts and expands based on market volatility. When the band squeezes, it means volatility has reduced. Traders closely watch such band squeeze because strong moves often come after a low volatility phase. A breakout of squeeze can fail, so confirm the breakout using volume and momentum expansion.
- Walking the Band: During a strong trending market, price continues to move near the upper or lower bollinger band instead of reversing. Traders utilize this momentum to catch short-term trends.
The real power of Bollinger Bands lies in volatility contraction. A Bollinger Squeeze often signals upcoming volatility expansion before explosive moves occur.
| Bollinger Bands Summary Table | |
| Category | Volatility Indicator |
| Type | Lagging Indicator |
| Best Use | Volatility Measurement, Breakouts & Mean Reversion |
| Market Condition | Volatile & Range-bound Markets |
9. Market Profile
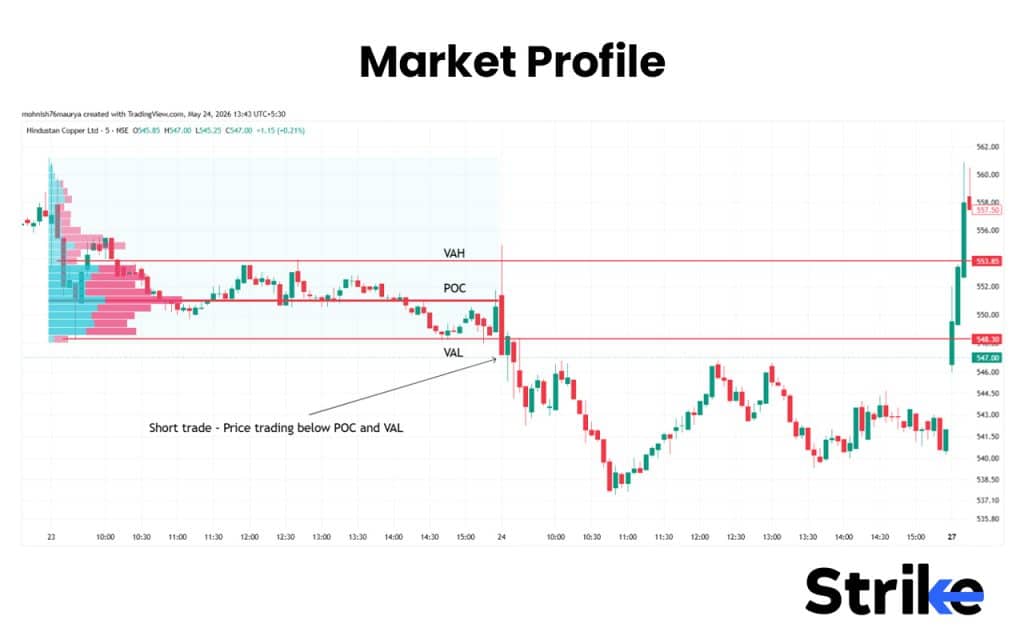
Market profile is an analysis tool that identifies the important price level on a chart where the market has spent most of its time and where the majority of trading volume has occurred during a particular session. This indicator works on auction market theory, which means the market continuously keeps searching for fair value between buyers and sellers. This helps traders to identify the fair value, support & resistance zones, and possible breakout areas.
Market Profile organizes price activity into a structure that helps traders understand where the market accepted or rejected price.
- POC (Point of Control): Price level where maximum trading activity occurred
- Value Area High (VAH): Upper boundary of fair value zone
- Value Area Low (VAL): Lower boundary of fair value zone
- Initial Balance (IB): Price range formed during the early trading session
- Single Prints: Single prints are areas where price moved quickly with very little trading activity, often indicating aggressive buying or selling imbalance.
To trade using Market Profile, focus on value area behavior, rejection, and volume participation.
- Buy Setup: Look for a long entry if the price is trading above the value area or breaks above the value area high (VAH), because this indicates that the buyers are ready to trade above fair value.
- Sell Setup: Look for a short entry if the price is trading below the value area or breaks below the low of the value area (VAL), because sellers are willing to trade at a lower price than the fair price.
- Range Trading Setup: When the market trades inside the range of value between VAH and VAL, it is expected to stay sideways. Traders can follow sell at support and buy at resistance style of trading during this condition.
- Breakout Setup: A breakout outside the value area with strong momentum and follow-through candles often signals trend expansion and directional movement.
Intraday traders closely watch the Initial Balance because breakouts from this early session range often set the tone for the day. It is important to note that market profile works best in liquid and high volume stocks.
| Market Profile Summary Table | |
|---|---|
| Category | Price Action & Volume Distribution Tool |
| Type | Contextual/Analytical Tool |
| Best Use | Identifying Value Area, Support/Resistance & Market Structure |
| Market Condition | Trending & Range-bound Markets |
10. Money Flow Index (MFI)
Money Flow Index (MFI) also known as volume-weighted RSI is a volume-based momentum indicator that combines both price and volume to calculate buying and selling pressure. Unlike RSI which only uses price movement, MFI includes volume along with price to generate strong signals.
Just like RSI, the Money Flow Index (MFI) also oscillates between 0 and 100, indicating overbought and oversold zones.
- A value above 80 suggests overbought conditions, indicating possible fall.
- A value below 20 suggests oversold condition, indicating possible bounce.
- Between 20 to 80 suggests a balanced market zone without extreme buying and selling pressure.
Such extreme MFI reading often appears during a panic selling or emotional buying.
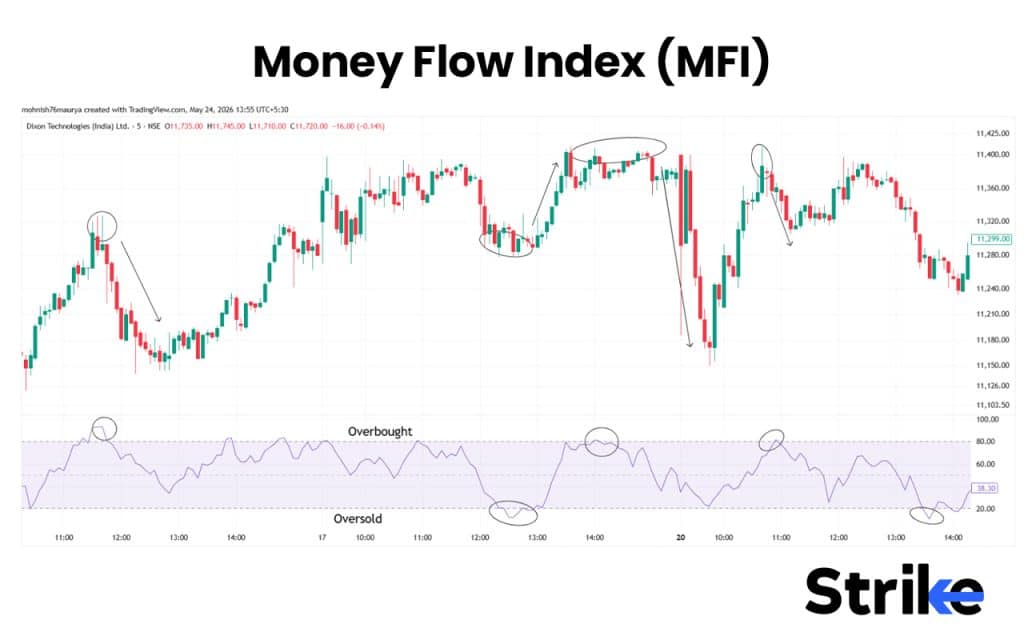
- Buy Setup: Look for a long entry during an oversold condition (below 20) and enter after bullish confirmation (bullish candle, support bounce, or reversal pattern).
- Sell Setup: Look for a short entry during an overbought condition (above 80) and enter after bearish confirmation (bearish candle, resistance rejection).
- Divergence Setup: When price and MFI both move in opposite directions, it suggests exhaustion of the ongoing trend and a potential trend reversal. For instance, if the price is making a new high but the indicator is making a lower high, it forms bearish divergence which signals potential bullish reversal.
- Trend Confirmation: Rising price supported by a rising MFI suggests a strong buying participation behind the trend.
Extreme MFI spikes often identify emotional climax buying or panic selling better than RSI because MFI includes participation strength through volume.
| MFI Summary Table | |
|---|---|
| Category | Volume-Based Momentum Oscillator |
| Type | Leading Indicator |
| Best Use | Overbought/Oversold Conditions & Volume Strength Analysis |
| Market Condition | Range-bound & Reversal Markets |
11. Choppiness Index
Choppiness index is a volatility based indicator that helps traders to understand the environment of the market, whether the market is trending or sideways. Unlike other trend indicators that show direction, choppiness index only shows strength of the consolidation and trend, not the direction.
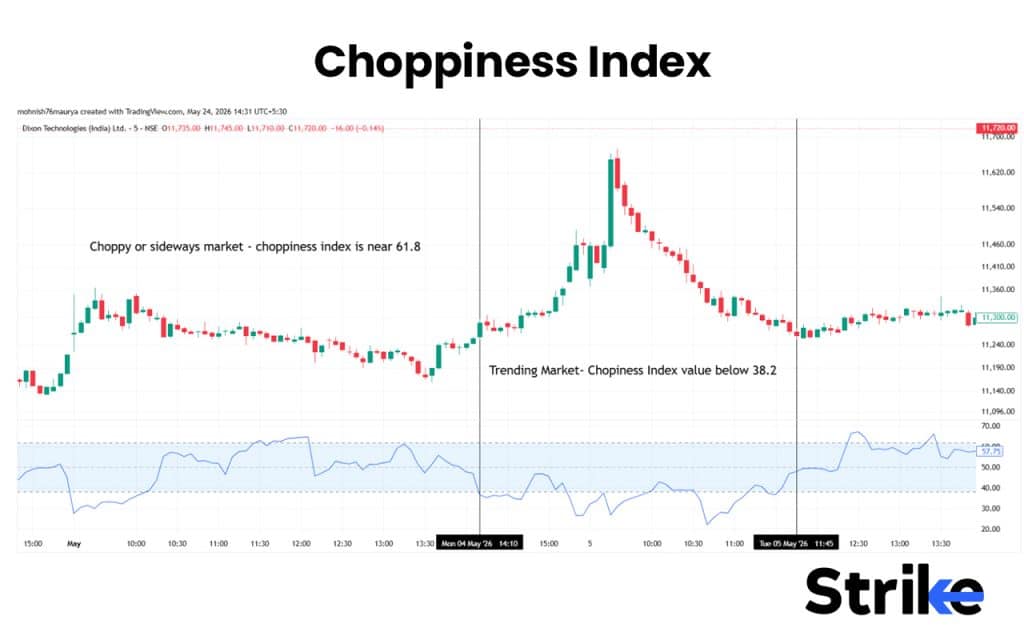
The value of the choppiness indicator oscillates between 0 and 100, where 61.8 and 38.2 are important levels derived from the fibonacci ratio.
- A value above 61.8 suggests a choppy or sideways market due to balanced buyers and sellers.
- A value below 38.2 suggests a strong trending market
- Between 38.2 to 61.8 suggests a transition phase
To trade using CHOP, combine it with trend indicators, price action, or breakout setups.
- Trending Market Setup: Look for trending opportunities when CHOP falls below 38.2. As we have discussed earlier, CHOP only shows strength not direction, use it along with moving averages, breakouts, or momentum indicators for confirmation.
- Sideways Market Setup: When CHOP value rises above 61.8, look for range-bound or mean reversion setups, as during this phase the market may continue consolidating within support and resistance zones.
- Breakout Setup: After a prolonged consolidation phase, a sharp decline in CHOP often signals the beginning of a directional breakout. Avoid trading breakouts if the CHOP value is high specially in intraday trading.
- Trend Exhaustion Setup: If the market is trending strongly and the Choppiness Index starts rising again, it may indicate slowing momentum or possible consolidation ahead.
Its greatest value is strategy selection. Traders use high choppiness readings for mean-reversion systems and low choppiness readings for breakout systems. It therefore acts as a market regime detector rather than a direct entry indicator.
| Choppiness Index Summary Table | |
|---|---|
| Category | Volatility & Trend Indicator |
| Type | Lagging Indicator |
| Best Use | Identifying Trending vs Sideways Markets |
| Market Condition | Sideways & Transition Markets |
12. Darvas Box Theory
Darvas Box theory, developed by Nicolas Darvas is a price action based trading theory which says that the price moves in a definite price range before making a strong directional breakout. It helps traders to stay in a strong trend until it reverses.
The darvas box is drawn by marking recent swing high and recent swing low as the range of the box while price trading within it is marked as a consolidation.
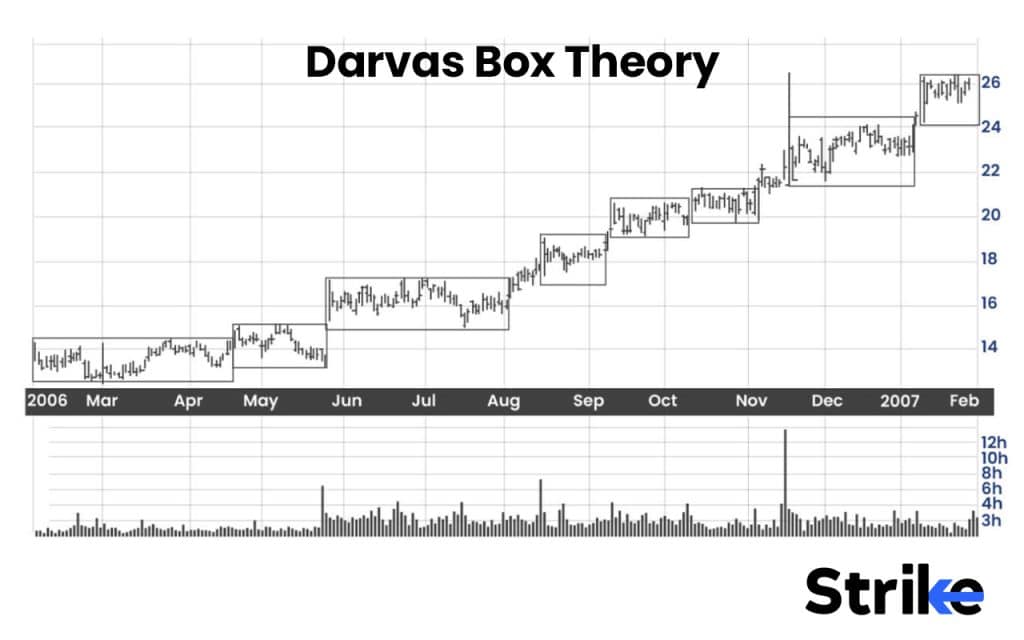
Darvas box theory is mainly used for momentum and breakout trading. Traders usually watch for darvas box consolidation, breakout, and volume confirmation.
- Buy Setup: Enter long when price breaks above upper boundary of the darvas box with a strong volume. Place the stoploss below the lower boundary of the box.
- Sell Setup: Enter short when price breaks below the lower range of the darvas box with a good volume. Use the upper range of the darvas box as a stoploss.
- Trend Trading: In a strong trending market, darvas box appears one after the other. Each break forms a new box and provides a fresh entry opportunity. You can ride the market trend until the market breaks the darvas box on the opposite side of the trend.
Darvas box works best in trending markets, momentum stocks and breakout scenarios. Avoid trading darvas box breakout with a low volume. Darvas box usually has a low winrate, but has large winners.
| Darvas Box Summary Table | |
|---|---|
| Category | Breakout Trading Indicator |
| Type | Lagging Indicator |
| Best Use | Identifying Breakouts & Trend Continuation |
| Market Condition | Strong Trending Markets |
13. Ichimoku Cloud
The Ichimoku cloud is all in one indicator which combines trend direction, support & resistance, momentum, and potential reversal zones into a single system. Unlike other traditional indicators, ichimoku clouds provide a complete view of market structure and use multiple lines and cloud formation.
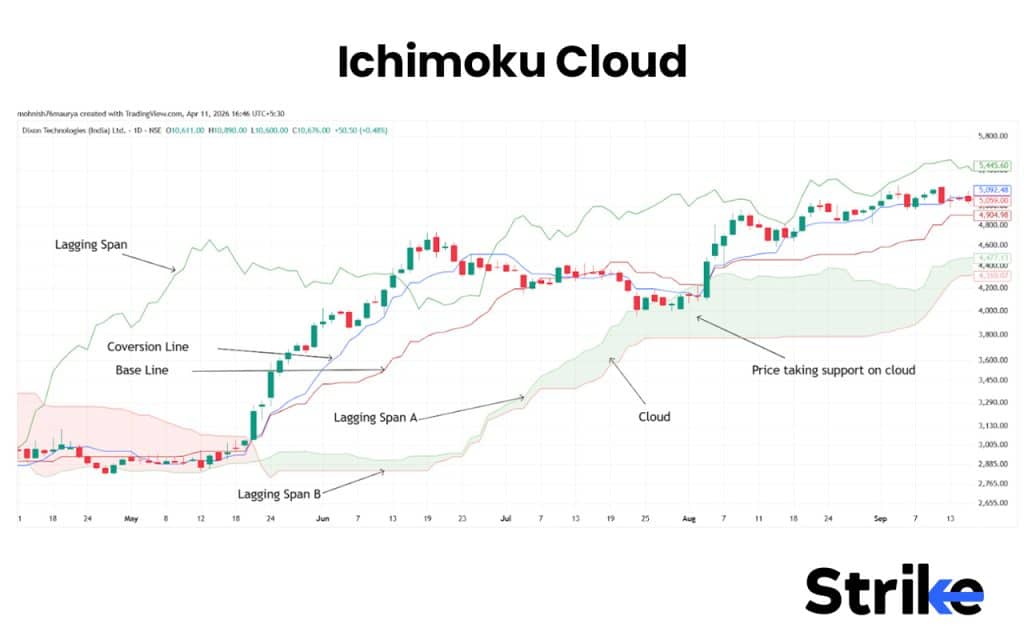
The Ichimoku cloud consists of four major components which are briefly discussed below.
- Tenkan-sen (Conversion Line): It shows short-term market momentum.
- Kijun-sen (Base Line): It shows medium-term trend direction
- Senkou Span A & B (Cloud): The cloud represents an equilibrium zone between buyers and sellers and acts as a dynamic support/resistance. A thick cloud usually acts as a stronger support and resistance zone, while a thin cloud can break more easily.
- Chikou Span (Lagging Line): It compares current price with past price action to confirm whether momentum supports the trend.
Price trading above the cloud indicates a bullish trend, while price trading below cloud indicates bearish trend. Interaction of these components with price generate actionable trading signals useful for intraday trades.
- Buy Setup: Enter long when price moves above the cloud and the Tenkan-sen crosses above the Kijun-sen. The bullish trend is further confirmed when the cloud ahead is also bullish.
- Sell Setup: Enter short when the price moves below the cloud and the Tenkan-sen crosses below the Kijun-sen. Here the bearish trend confirms further if the cloud ahead is also bearish.
- Dynamic Support & Resistance: As clouds help identify trends, they work as a dynamic support and resistance zone. Cloud acts as a support during strong uptrend, whereas cloud acts as a resistance during a strong downtrend.
Ichimoku works best in trending markets where traders want trend direction, momentum, and support-resistance analysis together in one system.
| Ichimoku Cloud Summary Table | |
|---|---|
| Category | Trend-Following Indicator |
| Type | Leading & Lagging Indicator |
| Best Use | Trend Direction, Momentum & Support/Resistance Analysis |
| Market Condition | Trending Markets |
14. Average True Range (ATR)
Average True Range (ATR) is a volatility based indicator that measures the average price movement of a stock over a specific period. Unlike other indicators which tell about market direction and buy/sell signals, ATR tells about whether the market is calm or volatile and how wide should be the stop loss in this volatility, instead of direction.
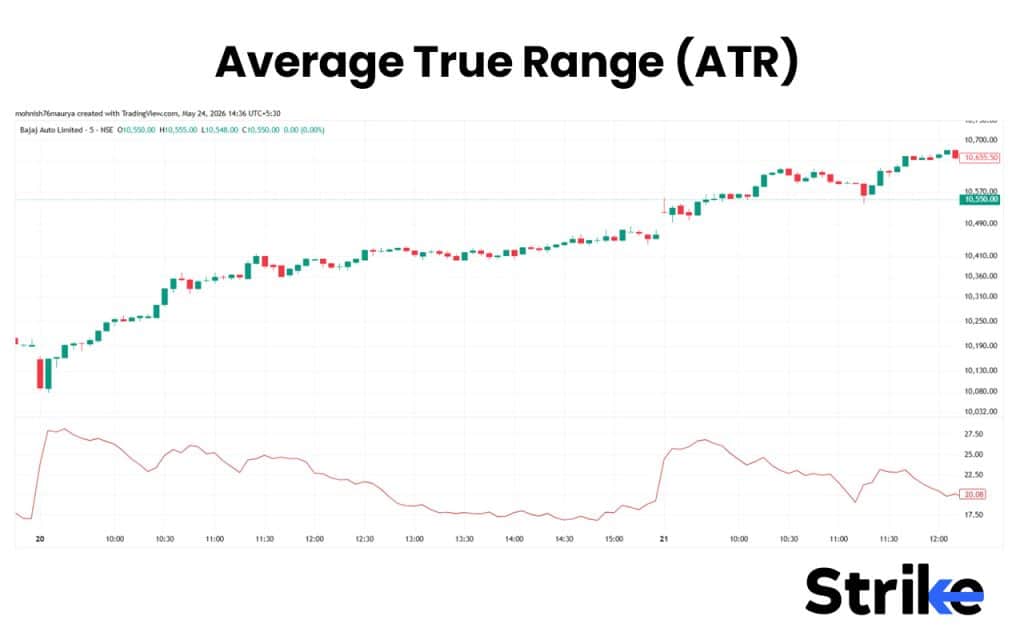
Hence trades use ATR to measure volatility, manage position sizing, stoploss placement, target calculation, and identifying breakout expansion.
- ATR for Stop-loss: Instead of putting fixed stoploss distance, traders use ATR value to calculate stop-loss based on volatility. To get the stop-loss level using ATR, multiply the ATR value of the stock with a multiplier (1.5 or 2), this will give you stop-loss distance.
- ATR for Position Sizing: After getting the stop-loss level based on ATR, position sizing is automatically adjusted based on risk-reward. When the value of ATR is high, traders usually reduce the positions, while during the period of low ATR, more positions are traded.
- For Breakout Confirmation: ATR contraction often appears during consolidation phases before breakout, while ATR expansion suggests increase in volatility and momentum.
- ATR for Target: Apart from stop-loss, ATR also helps traders to estimate realistic targets. If the ATR value is ₹20, it means stock typically moves around ₹20 on average during the selected timeframe.
ATR is more of a risk management indicator rather than a buy and sell signal indicator. Strategies often become more stable when ATR-based exits replace fixed percentage stop losses.
| ATR Summary Table | |
|---|---|
| Category | Volatility Indicator |
| Type | Lagging Indicator |
| Best Use | Measuring Volatility & Setting Stop-Loss Levels |
| Market Condition | Volatile & Trending Markets |
15. Cumulative Delta
Cumulative delta is an order-flow based trading indicator that measures the difference between aggressive buying and aggressive selling volume in the market. Aggressive buyers and sellers are those traders in the market who are ready to buy and sell immediately at market price. This helps traders to understand who is dominating the market, sellers or buyers.
- A rising cumulative delta suggests that the aggressive buyers are dominating.
- A falling cumulative delta suggests that the sellers are dominating.
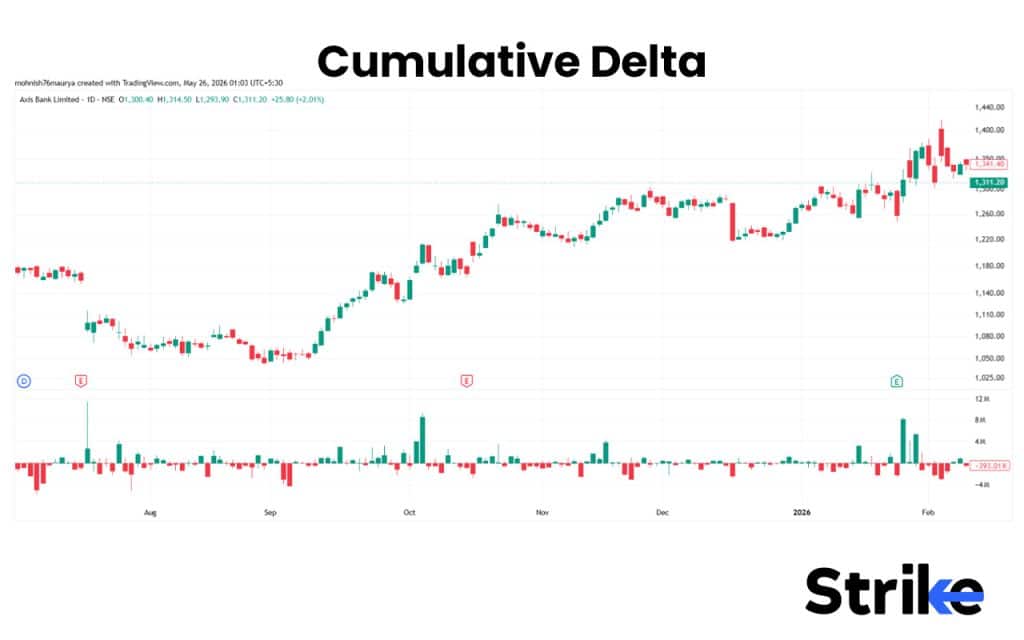
Traders mainly use Cumulative Delta for identifying institutional activity, breakout confirmation, trend continuation, absorption, and divergence analysis.
- Trend Confirmation Setup: A rising price along with cumulative delta indicator suggests strong uptrend driven by strong buyers participation. Whereas, falling price supported by declining cumulative delta confirms downtrend.
- Divergence Setup: If price is making higher highs but cumulative delta is making lower highs, it may indicate weakening buying pressure and possible reversal. Similarly, bullish divergence appears when price falls but cumulative delta starts rising.
- Breakout Confirmation Setup: When a price breaks key support or resistance level supported by strong cumulative delta expansion, it confirms that the breakout is driven by aggressive participation.
- Spotting absorption: When aggressive sellers enter the market, but price stops falling further, it indicates passive buyers are absorbing the selling pressure. This signals a hidden buying opportunity before the trend reverses.
One of the biggest advantages of Cumulative Delta is its ability to reveal hidden buying or selling pressure before it becomes visible on price charts. Cumulative Delta performs extremely well in highly liquid stocks, index and index futures, but its performance drops in illiquid stocks or manipulated smallcaps.
| Cumulative Delta Summary Table | |
|---|---|
| Category | Order Flow & Volume Indicator |
| Type | Leading Indicator |
| Best Use | Identifying Buying/Selling Pressure & Market Sentiment |
| Market Condition | Trending & High-Volume Markets |
How to Choose the Right Indicator for Intraday Trading?
Choosing the right indicator for intraday trading totally depends on your trading style, whether you want to trade momentum, trend, volatility or consolidation. Based on this indicators are categorised in four categories.
| Indicator Type | Purpose | Examples |
|---|---|---|
| Trend | Direction of market | EMA, Supertrend |
| Momentum | Speed of move | RSI, MACD |
| Volume | Participation strength | VWAP, OBV |
| Volatility | Risk and expansion | ATR, Bollinger Bands |
Avoid choosing indicators from the same category. Combine indicators from different categories to get the overall picture of the market.
How Accurate are Intraday Trading Indicators?
| Indicator | Approximate Accuracy Range | Best Use Case |
|---|---|---|
| Relative Strength Index (RSI) | 55% – 65% | Sideways and reversal markets |
| MACD | 50% – 60% | Trend momentum confirmation |
| Stochastic Oscillator | 55% – 65% | Range-bound markets |
| Exponential Moving Average (EMA) | 60% – 70% | Trend-following intraday setups |
| Average Directional Index (ADX) | 55% – 65% | Measuring trend strength |
| On-Balance Volume (OBV) | 50% – 60% | Volume confirmation |
| VWAP | 65% – 75% | Institutional intraday trading |
| Bollinger Bands | 55% – 65% | Volatility and mean reversion |
| Market Profile | 60% – 75% | Support/resistance and value zones |
| Money Flow Index (MFI) | 55% – 65% | Volume-based momentum analysis |
| Choppiness Index | 50% – 60% | Identifying trending vs sideways markets |
| Darvas Box Theory | 60% – 70% | Breakout trading |
| Ichimoku Cloud | 60% – 75% | Complete trend-following system |
| Average True Range (ATR) | 65% – 75% | Stop-loss and volatility measurement |
| Cumulative Delta | 60% – 75% | Order flow and aggressive buying/selling analysis |
Best Indicator Combinations for Intraday Trading
Best indicator combinations for intraday trading are those where each indicator serves a different purpose. A good combination of indicators for intraday helps traders to identify market direction, confirm momentum strength, measure breakout reliability, improve entry and exit timing, and manage risk more effectively.
The table given below suggests some popularly used indicator combinations.
| Indicator Combination | Purpose |
|---|---|
| EMA + RSI | Trend direction with momentum confirmation |
| VWAP + Volume | Institutional activity and breakout strength |
| MACD + RSI | Trend momentum and reversal confirmation |
| Bollinger Bands + RSI | Volatility with overbought/oversold signals |
| ADX + EMA | Trend strength with trend direction |
| Stochastic + Support/Resistance | Reversal and pullback entries |
| OBV + Price Action | Volume confirmation with breakout validation |
| ATR + Moving Average | Volatility-based stop-loss and trend trading |
The goal of using indicator combinations is not to predict the market perfectly but to improve probability and intraday trade quality.
How to Trade Using Intraday Trading Indicators?
Intraday indicators are used in intraday trading mainly to identify trend, momentum, volume strength, and possible entry or exit points during the trading session. There are four major steps to trade using the intraday indicator, where every step utilizes a different indicator.
- Trend Identification: Indicators like moving average, VWAP, and supertrend are commonly used to identify market trends. These indicators help to avoid trading against the trend.
- Wait for Proper Setup: After identifying the trend, don’t enter immediately. Wait for setups to form, like breakout patterns or pullbacks. For instance, traders look for bullish continuation patterns in uptrend.
- Entry: Enter the trade once price breaks the pattern or completes the pullback. Use indicators like RSI, MACD to confirm the breakout. MACD bullish crossover or RSI crossing above 60 after breakout are very common ways to confirm the breakout.
- Stoploss: Place stoploss below recent swing low or high, or use ATR indicator to place stoploss based on volatility.
Choosing the right Timeframe for Trading is essential, but the correct way to use indicators on any chart is not by blindly following buy and sell signals. By combining indicators with price action and market structure within your chosen Timeframe for Trading, you can filter out noise and improve the reliability of your signals.
What are the Best Timeframes for Using Intraday Indicators?
The best timeframe to use intraday trading indicator totally depends on style of trading and a risk appetite. Extremely small timeframes like 1 min or 3 min will generate higher false signals while timeframes higher than 1 and 3 min comparatively generate more reliable signal.
The table below shows the best timeframe for using intraday trading indicators based on trading style.
| Trading Style | Common Timeframe |
|---|---|
| Scalping | 1-Minute to 5-Minute |
| Intraday Trading | 5-Minute to 15-Minute |
| Short-Term Momentum Trading | 15-Minute to 1-Hour |
However, you can also use a multi-timeframe analysis system alongside your Trading Indicators to improve signal quality and reduce false trades. This approach ensures that the signals generated by your Trading Indicators are backed by the broader market trend, leading to more consistent results.
Benefits & Limitations of Intraday Indicators
The benefits and limitations of the intraday indicator are mentioned below in the table.
| Benefits of Intraday Indicators | Limitations of Intraday Indicators |
|---|---|
| Help identify market trend direction | Can generate false signals in choppy markets |
| Improve entry and exit timing | Indicators lag because they use past data |
| Assist in momentum confirmation | No indicator is 100% accurate |
| Help traders measure volatility | Different indicators work differently in different market conditions |
| Confirm breakout and reversal strength | Overusing indicators creates confusion |
| Support risk management and stop-loss placement | Indicators alone cannot predict future price movement |
| Reduce emotional decision-making | Signals may fail during high volatility or news events |
| Help traders follow a structured trading process | Require experience and practice for proper interpretation |
| Useful for trend-following and scalping strategies | Late signals may reduce reward-to-risk ratio |
| Combine price, volume, and momentum analysis | Blindly following indicators can lead to losses |
In the context of Swing Trading, their effectiveness depends on market conditions, proper risk management, and how well traders combine them with price action and volume. For anyone serious about Swing Trading, success comes from integrating these tools with an overall understanding of the market to capture sustained price moves.
 24 mins